全文HTML
--> --> -->非牛顿流体的剪应力与剪切应变率之间为非线性关系, 会表现出剪切增稠[9]、剪切变稀[10]等不同于牛顿流体的运动行为. 非牛顿流体广泛存在于自然界和工业生产中, 如化工中的聚乙烯、聚氯乙烯, 食品中的淀粉液, 人体内的血液等. 非牛顿流体种类众多, 其中具有代表性的是幂律流体. 幂律流体按照幂律指数主要分为剪切变稀流体、剪切增稠流体. 作为特例, 牛顿流体可视为指数为1的幂律流体. ****们开展了大量的幂律流体实验与仿真的研究, 如Johnston等[11]发现相比于牛顿流体, 用幂律流体模拟血液流动, 可获更精准的壁面切应力; Zhao等[12]模拟了幂律流体在微通道中的电渗流动; Hojjat等[13]通过实验研究了含纳米颗粒流体的剪切变稀行为. 但是, 关于幂律流体转捩问题的鲜有研究报道.
与有限差分和有限体积等传统方法不同, 格子Boltzmann方法(lattice Boltzmann method, LBM)[14]通过对分布函数进行碰撞和迁移处理, 可实现宏观流场时空演化过程的模拟, 具有并行性高, 边界处理简单等优势, 已在牛顿流体仿真领域取得大量研究成果[15-17]. 近年来, 也有****将LBM拓展至非牛顿流体模拟, 如Boyd等[18]在LBM框架下实现了幂律流体中速度导数的快速求解; Wang和Ho[19]在LBM的框架下模拟了剪切变稀的血液流动; Chen等[20]模拟了幂律流体通过多孔介质的流动. 然而, 将LBM应用于幂律流体转捩问题研究仍有待探索.
基于此, 本文以二维顶盖驱动流为物理模型, 以格子Boltzmann方法为核心求解器, 采用非牛顿流体幂律模型, 开展了非牛顿流体二维顶盖驱动流转捩模拟, 并借助快速傅里叶变换、本征正交分解(proper orthogonal decomposition, POD)等方法, 分析了转捩点附近的流场时频域特性及模态分布.
2.1.物理模型
顶盖驱动流模型如图1所示, 上顶板为运动壁面, 速度为U0, 其余3个壁面均为静止无滑移壁面. 模型水平和竖直方向上长度分别为Lx和Ly, 且Lx = Ly = L0, L0为特征长度. 图1中, 坐标原点O位于底面与左壁面交点处. 为定量表征流场状态与雷诺数(Reynolds number, Re)之间的关系, 选取监控点坐标为(0.6L0, 0.6L0). 图 1 算例模型示意图
Figure1. Schematic diagram of calculation model.
幂律流体运动黏性系数的计算公式如下:


雷诺数的定义为[21]
2
2.2.数值方法
采用LBM多松弛时间模型[22], 并使用基于统一计算设备构架的显卡并行加速技术[23]来提高计算速度. 其中, 多松弛时间模型表达式为


针对文中研究的二维顶盖驱动流, 选用经典D2Q9模型[24], 离散速度


流场中宏观速度与压强的求解公式为

 图 2 LBM与幂律模型耦合计算流程示意图
Figure2. Diagram of coupling calculation process between LBM and power law model.
2
2.3.POD方法
POD[29,30]是一种广泛应用于流场降阶模型中的方法, 可用于流场特征信息的提取. 以速度POD为例, 已知N个时刻流场速度信息


另外,


2
2.4.第一转捩雷诺数计算
在顶盖驱动流中, 随着Re增加, 呈现出的流动状态往往是从层流逐步过渡到湍流, 并存在Hopf分岔现象. 通过在流场的特定位置处设置监控点的方法[5,31], 可以研究Hopf分岔现象. 开始产生分岔现象时的雷诺数, 即第一转捩雷诺数可以通过如下的方式计算:


3.1.算例验证
为了验证计算的准确性, 这里首先给出了牛顿流体顶盖驱动流模拟结果. 图3为Re = 5000时, 方腔中心线上的速度分布与Peng等[5]结果的对比, 其中X-v曲线显示的是竖直方向上方腔的中心线上速度分量分布, 即纵坐标y/L = 0.5上的X和v之间的对应关系; Y-u曲线显示的是水平方向上的中心线上速度分量分布, 即横坐标x/L = 0.5上的Y和u之间的关系. Peng等[5]在牛顿流体顶盖驱动流转捩问题研究中, 使用的是限差分法, 本文的计算结果与Peng等[5]对比良好. 值得注意的是Peng等[5]求解对流项使用的是七阶迎风格式, 扩散项使用的是六阶中心差分格式.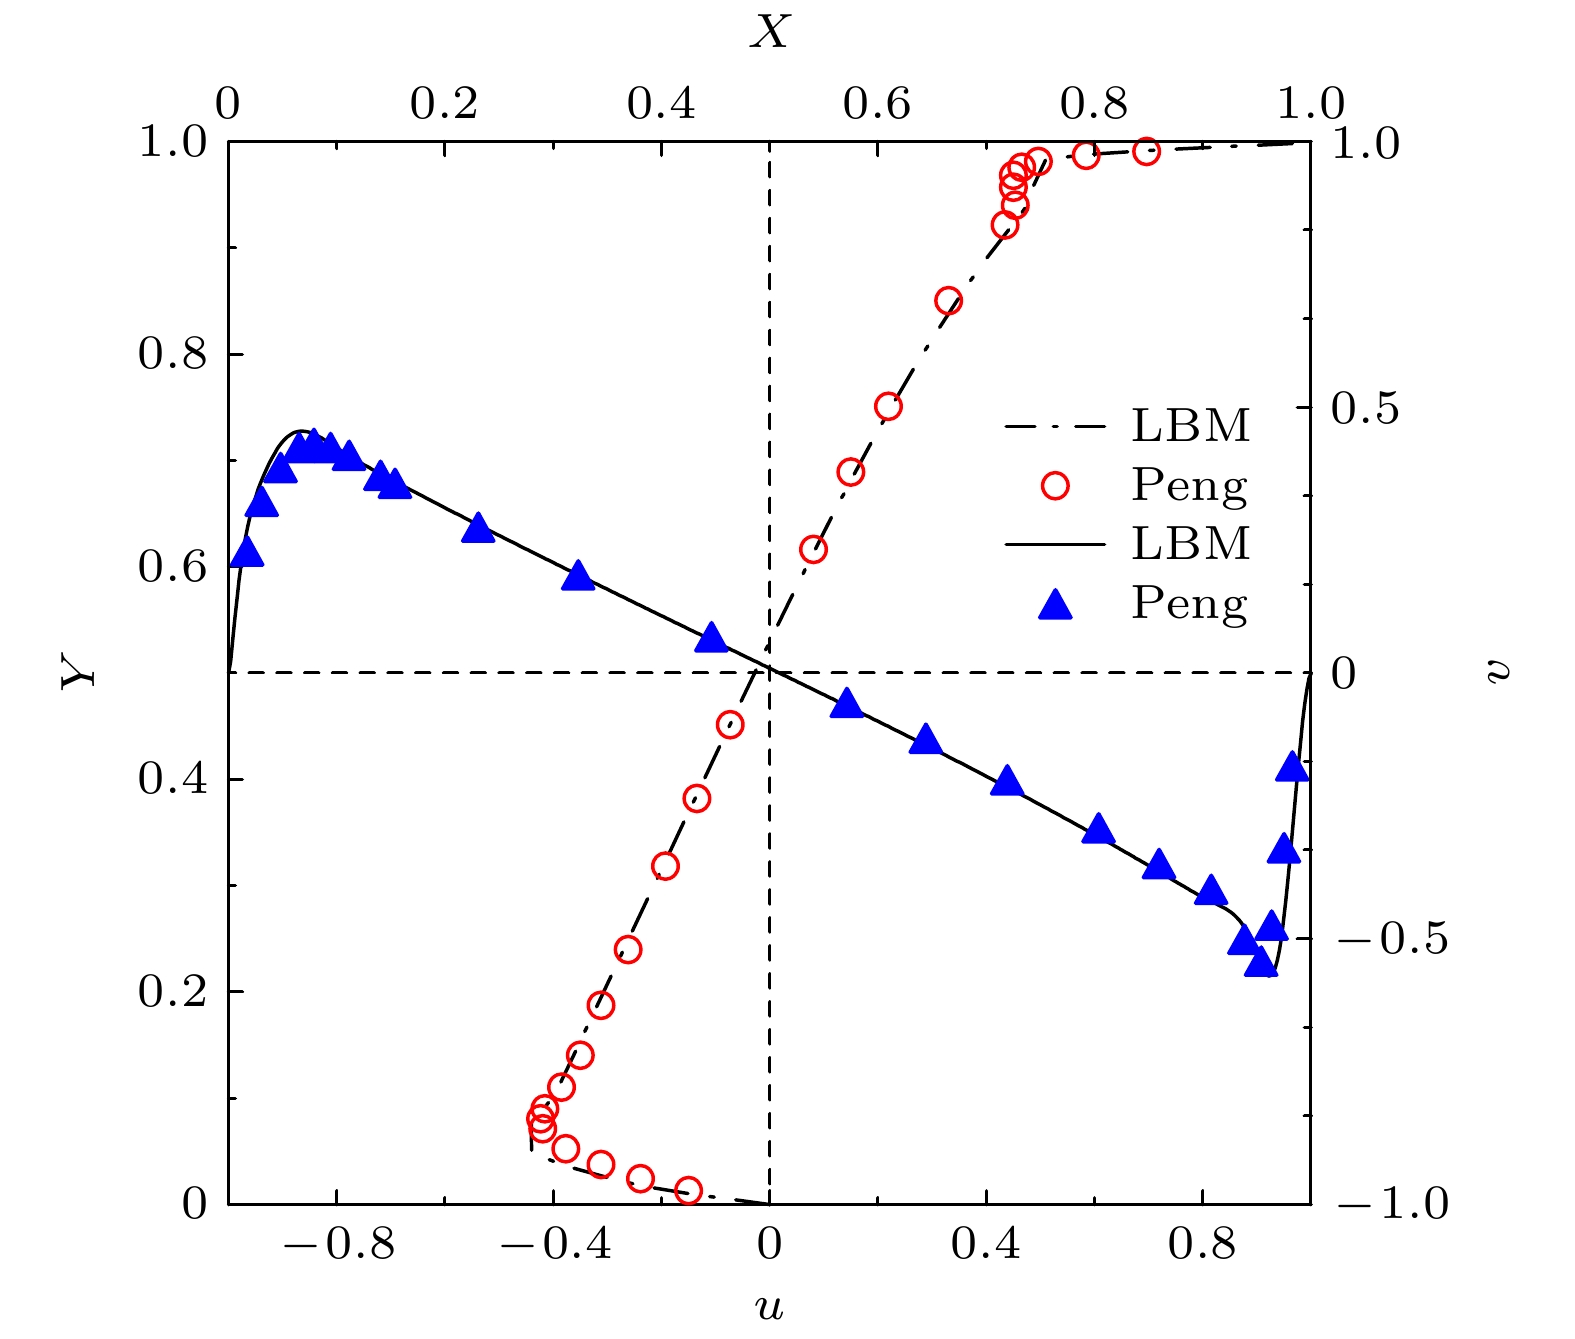 图 3 顶盖驱动流在中心线处的速度分布
Figure3. Velocity distribution at center line of lid-driven flow.
2
3.2.第一转捩雷诺数
按照文中2.4节的方法得到牛顿流体、剪切变稀流体和剪切增稠流体的第一转捩雷诺数依次为7835, 5496和11546, 结果如图4所示. 图 4 转捩临界雷诺数
Figure4. Transition critical Reynolds number.
将本文计算的牛顿流体转捩雷诺数与文献的结果进行比对, 如表1所列, 可以看出, 本文计算的牛顿流体转捩临界雷诺数相对于Peng等[5]和Poliashenko与Aidu[32]的计算结果而言较大, 而相对于Cazemier等[31]和Bruneau与Saad[6]的计算结果而言较小, 但是从总的相对误差的值来看, 误差上限不超过5%, 可以看出本文计算可靠性较高.
| 转捩临界雷诺数 | |
| 本文 | 7835 |
| Peng等[5] | 7704 |
| Poliashenko和Aidu[32] | 7763 × (1% ± 2%) |
| Cazemier等[31] | 7819 |
| Bruneau和Saad[6] | 8000—8030 |
表1牛顿流体转捩临界雷诺数计算结果的对比
Table1.Comparison of calculation results of critical Reynolds number for Newtonian fluid transition.
相比于牛顿流体, 剪切变稀流体的转捩雷诺数较低, 即剪切变稀流体更容易从定常状态向周期态转变. 而由剪切变稀流体本身的定义可知, 剪切速率越大, 其黏性会越低, 流动状态也越容易发生转变, 这与计算结果表现出的性质是相符合的. 与牛顿流体相比, 剪切增稠流体的转捩临界雷诺数较高, 即剪切增稠流体更不易从定常状态向周期态转变. 而根据剪切增稠流体本身的定义可知, 剪切速率越大, 其黏性会越大, 流动状态也越不易发生转变.
2
3.3.速度监控点时频域特性
选取三类流体在转捩雷诺数附近的流场, 进行时频域分析. 图5给出了三类流体在转捩雷诺数附近, 速度监控点处的时频域特性图. 其中图5(a)—(c)给出了三类流体在转捩前后, 水平方向速度随时间的变化, 可以看出, 三类流体在转捩发生前的定常流动状态下, 速度为一水平直线, 在转捩雷诺数附近, 速度均呈现周期性变化的特点, 在转捩后湍流状态下, 速度有明显的大幅度波动. 对水平速度作快速傅里叶变换得图5(d)—(f), 在发生转捩前, 由于其直流部分即


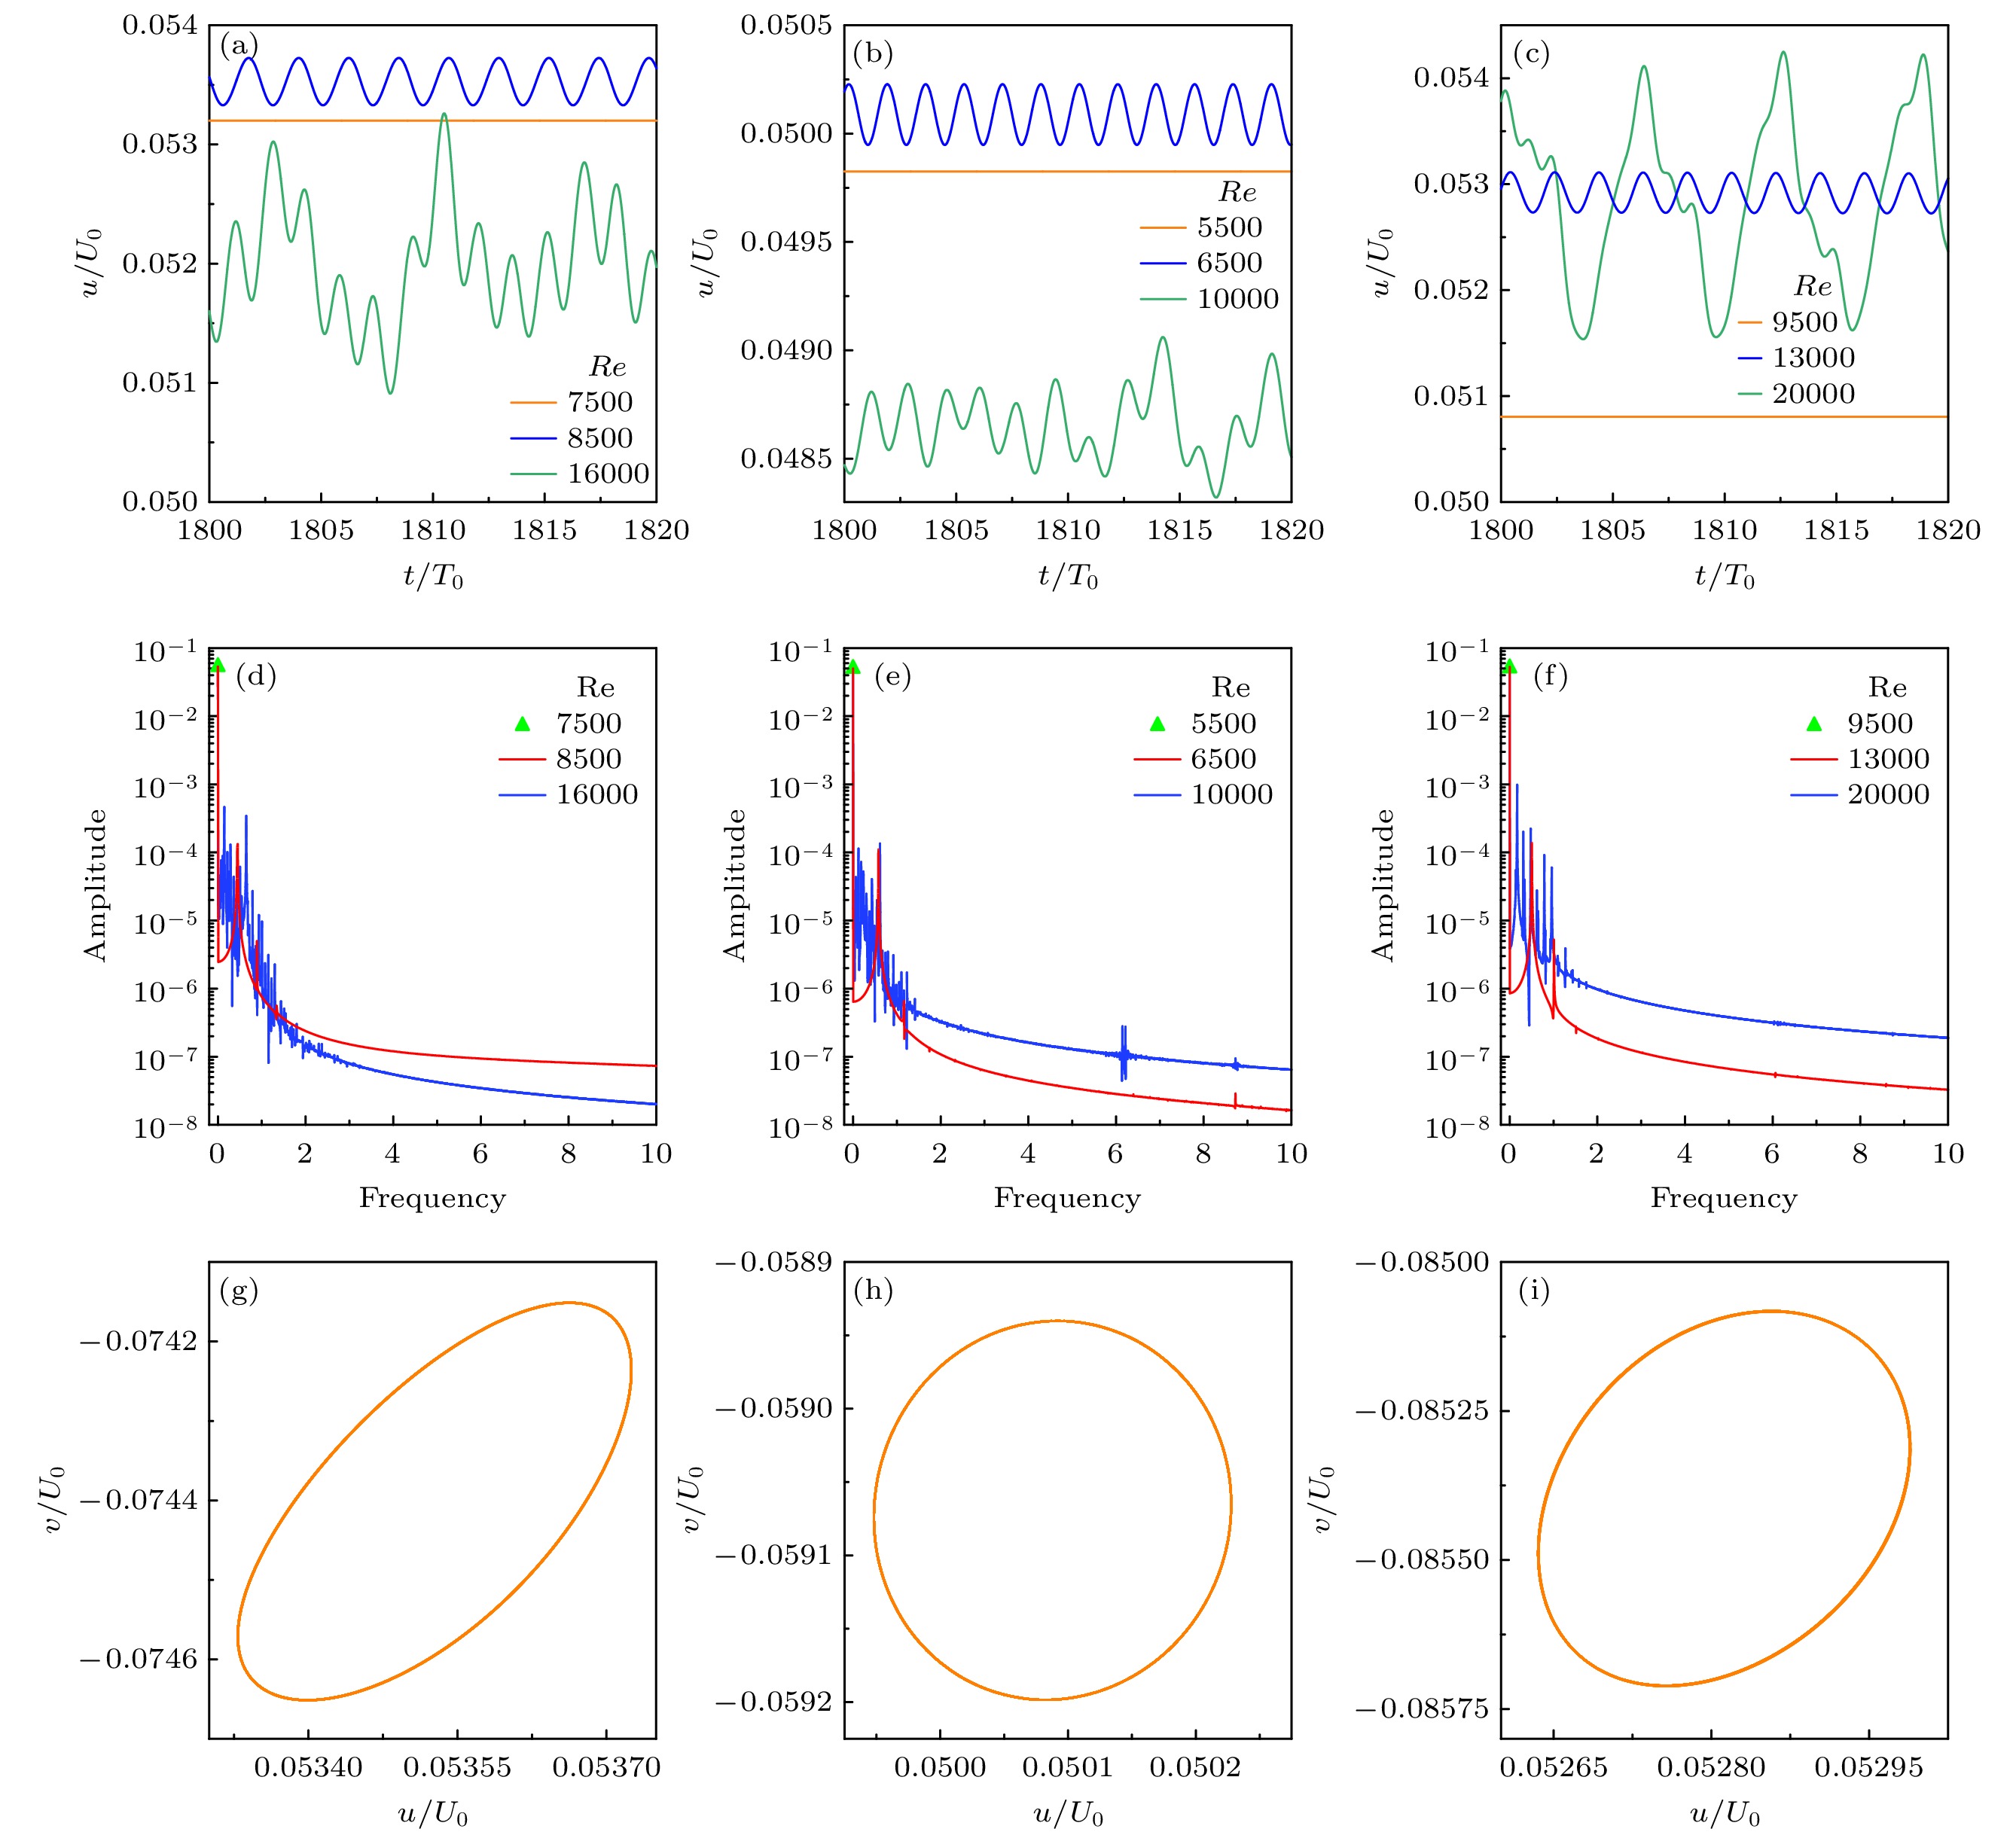 图 5 三类流体在速度监控点处的时频域特性 (a), (d) n = 1, Re = 7500, 8500, 16000; (g) n = 1, Re = 8500; (b), (e) n = 0.75, Re = 5500, 6500, 10000; (h) n = 0.75, Re = 6500; (c), (f) n = 1.25, Re = 9500, 13000, 20000; (i) n = 1.25, Re = 13000
Figure5. Time-frequency spectrum characteristics at the velocity monitoring point for three types of fluids: (a), (d) n = 1, Re = 7500, 8500, 16000; (g) n = 1, Re = 8500; (b), (e) n = 0.75, Re = 5500, 6500, 10000; (h) n = 0.75, Re = 6500; (c), (f) n = 1.25, Re = 9500, 13000, 20000; (i) n = 1.25, Re = 13000.
图6为监控点处牛顿流体、剪切变稀与剪切增稠流体在不同雷诺数情况下的速度相图, 各封闭曲线中心点用虚线进行连接. 图6(a)为牛顿流体在不同雷诺数下的速度相图, 其中Re = 7500, 8000时, 速度波动极小, 在相图上呈现的是1个点, 而在Re = 8500—9500时, 相图为光滑封闭曲线, 曲线整体向右上方移动且包围的面积在不断增加. 图6(b)为剪切变稀流体在不同雷诺数下的速度相图, 在Re = 5500时, 速度相图为1个点, 而Re = 5700—6000时, 速度相图为封闭曲线, 随着Re增加向上方移动, 且包围的面积在不断增加. 图6(c)为剪切增稠流体在不同雷诺数下的速度相图, 其中Re = 11500, 12000, 12500时, 速度相图为单一点, 而Re = 13000—15000时, 速度相图为光滑封闭曲线. 速度相图整体变化趋势为先向右再向左上方移动, 向右移动的过程中, 竖直方向上速度v几乎没有变化, 而向左上方移动的过程中, 封闭曲线包围的面积逐渐增大, 有较为明显的变化规律.
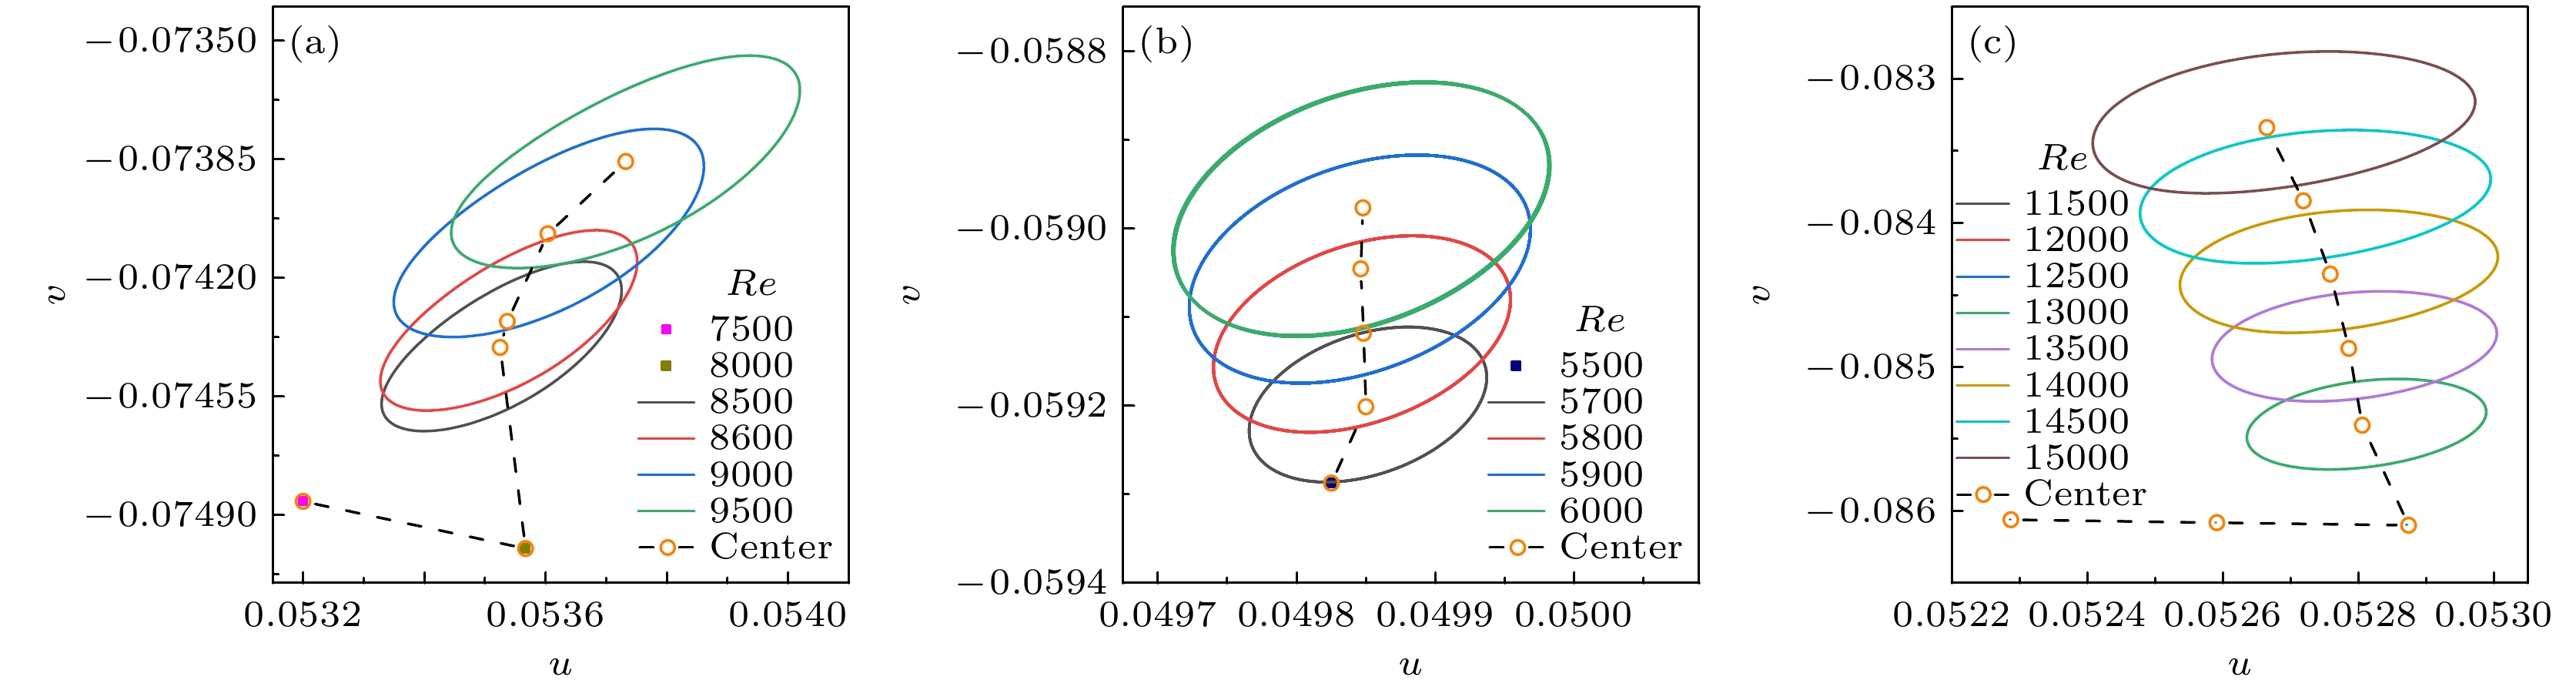 图 6 在监控点处的速度相图 (a) 牛顿流体; (b) 剪切变稀流体; (c) 剪切增稠流体
Figure6. Velocity phase diagrams at the monitoring point: (a) Newtonian fluid; (b) shear-thinning fluid; (c) shear-thickening fluid.
2
3.4.流场模态分析
进一步使用POD对牛顿流体、剪切变稀和剪切增稠流体的流场速度、涡量和黏性进行处理, 结果如图7和图8所示. 图7(a)—(c)分别为牛顿流体、剪切变稀流体和剪切增稠流体的水平速度POD能量占比图. 从图7可以发现, 不同类型的流体在第一临界转捩雷诺数附近且发生转捩后, 均呈现前两阶模态能量占主导地位的特点, 能量占比超95%, 且前两阶模态能量占比接近. 在图7(a) Re = 10500时, 出现了多模态的结果, 这里的流场可能是进入Hopf第二分岔第二模式中[5]. 在图7(c) Re = 11500, 12500时, 一阶模态能量占比大幅度高于二阶模态的能量占比, 但结合图6(c)可以发现, 此时流场速度波动量较小几乎为定常流场, 一阶模态与二阶模态相对于平均流场几乎可以忽略.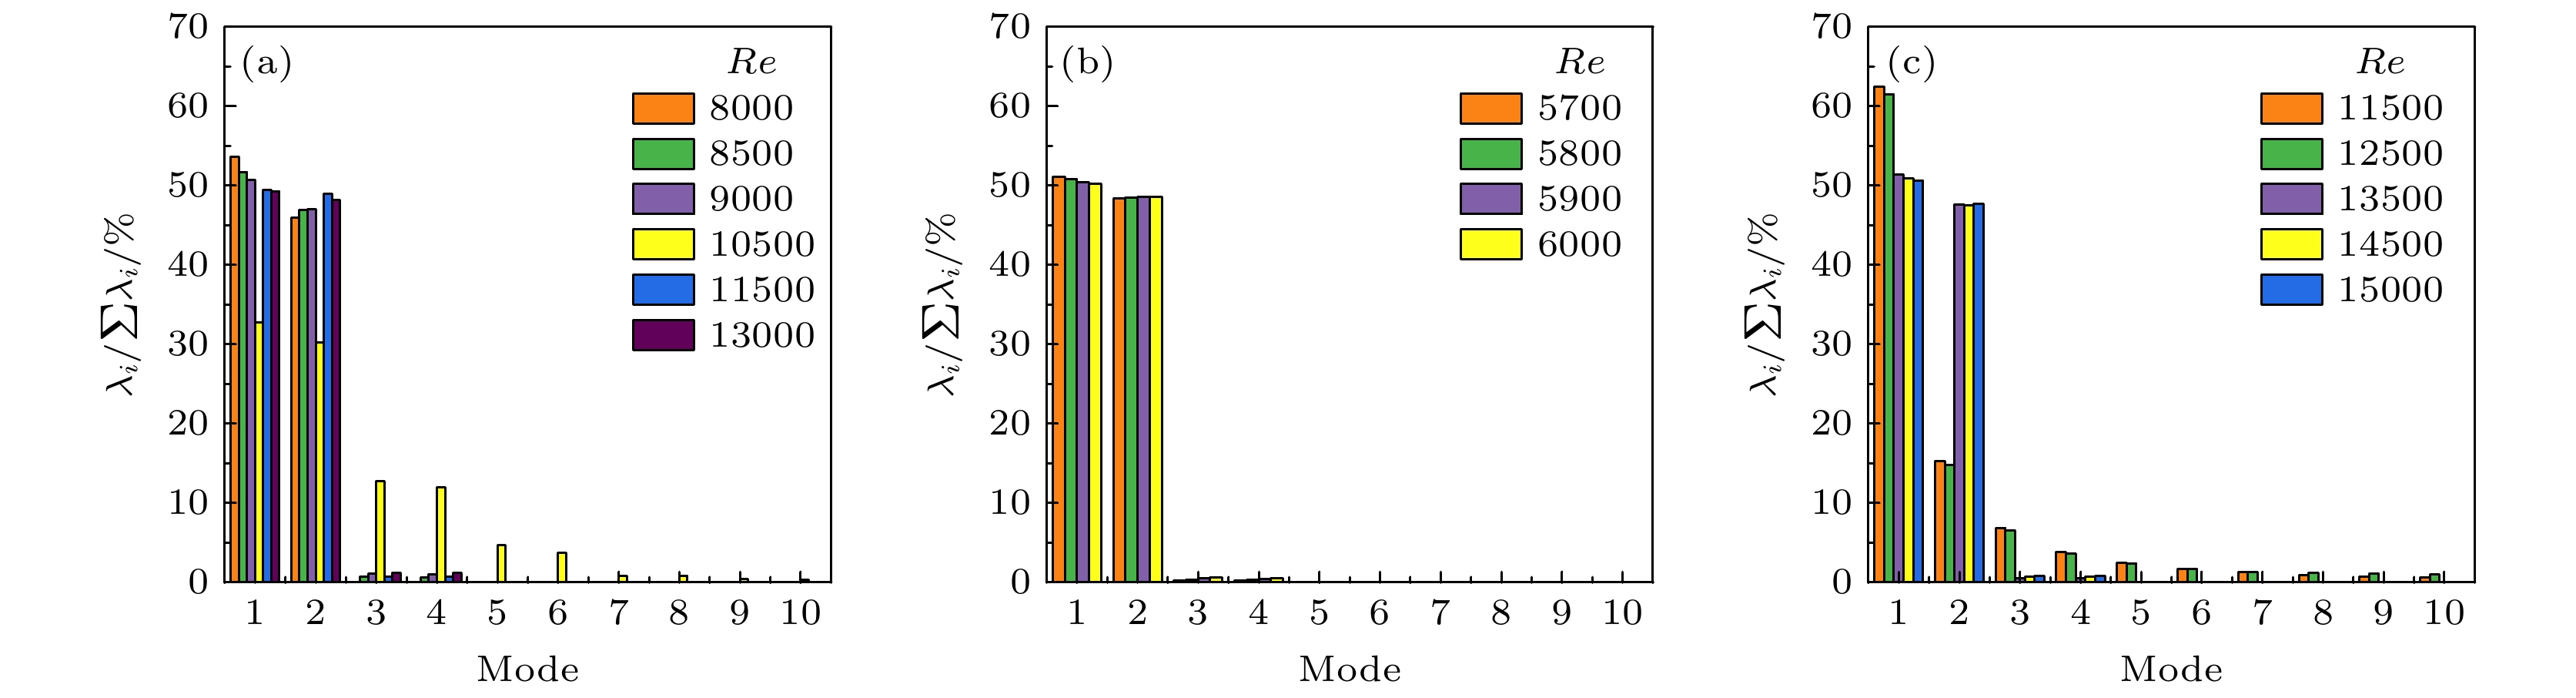 图 7 速度u的各阶模态的能量占比 (a) 牛顿流体; (b) 剪切变稀流体; (c) 剪切增稠流体
Figure7. Energy share of each order of mode for velocity u: (a) Newtonian fluid; (b) shear thinning-fluid; (c) shear-thickening fluid.
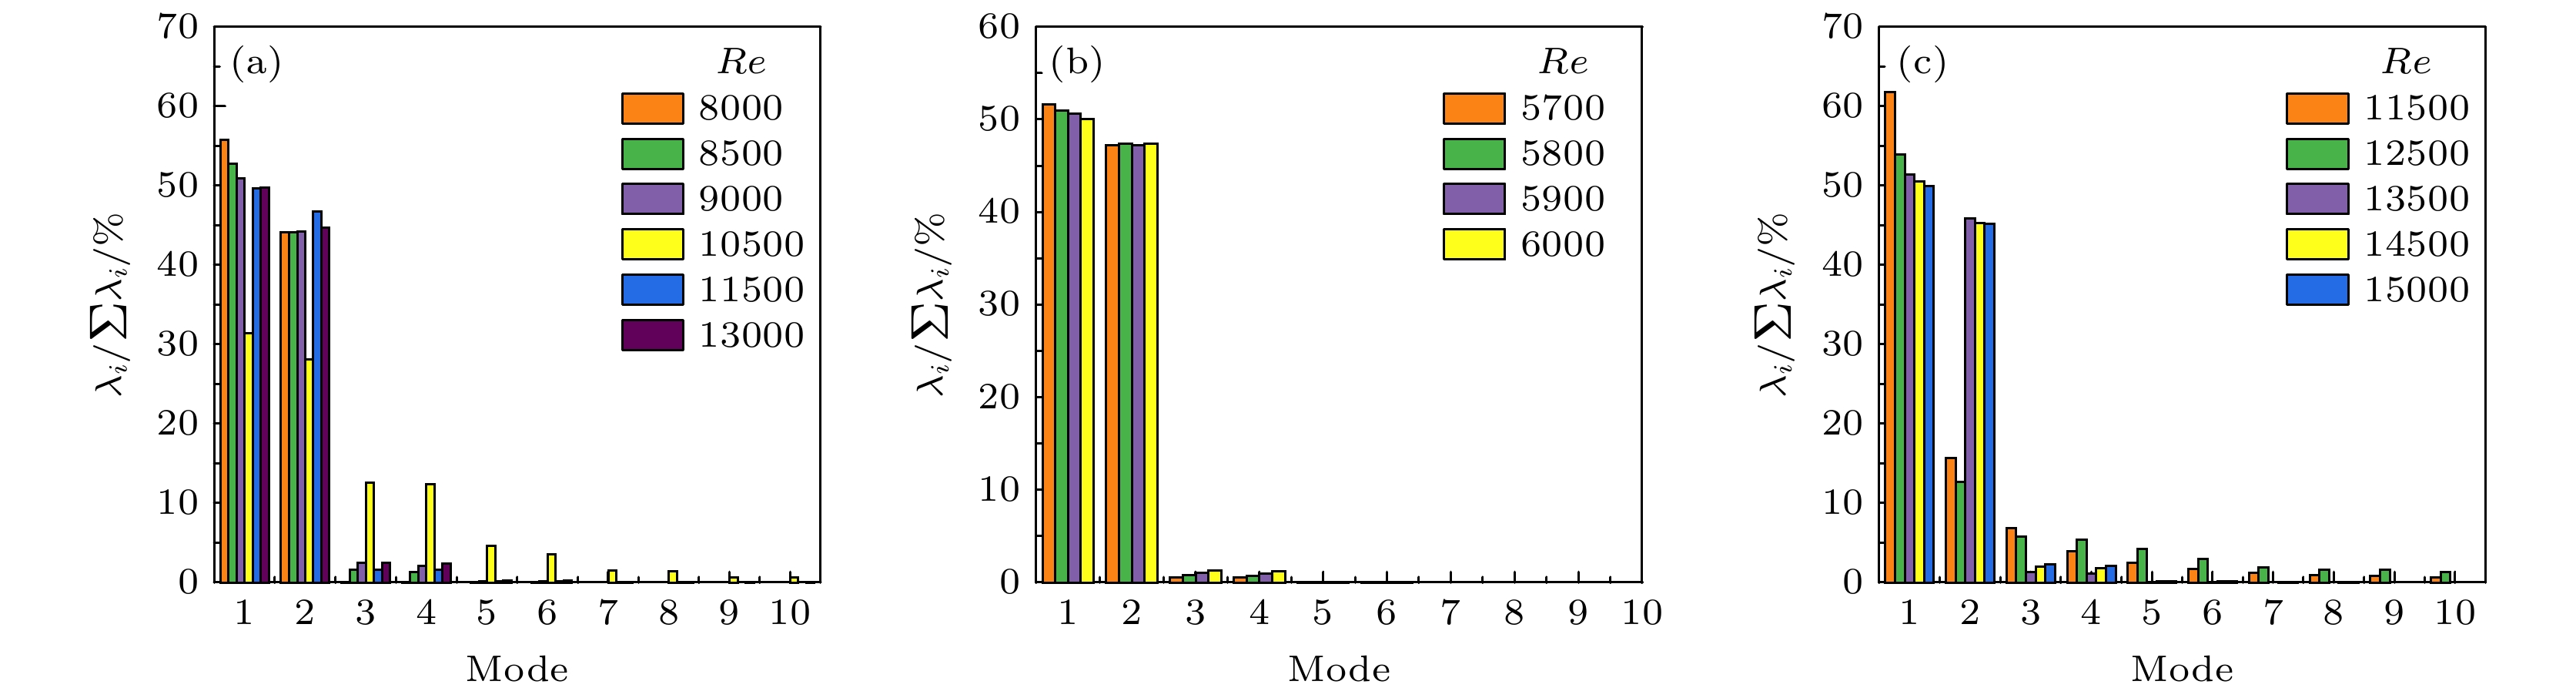 图 8 涡量的各阶模态的能量占比 (a) 牛顿流体; (b) 剪切变稀流体; (c) 剪切增稠流体
Figure8. Vortex energy share of each order of mode: (a) Newtonian fluid; (b) shear-thinning fluid; (c) shear-thickening fluid.
图8(a)—(c)分别为牛顿流体、剪切变稀流体和剪切增稠流体的涡量POD能量占比图. 涡量POD能量占比与水平速度POD能量占比结果相比, 同种流体在同一雷诺数下, 涡量POD一阶模态的占比略高于水平速度POD能量占比, 涡量POD中前两阶模仍占主导地位.
图9为牛顿流体在不同雷诺数下各阶模态的流场模态的速度场云图, 图9(a)和图9(d)分别为Re = 8500与Re = 9000时平均水平速度场云图, 图9(b)和图9(e) 分别为Re = 8500与Re = 9000时水平速度一阶模态云图, 图9(c)和图9(f) 分别为Re = 8500与Re = 9000时水平速度二阶模态云图. 从速度平均场来看, Re = 8500与Re = 9000的结果相近; 从一阶模态的云图来看, 峰值区域均靠近壁面, 且峰值区域的形状相似; 从二阶模态的云图来看, 二阶模态的结果相近, 且峰值主要分布在壁面处.
 图 9 牛顿流体的水平速度的各阶模态图 (a), (b), (c) Re = 8500时, 平均场、一阶模态与二阶模态; (d), (e), (f) Re = 9000时, 平均场、一阶模态与二阶模态
Figure9. Modal diagrams of horizontal velocity of Newtonian fluid: (a), (b) and (c) The mean field, the first and second modes when Re = 8500; (d), (e), (f) mean field, first-order mode and second-order mode when Re = 9000
图10为剪切变稀流体在不同Re下各阶模态的流场模态的速度场云图, 图10(a)和图10(d)分别为Re = 5700与Re = 6000时平均速度场云图, 图10(b)和图10(e)分别为Re = 5700与Re = 6000时速度一阶模态云图, 图10(c)和图10(f)分别为Re = 5700与Re = 6000时速度二阶模态云图. 从平均场的结果来看, Re = 5700与Re = 6000结果相近; 从一阶和二阶模态的结果来看, 模态峰值分布区域集中在壁面附近, 峰值分布区域的形状相似, 但峰值分布区的模态值相反.
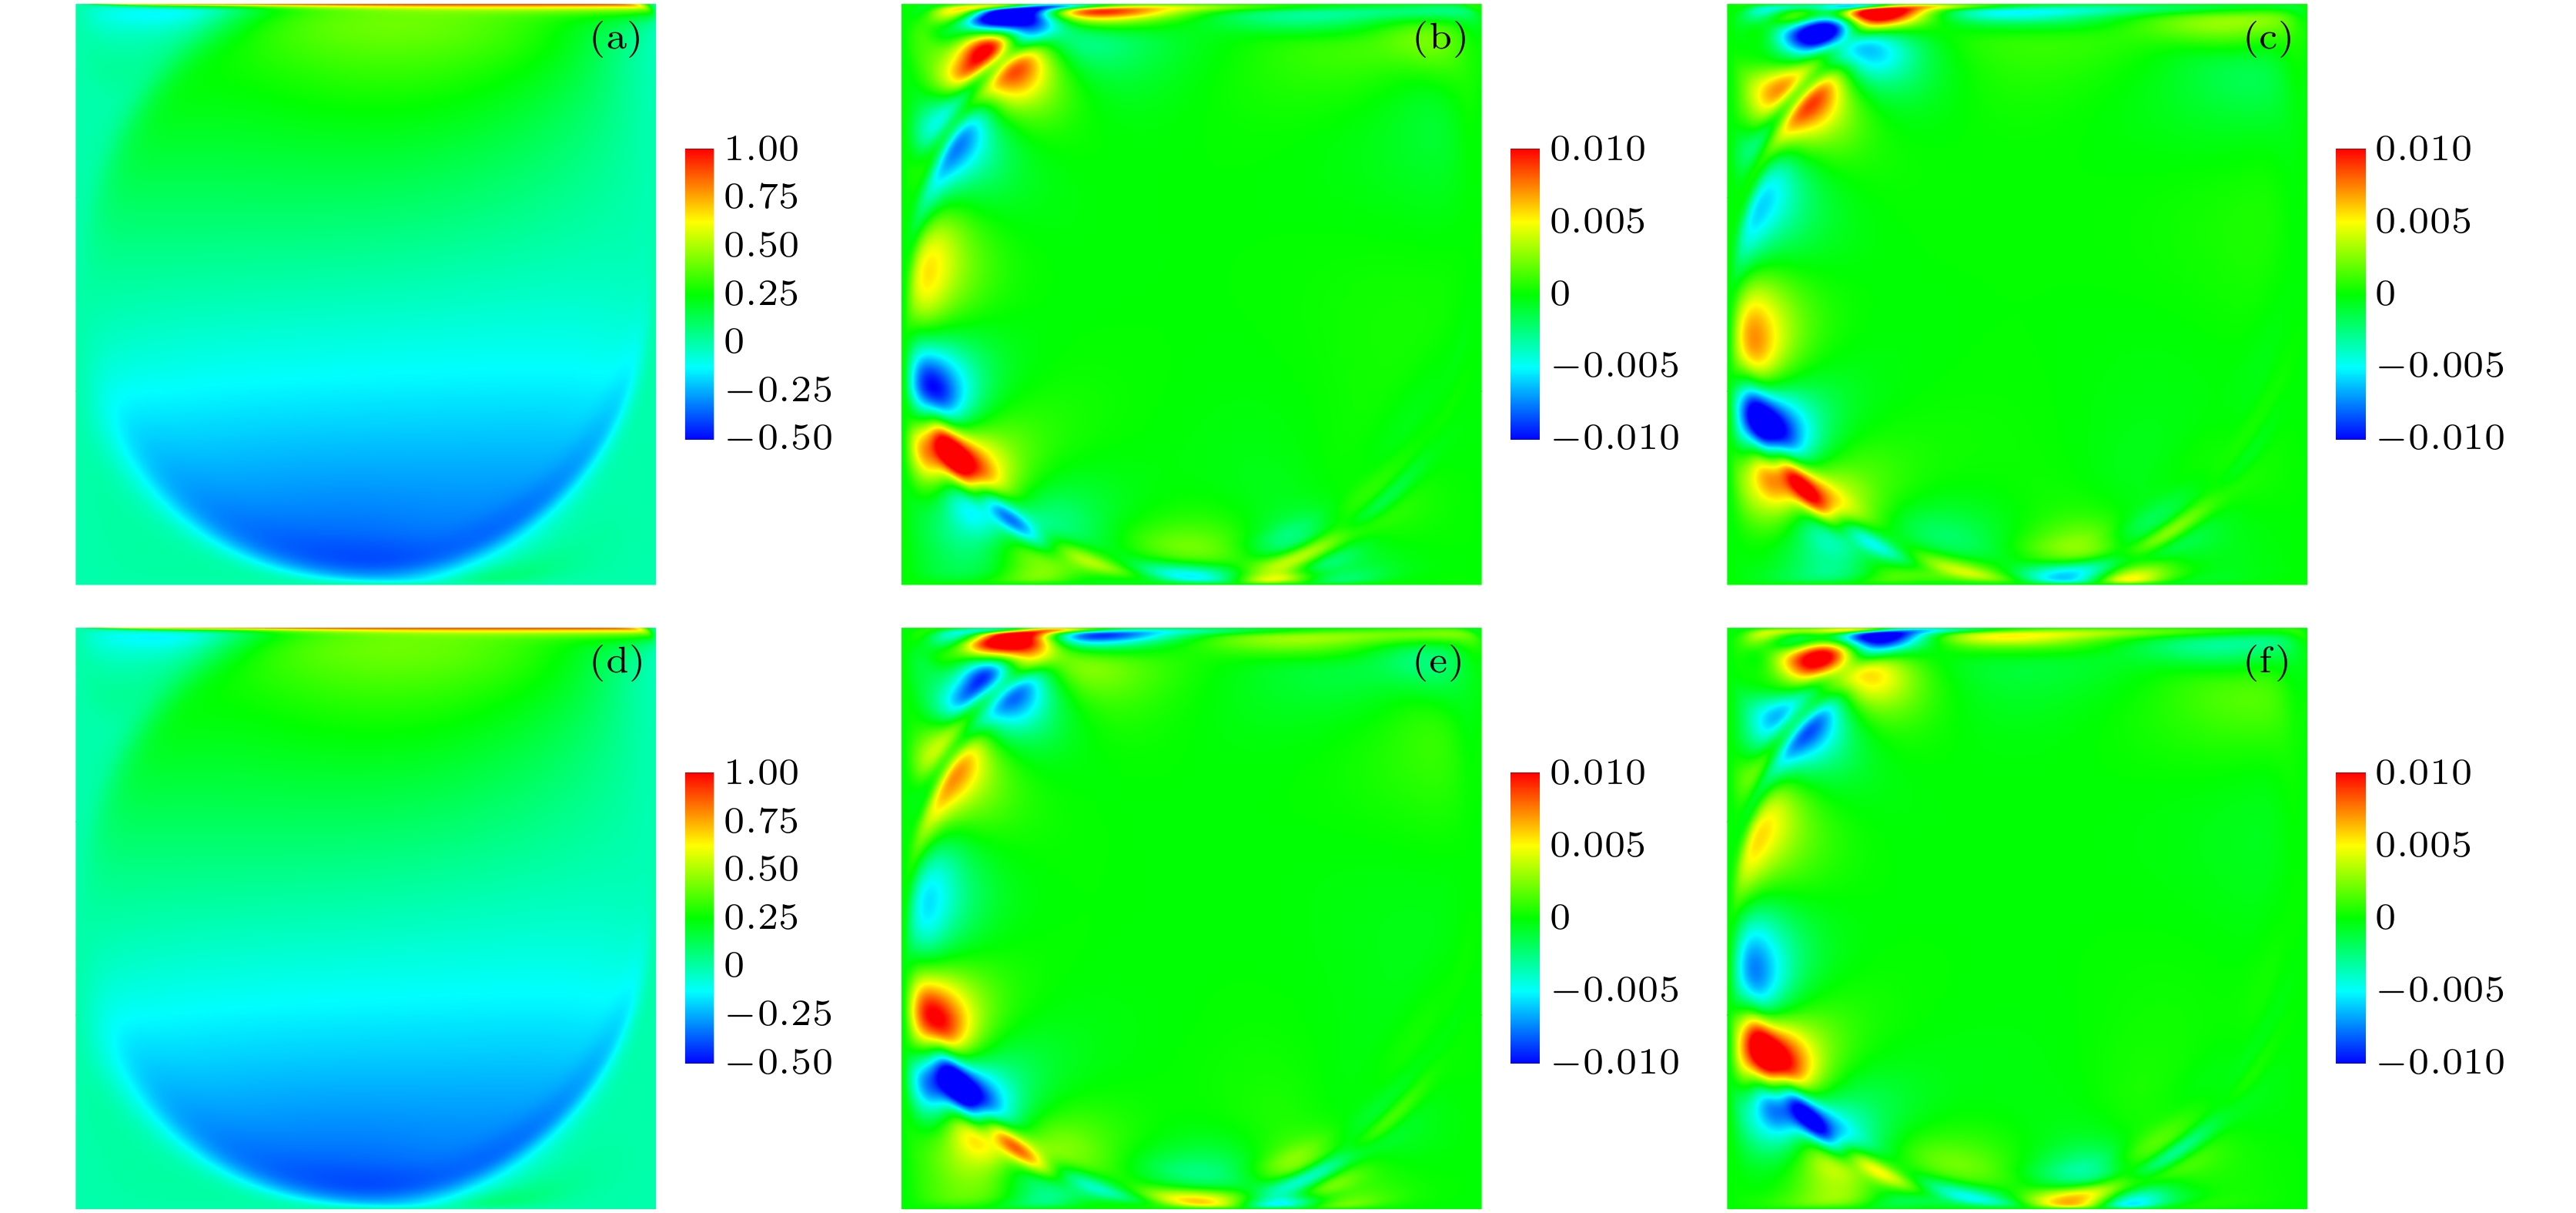 图 10 剪切变稀流体的水平速度的各阶模态图 (a), (b), (c) Re = 5700时, 平均场、一阶模态与二阶模态; (d), (e), (f) Re = 6000时, 平均场、一阶模态与二阶模态
Figure10. Modal diagrams of horizontal velocity of shear-thinning fluid: (a), (b), (c) The mean field, the first and second modes when Re = 5700; (d), (e), (f) mean field, first-order mode and second-order mode when Re = 6000.
图11为剪切增稠流体在不同Re下各阶模态的流场模态的速度场云图, 图11(a)和图11(d)分别为Re = 13000与Re = 13500时平均速度场云图, 图11(b)和图11(e)分别为Re = 13000与Re = 13500时速度一阶模态云图, 图11(c)和图11(f)分别为Re = 13000与Re = 13500时速度二阶模态云图. 从平均场的结果来看, Re = 13000与Re = 13500结果相近; 从一阶和二阶模态的结果来看, 峰值分布区域集中在壁面附近, 且峰值分布区域的形状相似, 这与牛顿流体和剪切变稀流体的结果是类似的. 剪切增稠流体一阶和二阶模态峰值分布区的模态值相反.
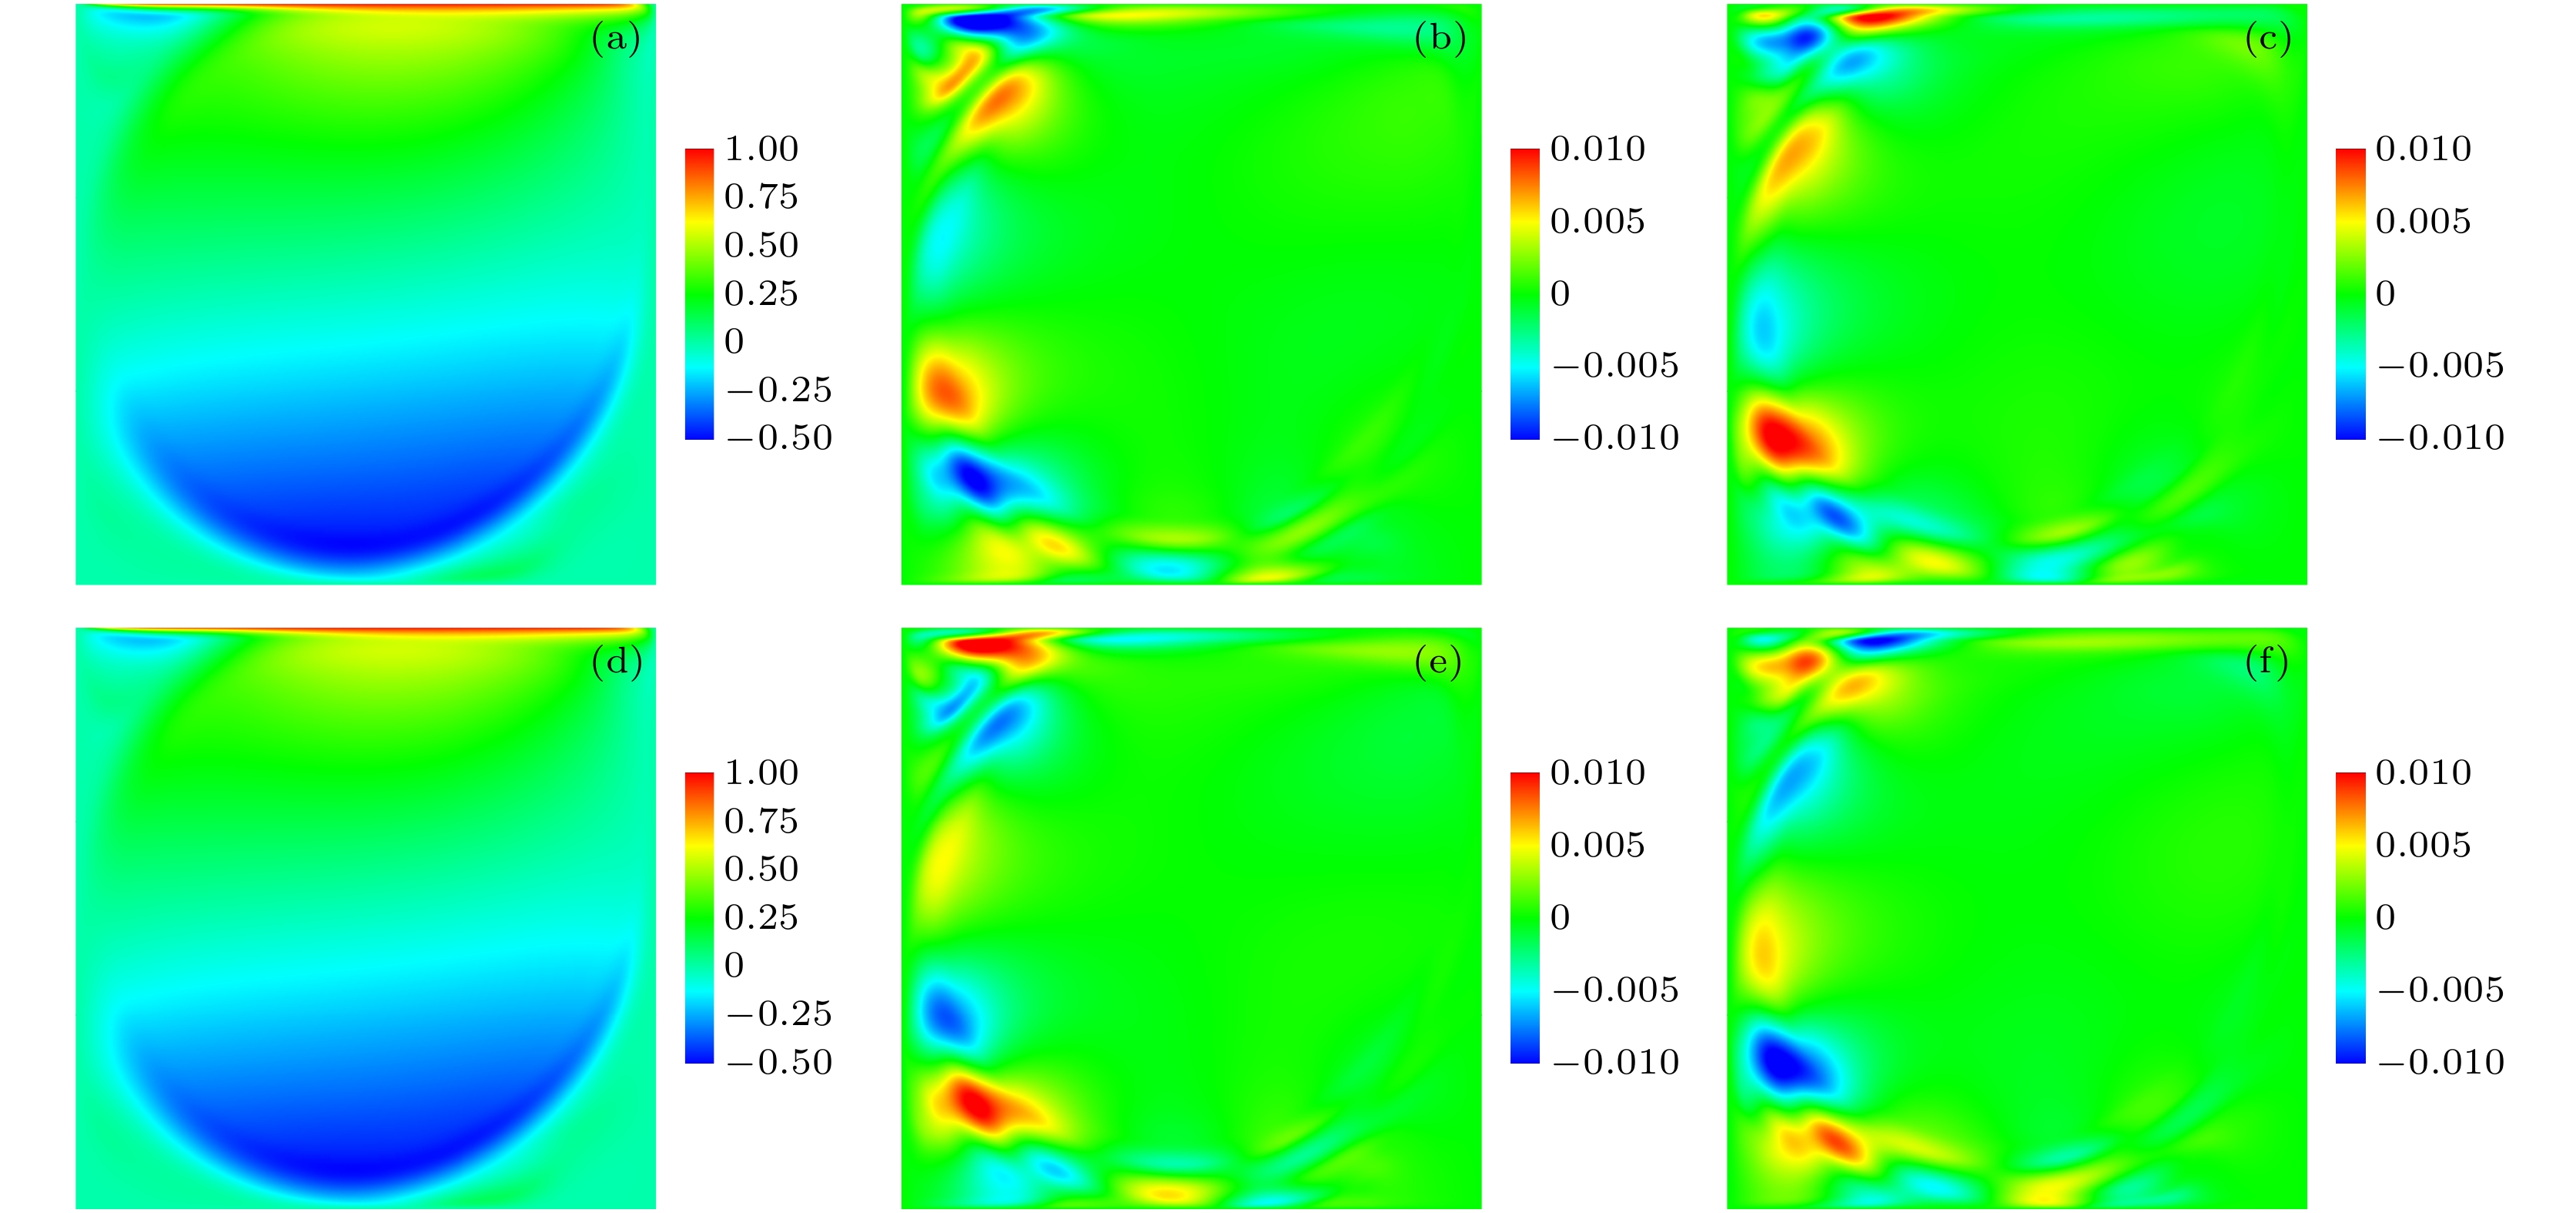 图 11 剪切增稠流体的水平速度的各阶模态图 (a), (b), (c) Re = 13000时, 平均场、一阶模态与二阶模态; (d), (e), (f) Re = 13500时, 平均场、一阶模态与二阶模态
Figure11. Modal diagrams of horizontal velocity of shear-thickening fluid: (a), (b), (c) The mean field, the first and second modes when Re = 13000; (d), (e), (f) mean field, first-order mode and second-order mode when Re = 13500.
