谢保鹏2,
张德罡1,,
1.甘肃农业大学草业学院 兰州 730070
2.甘肃农业大学管理学院 兰州 730070
基金项目: 国家重点研发计划项目2016YFC0501902
甘肃省教育厅高校科研项目2018A-038
详细信息
作者简介:杨洁, 主要从事草地生态系统服务研究。E-mail:405899577@qq.com
通讯作者:张德罡, 主要从事草原资源与生态、草地土壤研究。E-mail:zhangdg@gsau.edu.cn
中图分类号:F124.5;X24计量
文章访问数:103
HTML全文浏览量:22
PDF下载量:34
被引次数:0
出版历程
收稿日期:2020-09-14
录用日期:2020-12-07
网络出版日期:2021-06-22
刊出日期:2021-06-01
Spatio-temporal evolution of carbon stocks in the Yellow River Basin based on InVEST and CA-Markov models
YANG Jie1,,XIE Baopeng2,
ZHANG Degang1,,
1. College of Pratacultural Science, Gansu Agricultural University, Lanzhou 730070, China
2. College of Management, Gansu Agricultural University, Lanzhou 730070, China
Funds: the National Key R & D Program of China2016YFC0501902
the Scientific Research Projects of Gansu Provincial Department of Education2018A-038
More Information
Corresponding author:ZHANG Degang, E-mail:zhangdg@gsau.edu.cn
摘要
HTML全文
图
参考文献
相关文章
施引文献
资源附件
访问统计
摘要
摘要:区域土地利用/覆被变化是导致生态系统碳储量变化的主要原因,预测未来土地利用/覆盖变化及其对碳储量的影响对区域陆地生态系统的认识具有重要意义。本研究基于黄河流域2005—2018年土地利用/覆被变化规律,运用CA-Markov模型分别预测了生态保护情景(EVC)和自然变化情景(NVC)下的土地利用/覆被空间格局,采用修正后的碳密度,运用InVEST模型评估黄河流域2005—2030年6期碳储量。结果表明:2005—2018年黄河流域林地、水域和建设用地面积持续增加,耕地、草地和未利用土地面积减少,13 a间全流域碳储量减少28.734×10⁶t。与自然变化情景相比,在生态保护情景下2030年草地和耕地相比2018年减少幅度较小,建设用地规模扩大得到了限制,产生了生态效应。2030年,自然变化情景和生态保护情景下的碳储量较2018年分别减少258.863×10⁶t和30.813×10⁶t,生态保护情景下土地利用覆被格局固碳能力高于自然变化情景,该研究可为黄河流域土地利用结构调整和土地利用管理决策提供科学依据。
关键词:土地利用/覆被变化/
碳储量/
CA-Markov模型/
InVEST模型/
生态保护情景/
黄河流域
Abstract:The Yellow River Basin is an important carbon sink and carbon stock area of terrestrial ecosystems in China, and land use/cover change is the primary reason for variation in the carbon stocks. Therefore, accurately predicting future land use/cover changes and their impacts on regional carbon stocks is important for a better understanding of regional terrestrial ecosystems. This study aimed to explore the law of spatio-temporal changes in land use in the Yellow River Basin from 2005 to 2018 and to predict the characteristics of carbon stock changes under two scenarios of ecological protection and natural change in 2030. The CA-Markov model was used to predict the land use/cover spatial pattern in two scenarios:the ecological conservation scenario and the natural change scenario, based on its law in the Yellow River Basin from 2005 to 2018. The InVEST model was used to estimate the carbon stock in six phases of the Yellow River Basin from 2005 to 2030 based on the revised carbon density. The results highlighted land use change and transition among land use types. From 2005 to 2018, the areas of forest, water, and built-up land in the Yellow River Basin continued to increase, but the areas of cropland, grassland, and unused land decreased. The main transfer characteristics of land use types were from cropland to built-up land and grassland, and from cropland and grassland to forest. During the 13 years, the carbon stock of the whole basin decreased by 28.734×10⁶t. The simulation results of land use changes under two scenarios with the CA-Markov model showed that compared with the natural change scenario, the ecological protection scenario led to reductions in grassland and cropland in 2030, which was less than that in 2018. The expansion of built-up land was restricted under the ecological scenario, and the scale of expansion was substantially reduced, both of which facilitated the generation of ecological effects in the Yellow River Basin. Furthermore, in 2030, the carbon stocks under the natural change scenario and the ecological protection scenario were reduced by 258.863×10⁶t and 30.813×10⁶t, respectively, compared with 2018. This study provides a scientific basis for adjusting the land use structure and land use management decision-making, improving the regional carbon stock capacity, and promoting ecological civilization construction in the Yellow River Basin.
Key words:Land use/over change/
Carbon stock/
CA-Markov model/
InVEST model/
Ecological protection scenario/
Yellow River Basin
HTML全文
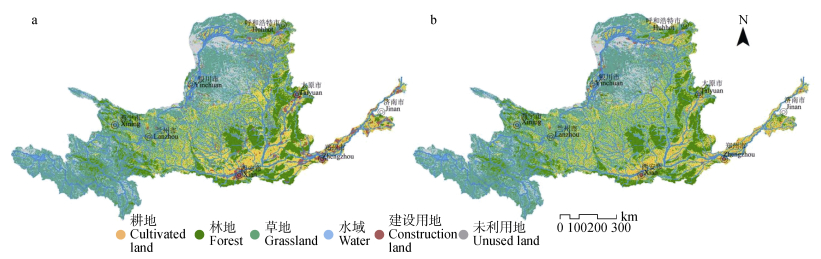
图12030年自然变化情景(a)与生态保护情景(b)下黄河流域土地利用格局图
Figure1.Land use patterns under natural variation scenario (a) and ecological protection scenario (b) in the Yellow River basin in 2030
 下载: 全尺寸图片幻灯片
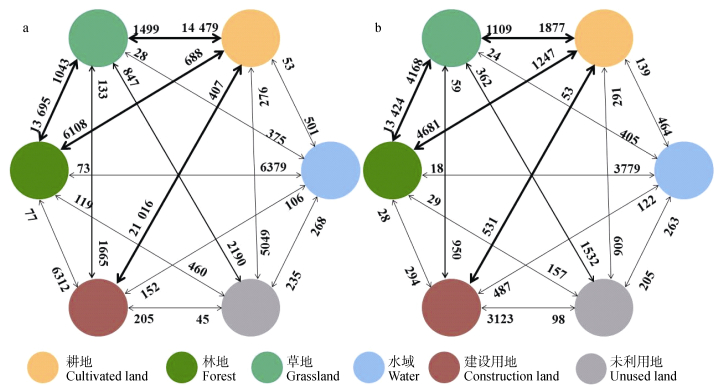
图22018—2030年自然变化情景(a)和生态保护情景(b)下土地利用类型转移矩阵(km2)
Figure2.Transfer matrixes of land use types under natural change scenarios (a) and ecological protection scenarios (b) in the Yellow River Basin from 2018 to 2030 (km2)
下载: 全尺寸图片幻灯片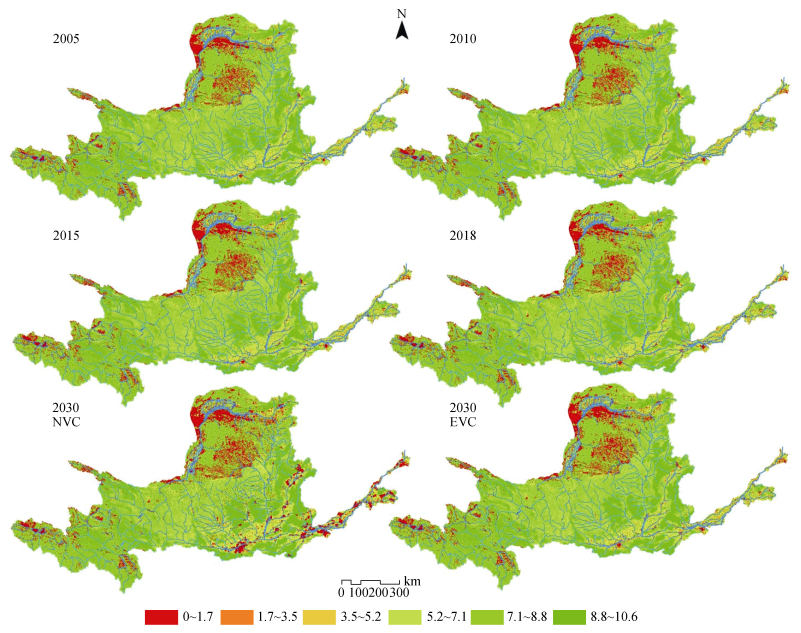
图32005年、2010年、2015年、2018年及自然变化情景(NVC)和生态保护情景(EVC)下2030年黄河流域碳储量空间格局分布图(103 t?hm?2)
Figure3.Spatial distribution of carbon stock in 2005, 2010, 2015 and 2018, and in 2030 under natural change scenario (NVC) and ecological protection scenario (EVC) in the Yellow River Basin (103 t?hm?2)
下载: 全尺寸图片幻灯片表1不同土地利用类型各部分的碳密度
Table1.Carbon densities of various parts of different land use types ?
| 土地利用类型 Land use type | 地上碳密度 Above-ground carbon density | 地下碳密度 Underground carbon density | 土壤碳密度 Soil carbon density | 死亡有机物碳密度 Dead organic matter carbon density |
| 耕地Cultivated land | 17.0 | 80.7 | 108.4 | 9.82 |
| 林地Forest | 42.4 | 115.9 | 158.8 | 14.11 |
| 草地Grassland | 35.3 | 86.5 | 99.9 | 7.28 |
| 水域Water | 0.3 | 0 | 0 | 0 |
| 建设用地Construction land | 2.5 | 27.5 | 0 | 0 |
| 未利用地Unused land | 1.3 | 0 | 21.6 | 0 |
下载: 导出CSV表2年降水量和年均温修订的黄河流域不同土地利用类型的碳密度值
Table2.Carbon density values of different land use types in the Yellow River Basin revised by annual precipitation and annualmean temperature ?
| 土地利用类型 Land use type | 地上碳密度 Above-ground carbon density | 地下碳密度 Underground carbon density | 土壤碳密度 Soil carbon density | 死亡有机物碳密度 Dead organic matter carbon density |
| 耕地Cultivated land | 4.94 | 23.45 | 31.49 | 2.84 |
| 林地Forest | 12.32 | 33.67 | 46.14 | 4.09 |
| 草地Grassland | 10.26 | 25.13 | 29.03 | 2.19 |
| 水域Water | 0.09 | 0 | 0 | 0 |
| 建设用地Construction land | 0.73 | 7.99 | 0 | 0 |
| 未利用地Unused land | 0.38 | 0 | 6.28 | 0 |
下载: 导出CSV表32005—2018年黄河流域各期不同土地利用类型的面积及比例
Table3.Areas and proportions of different land use types in each period from 2005 to 2018 in the Yellow Research Basin
| 土地利用类型 Land use type | 2005 | 2010 | 2015 | 2018 | 面积 变化值 Area change (km2) | |||||||
| 面积 Area (km2) | 比例 Proportion (%) | 面积 Area (km2) | 比例 Proportion (%) | 面积 Area (km2) | 比例 Proportion (%) | 面积 Area (km2) | 比例 Proportion (%) | |||||
| 耕地Cultivated land | 218 450 | 27.05 | 214 722 | 26.59 | 214 084 | 26.513 | 212 474 | 26.31 | –5976 | |||
| 林地Forest | 103 505 | 12.82 | 105 788 | 13.10 | 106 089 | 13.138 | 106 185 | 13.15 | 2680 | |||
| 草地Grassland | 380 888 | 47.17 | 378 779 | 46.91 | 379 067 | 46.945 | 378 047 | 46.82 | –2841 | |||
| 水域Water | 13 615 | 1.69 | 13 941 | 1.73 | 14 005 | 1.734 | 14 308 | 1.77 | 693 | |||
| 建设用地Construction land | 18 626 | 2.31 | 20 005 | 2.48 | 20 670 | 2.560 | 24 375 | 3.02 | 5749 | |||
| 未利用地Unused land | 72 383 | 8.96 | 74 231 | 9.19 | 73 552 | 9.109 | 72 078 | 8.93 | –305 | |||
下载: 导出CSV表42030年自然变化情景(NVC)和生态保护情景(EVC)下不同地类的面积及其与2018年相比的变化
Table4.Areas of different land use types under natural change scenario (NVC) and ecological protection scenario (EVC) in 2030 and their change from 2018 to 2030
| 土地利用 Land use type | 2018 | 2030 | 2018—2030年变化 Change from 2018 to 2030 | |||||||||||
| NVC | EVC | NVC | EVC | |||||||||||
| 面积 Area (km2) | 比例 Proportion (%) | 面积 Area (km2) | 比例 Proportion (%) | 面积 Area (km2) | 比例 Proportion (%) | 面积 Area (km2) | 变化率 Rate (%) | 面积 Area (km2) | 变化率 Rate (%) | |||||
| 耕地Cultivated land | 212 474 | 26.31 | 193 992 | 24.02 | 208 306 | 25.80 | –18 482 | –8.70 | –4168 | –1.96 | ||||
| 林地Forest | 106 185 | 13.15 | 111 081 | 13.76 | 114 426 | 14.17 | 4896 | 4.61 | 8241 | 7.76 | ||||
| 草地Grassland | 378 047 | 46.82 | 349 353 | 43.27 | 364 587 | 45.15 | –28 694 | –7.59 | –13 460 | –3.56 | ||||
| 水域Water | 14 308 | 1.77 | 21 429 | 2.65 | 18 520 | 2.29 | 7121 | 49.77 | 4212 | 29.44 | ||||
| 建设用地Construction land | 24 375 | 3.02 | 53 079 | 6.57 | 30 046 | 3.72 | 28 704 | 117.76 | 5671 | 23.27 | ||||
| 未利用地Unused land | 72 078 | 8.93 | 78 533 | 9.73 | 71 582 | 8.87 | 6455 | 8.96 | –496 | –0.69 | ||||
下载: 导出CSV表52018—2030年自然变化情景(NVC)和生态保护情景(EVC)下土地利用类型转换引起的碳储量变化
Table5.Change of carbon stock caused by land use type conversion under natural change scenario (NVC) and ecological protection scenario (EVC) from 2018 to 2030
| 土地利用类型转移 Land use type conversion | 面积 Area (km2) | 碳储量变化 Change in carbon stock (×106 t) | 合计 Total (×106 t) | |||||||
| 转出Converted from | 转为Converted to | NVC | EVC | NVC | EVC | NVC | EVC | |||
| 耕地Cultivated land | 林地Forest | 6108 | 4681 | 22.32 | 17.10 | –140.85 | 5.13 | |||
| 草地Grassland | 1499 | 1109 | 0.30 | 0.22 | ||||||
| 水域Water | 501 | 464 | –3.49 | –3.23 | ||||||
| 建设用地Construction Land | 21 016 | 531 | –128.16 | –3.24 | ||||||
| 未利用地Unused land | 5049 | 909 | –31.83 | –5.73 | ||||||
| 林地Forest | 耕地Cultivated land | 688 | 1247 | –2.51 | –4.56 | –148.59 | –70.45 | |||
| 草地Grassland | 1043 | 4168 | –3.60 | –14.40 | ||||||
| 水域Water | 6379 | 3779 | –67.71 | –40.11 | ||||||
| 建设用地Construction land | 6312 | 294 | –61.55 | –2.87 | ||||||
| 未利用地Unused land | 460 | 157 | –4.58 | –1.56 | ||||||
| 草地Grassland | 耕地Cultivated land | 14 479 | 1877 | –2.90 | –0.38 | 16.99 | 27.14 | |||
| 林地Forest | 13 695 | 13 424 | 47.30 | 46.37 | ||||||
| 水域Water | 375 | 405 | –2.69 | –2.90 | ||||||
| 建设用地Construction land | 1665 | 950 | –10.49 | –5.98 | ||||||
| 未利用地Unused land | 2190 | 1532 | –14.24 | –9.96 | ||||||
| 水域Water | 耕地Cultivated land | 53 | 139 | 0.37 | 0.97 | 1.63 | 1.89 | |||
| 林地Forest | 73 | 18 | 0.77 | 0.19 | ||||||
| 草地Grassland | 28 | 24 | 0.20 | 0.17 | ||||||
| 建设用地Construction land | 152 | 487 | 0.13 | 0.42 | ||||||
| 未利用地Unused land | 235 | 205 | 0.15 | 0.13 | ||||||
| 建设用地Construction land | 耕地Cultivated land | 407 | 53 | 2.48 | 0.32 | 3.97 | 0.84 | |||
| 林地Forest | 77 | 28 | 0.75 | 0.27 | ||||||
| 草地Grassland | 133 | 59 | 0.84 | 0.37 | ||||||
| 水域Water | 106 | 122 | –0.09 | –0.11 | ||||||
| 未利用地Unused land | 45 | 98 | –0.01 | –0.02 | ||||||
| 未利用地Unused land | 耕地Cultivated land | 276 | 291 | 1.74 | 1.83 | 8.3 | 4.95 | |||
| 林地Forest | 119 | 29 | 1.19 | 0.29 | ||||||
| 草地Grassland | 847 | 362 | 5.51 | 2.35 | ||||||
| 水域Water | 268 | 263 | –0.18 | –0.17 | ||||||
| 建设用地Construction land | 205 | 3123 | 0.04 | 0.64 | ||||||
| 总计Total | –258.86 | –30.81 | ||||||||
下载: 导出CSV参考文献
| [1] | HOUGHTON R A. Revised estimates of the annual net flux of carbon to the atmosphere from changes in land use and land management 1850-2000[J]. Tellus, 2003, 55(2):378-390 doi: 10.3402/tellusb.v55i2.16764 |
| [2] | SOLOMON S. Climate change the physical science basis[J]. American Geophysical Union, 2007, 9(1):123-124 http://www.mendeley.com/research/ipcc-2007-summary-policymakers/ |
| [3] | NEWBOLD T, HUDSON L N, HILL S L L, et al. Global effects of land use on local terrestrial biodiversity[J]. Nature, 2015, 520(7545):45-50 doi: 10.1038/nature14324 |
| [4] | 孔君洽, 杜泽玉, 杨荣, 等.黑河中游土地利用/覆被变化及其对碳储量影响的预测[J].中国沙漠, 2019, 39(3):87-97 https://www.cnki.com.cn/Article/CJFDTOTAL-ZGSS201903011.htm KONG J Q, DU Z Y, YANG R, et al. Prediction of land use change and its influence on carbon stocks in the middle reaches of Heihe River[J]. Journal of Desert Research, 2019, 39(3):87-97 https://www.cnki.com.cn/Article/CJFDTOTAL-ZGSS201903011.htm |
| [5] | 刘晓娟, 黎夏, 梁迅, 等.基于FLUS-InVEST模型的中国未来土地利用变化及其对碳储量影响的模拟[J].热带地理, 2019, 39(3):397-409 https://www.cnki.com.cn/Article/CJFDTOTAL-RDDD201903009.htm LIU X J, LI X, LIANG X, et al. Simulating the change of terrestrial carbon storage in China based on the FLUS-InVEST model[J]. Tropical Geography, 2019, 39(3):397-409 https://www.cnki.com.cn/Article/CJFDTOTAL-RDDD201903009.htm |
| [6] | 朱文博, 张静静, 崔耀平, 等.基于土地利用变化情景的生态系统碳储量评估——以太行山淇河流域为例[J].地理学报, 2019, 74(3):446-459 https://www.cnki.com.cn/Article/CJFDTOTAL-DLXB201903005.htm ZHU W B, ZHANG J J, CUI Y P, et al. Assessment of territorial ecosystem carbon storage based on land use change scenario:A case study in Qihe River Basin[J]. Acta Geographica Sinica, 2019, 74(3):446-459 https://www.cnki.com.cn/Article/CJFDTOTAL-DLXB201903005.htm |
| [7] | ABURAS M M, HO Y M, RAMLI M F, et al. Improving the capability of an integrated CA-Markov model to simulate spatio-temporal urban growth trends using an analytical hierarchy process and frequency ratio[J]. International Journal of Applied Earth Observation and Geoinformation, 2017, 59:65-78 doi: 10.1016/j.jag.2017.03.006 |
| [8] | ETEMADI H, SMOAK J M, KARAMI J. Land use change assessment in coastal mangrove forests of Iran utilizing satellite imagery and CA-Markov algorithms to monitor and predict future change[J]. Environmental Earth Sciences, 2018, 77(5):208 doi: 10.1007/s12665-018-7392-8 |
| [9] | FIROZJAEI M K, SEDIGHI A, ARGANY M, et al. A geographical direction-based approach for capturing the local variation of urban expansion in the application of CA-Markov model[J]. Cities, 2019, 93:120-135 doi: 10.1016/j.cities.2019.05.001 |
| [10] | RIMAL B, KESHTKAR H, SHARMA R, et al. Simulating urban expansion in a rapidly changing landscape in eastern Tarai, Nepal[J]. Environmental Monitoring and Assessment, 2019, 191(4):255 doi: 10.1007/s10661-019-7389-0 |
| [11] | NELSON E, MENDOZA G, REGETZ J, et al. Modeling multiple ecosystem services, biodiversity conservation, commodity production, and tradeoffs at landscape scales[J]. Frontiers in Ecology and the Environment, 2009, 7(1):4-11 doi: 10.1890/080023 |
| [12] | 王光谦, 王思远, 陈志祥.黄河流域的土地利用和土地覆盖变化[J].清华大学学报:自然科学版, 2004, 44(9):1218-1222 doi: 10.3321/j.issn:1000-0054.2004.09.018 WANG G Q, WANG S Y, CHEN Z X. Land-use/land-cover changes in the Yellow River basin[J]. Journal of Tsinghua University:Science & Technology, 2004, 44(9):1218-1222 doi: 10.3321/j.issn:1000-0054.2004.09.018 |
| [13] | WANG S Y, LIU J S, MA T B. Dynamics and changes in spatial patterns of land use in Yellow River Basin, China[J]. Land Use Policy, 2010, 27(2):313-323 doi: 10.1016/j.landusepol.2009.04.002 |
| [14] | 张冉, 王义民, 畅建霞, 等.基于水资源分区的黄河流域土地利用变化对人类活动的响应[J].自然资源学报, 2019, 34(2):274-287 https://www.cnki.com.cn/Article/CJFDTOTAL-ZRZX201902005.htm ZHANG R, WANG Y M, CHANG J X, et al. Response of land use change to human activities in the Yellow River Basin based on water resources division[J]. Journal of Natural Resources, 2019, 34(2):274-287 https://www.cnki.com.cn/Article/CJFDTOTAL-ZRZX201902005.htm |
| [15] | 解宪丽, 孙波, 周慧珍, 等.中国土壤有机碳密度和储量的估算与空间分布分析[J].土壤学报, 2004, 41(1):35-43 doi: 10.3321/j.issn:0564-3929.2004.01.006 XIE X L, SUN B, ZHOU H Z, et al. Organic carbon density and storage in soils of China and spatial analysis[J]. Acta Pedologica Sinica, 2004, 41(1):35-43 doi: 10.3321/j.issn:0564-3929.2004.01.006 |
| [16] | 李克让, 王绍强, 曹明奎.中国植被和土壤碳贮量[J].中国科学:D辑, 2003, 33(1):72-80 https://www.cnki.com.cn/Article/CJFDTOTAL-JDXK200301007.htm LI K R, WANG S Q, CAO M K. Carbon storage of vegetation and soil in China[J]. Science China, 2003, 33(1):72-80 https://www.cnki.com.cn/Article/CJFDTOTAL-JDXK200301007.htm |
| [17] | 陈利军, 刘高焕, 励惠国, 等.中国植被净第一性生产力遥感动态监测[J].遥感学报, 2002, 6(2):129-135 https://www.cnki.com.cn/Article/CJFDTOTAL-YGXB200202009.htm CHEN L J, LIU G H, LI H G, et al. Estimating net primary productivity of terrestrial vegetation in china using remote sensing[J]. Journal of Remote Sensing, 2002, 6(2):129-135 https://www.cnki.com.cn/Article/CJFDTOTAL-YGXB200202009.htm |
| [18] | 张杰, 李敏, 敖子强, 等.中国西部干旱区土壤有机碳储量估算[J].干旱区资源与环境, 2018, 32(9):132-137 https://www.cnki.com.cn/Article/CJFDTOTAL-GHZH201809021.htm ZHANG J, LI M, AO Z Q, et al. Estimation of soil organic carbon storage of terrestrial ecosystem in arid western China[J]. Journal of Arid Land Resources and Environment, 2018, 32(9):132-137 https://www.cnki.com.cn/Article/CJFDTOTAL-GHZH201809021.htm |
| [19] | CHUAI X W, HUANG X J, LAI L, et al. Land use structure optimization based on carbon storage in several regional terrestrial ecosystems across China[J]. Environmental Science & Policy, 2013, 25:50-61 http://www.sciencedirect.com/science/article/pii/S146290111200072X |
| [20] | FU Q, XU L L, ZHENG H Y, et al. Spatiotemporal dynamics of carbon storage in response to urbanization:A case study in the Su-Xi-Chang Region, China[J]. Processes, 2019, 7(11):836 doi: 10.3390/pr7110836 |
| [21] | RAICH J W, NADELHOFFER K J. Belowground carbon allocation in forest ecosystems:Global trends[J]. Ecology, 1989, 70(5):1346-1354 doi: 10.2307/1938194 |
| [22] | ALAM S A, STARR M, CLARK B J F. Tree biomass and soil organic carbon densities across the Sudanese woodland savannah:A regional carbon sequestration study[J]. Journal of Arid Environments, 2013, 89:67-76 doi: 10.1016/j.jaridenv.2012.10.002 |
| [23] | GIARDINA C P, RYAN M G. Evidence that decomposition rates of organic carbon in mineral soil do not vary with temperature[J]. Nature, 2000, 404(6780):858-861 doi: 10.1038/35009076 |
| [24] | 陈光水, 杨玉盛, 刘乐中, 等.森林地下碳分配(TBCA)研究进展[J].亚热带资源与环境学报, 2007, 2(1):34-42 doi: 10.3969/j.issn.1673-7105.2007.01.005 CHEN G S, YANG Y S, LIU L Z, et al. Research review on total belowground carbon allocation in forest ecosystems[J]. Journal of Subtropical Resources and Environment, 2007, 2(1):34-42 doi: 10.3969/j.issn.1673-7105.2007.01.005 |
| [25] | 黄卉.基于InVEST模型的土地利用变化与碳储量研究[D].北京: 中国地质大学, 2015 HUANG H. Research on land use/land cover change and carbon storage based on InVEST model[D]. Beijing: China University of Geosciences, 2015 |
| [26] | SANG L L, ZHANG C, YANG J Y, et al. Simulation of land use spatial pattern of towns and villages based on CA-Markov model[J]. Mathematical and Computer Modelling, 2011, 54(3/4):938-943 http://dl.acm.org/citation.cfm?id=2281284 |
| [27] | SANG N, MILLER D, ODE ?. Landscape metrics and visual topology in the analysis of landscape preference[J]. Environment and Planning B:Urban Analytics and City Science, 2008, 35(3):504-520 http://www.nrcresearchpress.com/servlet/linkout?suffix=refg38/ref38&dbid=16&doi=10.1139%2Fcjfr-2012-0210&key=10.1068%2Fb33049 |
| [28] | ZHAO M M, HE Z B, DU J, et al. Assessing the effects of ecological engineering on carbon storage by linking the CA-Markov and InVEST models[J]. Ecological Indicators, 2019, 98:29-38 doi: 10.1016/j.ecolind.2018.10.052 |
| [29] | NASEHI S, NAMIN A I, SALEHI E. Simulation of land cover changes in urban area using CA-Markov model (case study:Zone 2 in Tehran, Iran)[J]. Modeling Earth Systems and Environment, 2019, 5(1):193-202 doi: 10.1007/s40808-018-0527-9 |
| [30] | WICKRAMASURIYA R C, BREGT A K, VAN DELDEN H, et al. The dynamics of shifting cultivation captured in an extended Constrained Cellular Automata land use model[J]. Ecological Modelling, 2009, 220(18):2302-2309 doi: 10.1016/j.ecolmodel.2009.05.021 |
| [31] | WANG Q H, KALANTAR-ZADEH K, KIS A, et al. Electronics and optoelectronics of two-dimensional transition metal dichalcogenides[J]. Nature Nanotechnology, 2012, 7(11):699-712 doi: 10.1038/nnano.2012.193 |
| [32] | SUN C M, HALL J A, BLANK R B, et al. Small intestine lamina propria dendritic cells promote de novo generation of Foxp3 T reg cells via retinoic acid[J]. Journal of Experimental Medicine, 2007, 204(8):1775-1785 doi: 10.1084/jem.20070602 |
| [33] | 黄康, 戴文远, 黄万里, 等.基于CA-Markov和InVEST模型的土地利用变化对生境影响评价——以福建省福州新区为例[J].水土保持通报, 2019, 39(6):155-162 https://www.cnki.com.cn/Article/CJFDTOTAL-STTB201906025.htm HUANG K, DAI W Y, HUANG W L, et al. Impacts of land use change evaluation on habitat quality based on CA-Markov and InVEST models—Taking Fuzhou New District of Fujian Province as an example[J]. Bulletin of Soil and Water Conservation, 2019, 39(6):155-162 https://www.cnki.com.cn/Article/CJFDTOTAL-STTB201906025.htm |
| [34] | 彭玺, 张亚威.湘乡市林地森林碳储量及碳密度研究[J].中南林业调查规划, 2019, 38(1):62-67 https://www.cnki.com.cn/Article/CJFDTOTAL-ZLDF201901014.htm PENG X, ZHANG Y W. Study on carbon storage and carbon density of forest land in Xiangxiang[J]. Central South Forest Inventory and Planning, 2019, 38(1):62-67 https://www.cnki.com.cn/Article/CJFDTOTAL-ZLDF201901014.htm |
| [35] | CAO V, MARGNI M, FAVIS B D, et al. Aggregated indicator to assess land use impacts in life cycle assessment (LCA) based on the economic value of ecosystem services[J]. Journal of Cleaner Production, 2015, 94:56-66 doi: 10.1016/j.jclepro.2015.01.041 |
| [36] | VO T Q, KUENZER C, OPPELT N. How remote sensing supports mangrove ecosystem service valuation:a case study in Ca Mau Province, Vietnam[J]. Ecosystem Services, 2015, 14:67-75 doi: 10.1016/j.ecoser.2015.04.007 |
| [37] | TARDIEU L, ROUSSEL S, THOMPSON J D, et al. Combining direct and indirect impacts to assess ecosystem service loss due to infrastructure construction[J]. Journal of Environmental Management, 2015, 152:145-157 http://www.sciencedirect.com/science/article/pii/S0301479715000432 |
| [38] | KROGH L, NOERGAARD A, HERMANSEN M, et al. Preliminary estimates of contemporary soil organic carbon stocks in Denmark using multiple datasets and four scaling-up methods[J]. Agriculture, Ecosystems & Environment, 2003, 96(1/3):19-28 http://www.sciencedirect.com/science/article/pii/S0167880903000161 |
| [39] | PAGIOLA S. Payments for environmental services in Costa Rica[J]. Ecological Economics, 2008, 65(4):712-724 doi: 10.1016/j.ecolecon.2007.07.033 |
| [40] | 何丹, 周璟, 高伟, 等.基于CA-Markov模型的滇池流域土地利用变化动态模拟研究[J].北京大学学报:自然科学版, 2014, 50(6):1095-1105 https://www.cnki.com.cn/Article/CJFDTOTAL-BJDZ201406014.htm HE D, ZHOU J, GAO W, et al. An integrated CA-Markov model for dynamic simulation of land use change in Lake Dianchi Watershed[J]. Acta Scientiarum Naturalium Universitatis Pekinensis, 2014, 50(6):1095-1105 https://www.cnki.com.cn/Article/CJFDTOTAL-BJDZ201406014.htm |
