张梦瑶1,
肖靖秀1,
郑毅1, 2,
汤利1,,
1.云南农业大学资源与环境学院 昆明 650201
2.云南开放大学 昆明 650201
基金项目: 国家自然科学基金项目31760615
国家重点研发计划项目2017YFD02002007
云南省科技人才与平台计划2019IC026
详细信息
作者简介:任家兵, 主要从事养分资源高效利用研究。E-mail:415685073@qq.com
通讯作者:汤利, 主要从事农业资源与环境等方面研究。E-mail:tangli7650@163.com
中图分类号:S512.1;S643.6计量
文章访问数:224
HTML全文浏览量:21
PDF下载量:125
被引次数:0
出版历程
收稿日期:2020-04-21
录用日期:2020-08-06
刊出日期:2020-12-01
Wheat and faba bean intercropping to improve yield and response to nitrogen
REN Jiabing1,,ZHANG Mengyao1,
XIAO Jingxiu1,
ZHENG Yi1, 2,
TANG Li1,,
1. College of Resources and Environmental Sciences, Yunnan Agricultural University, Kunming 650201, China
2. Yunnan Open University, Kunming 650201, China
Funds: the National Natural Science Foundation of China31760615
the National Key Research and Development Project of China2017YFD02002007
the Science and Technology Talents and Platform of Yunnan Province2019IC026
More Information
Corresponding author:TANG Li, E-mail:tangli7650@163.com
摘要
HTML全文
图
参考文献
相关文章
施引文献
资源附件
访问统计
摘要
摘要:为探明小麦||蚕豆间作体系种间互补和竞争与产量优势的关系及其氮肥响应,为豆科禾本科间作最佳氮素管理提供指导,本研究通过为期2年(2015—2017年)的田间定位试验,在不施氮(N0)、低氮(N1,90 kg·hm-2)、常规施氮(N2,180 kg·hm-2)和高氮(N3,270 kg·hm-2)4个施氮水平下,研究小麦||蚕豆间作的产量优势及其相关种间关系。结果表明,与单作相比,两年的间作小麦产量平均显著增加23.50%,单、间作蚕豆的产量均维持在4 000 kg·hm-2左右,土地当量比均表现为N0 > N1 > N2 > N3 > 1的趋势,系统生产力平均达5 023 kg·hm-2。与单作相比,间作小麦和蚕豆的花后干物质累积比例、干物质转移率和贡献率均不同程度增加,增幅随着施氮量增加而降低。不同施氮水平下,小麦的种间相对关系指数均表现出明显的互利效应,相对种间竞争强度在低氮水平为种内竞争,常规氮和高氮水平为种间竞争;蚕豆的种间相对关系指数则表现出竞争效应,相对种间竞争强度表现为种内竞争。较蚕豆而言,小麦的相对种间竞争力表现出不同程度的竞争优势,在种间竞争力为0.629 2时可获得最大的间作体系混合干物质量16 093 kg·hm-2。综上,小麦||蚕豆间作降低了低氮水平下的种间竞争强度,扩大了小麦的互利效应和竞争优势,增加了间作作物的花后干物质累积比例以及干物质贡献率,表现出明显的间作产量优势。
关键词:小麦||蚕豆间作/
种内竞争/
种间竞争/
种间互补/
间作产量优势/
施氮水平
Abstract:The wheat and faba bean intercropping system improves crop yield. However, there are few systematic reports on the relationship between the yield advantage and the interspecific interaction and its response to nitrogen fertilizer. Nitrogen applications were tested to improve nitrogen management in intercropped legumes and grasses, gather information on efficient nutrient use, and determine the interspecific influence on wheat and faba bean yields. The field positioning test was conducted from 2015 to 2017 to study yield advantages and interspecies relationship of wheat||faba bean intercropping system under various nitrogen application levels:no nitrogen (N0), low nitrogen (N1, 90 kg·hm-2), conventional nitrogen (N2, 180 kg·hm-2), and high nitrogen (N3, 270 kg·hm-2). Compared with monocropped wheat, the intercropped wheat yield was significantly higher in all treatments[2016:24.55% (N0), 20.71% (N1), 19.92% (N2), 16.77% (N3); 2017:35.89% (N0), 28.63% (N1), 23.32% (N2), 18.25% (N3)]. The mono and intercropped faba bean yields were both around 4 000 kg·hm-2. The land equivalent ratio of the intercropping system under different nitrogen levels was N0 > N1 > N2 > N3 > 1, and the average intercropping productivity reached 5 023 kg·hm-2 in two years. The intercropped wheat dry matter accumulation ratio after flowering, transfer rate, and contribution rate increased by 37.68%, 7.95%, and 10.59%, respectively, and the intercropped faba beans increased by 19.66%, 41.43%, and 17.64%, respectively, compared with the monocultured crops. The increase rate decreased as nitrogen increased, and the intercropped wheat dry matter accumulation ratio after flowering was significantly different at N2 and N3 levels in 2016. The average wheat relative interaction indexes were 0.13 (N0), 0.11 (N1), 0.10 (N2), and 0.08 (N3), showing mutually beneficial effects, but the faba bean indices were -0.008 (N0), -0.03 (N1), -0.08 (N2), and -0.08 (N3), indicating a competitive effect. The average wheat relative competition intensity values were -0.19 (N0), -0.08 (N1), 0.21 (N2), and 0.32 (N3), indicating intraspecific competition at low nitrogen levels (N0, N1) and interspecific competition at conventional (N2) and high (N3) nitrogen levels. All faba bean values indicated intraspecific competition:-0.75 (N0), -0.75 (N1), -0.66 (N2), and -0.65 (N3). The relative interspecific competitiveness values of wheat versus faba beans were 0.51 (N0), 0.54 (N1), 0.56 (N2), and 0.58 (N3), suggesting different degrees of competitive advantage. Competitiveness was significantly correlated (a quadratic curve) with the above-ground dry matter of the intercropping system. The maximum mixed dry matter mass of the intercropping system (16 093 kg·hm-2) was reached when the wheat versus faba bean interspecific competitiveness value was 0.629 2. Wheat and faba bean intercropping reduced the interspecific competition intensity in a low nitrogen environment (N0, N1). It also expanded the mutually beneficial effects and competitive advantages of wheat and increased the dry matter accumulation ratio after flowering and the dry matter contribution rate of intercropping crops. The maximum competitive advantage of intercropped wheat was at the conventional nitrogen level (N2, 180 kg·hm-2).
Key words:Wheat and faba bean intercropping/
Intraspecific competition/
Interspecific competition/
Interspecific complementation/
Advantage of intercropping yield/
Nitrogen application level
HTML全文
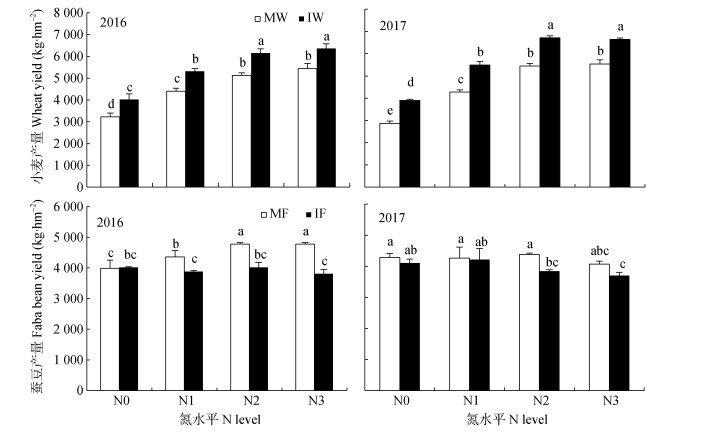
图12016年和2017年不同施氮水平下单作和间作小麦和蚕豆的产量
不同小写字母表示不同施氮水平下单、间作之间在P < 0.05水平差异显著。N0、N1、N2和N3的施氮量分别为0 kg·hm-2、90 kg·hm-2、180 kg·hm-2和270 kg·hm-2; MW为单作小麦, IW为间作小麦, MF为单作蚕豆, IF为间作蚕豆。
Figure1.Yield of monocropped and intercropped wheat and faba bean under different nitrogen levels in 2016 and 2017
Different lowercase letters mean significant differences among different treatments of nitrogen levels and cropping patterns at P < 0.05 level. The nitrogen rates of N0, N1, N2 and N3 nitrogen levels are 0 kg·hm-2, 90 kg·hm-2, 180 kg·hm-2 and 270 kg·hm-2, respectively; MW, IW, MF and IF mean monocropped wheat, intercropped wheat, monocropped faba bean and intercropped faba bean, respectively.
 下载: 全尺寸图片幻灯片
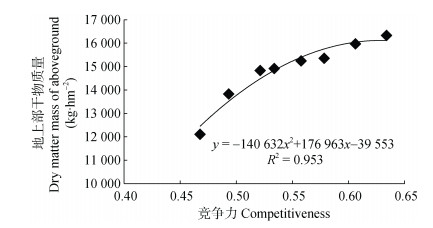
图2小麦相对蚕豆的种间竞争力和小麦||蚕豆间作体系地上部干物质量的关系
Figure2.Relationship between interspecific competitiveness of wheat relative to faba bean and mass of dry matter of aboveground of wheat||faba bean intercropping system
下载: 全尺寸图片幻灯片表1不同施氮水平下小麦||蚕豆间作系统土地当量比和系统生产力
Table1.Land equivalent ratio and system production of wheat||faba bean intercropping system under different nitrogen levels
| N0 | N1 | N2 | N3 | ||
| 系统生产力 System productivity (kg·hm-2) | 2016 | 4 019±162.56c | 4 836±69.34b | 5 436±185.91a | 5 505±193.25a |
| 2017 | 3 968±11.79c | 5 069±116.91b | 5 757±117.85a | 5 597±43.37a | |
| 平均值Average | 3 993±81.71c | 4 952±93.12b | 5 596±151.88a | 5 551±118.31a | |
| 土地当量比 Land equivalent ratio | 2016 | 1.17±0.03a | 1.10±0.01b | 1.08±0.02c | 1.04±0.00d |
| 2017 | 1.23±0.02a | 1.19±0.02b | 1.11±0.00c | 1.09±0.01d | |
| 平均值Average | 1.20±0.02a | 1.15±0.01b | 1.09±0.01c | 1.07±0.01d | |
| 同行不同小写字母表示不同施氮水平之间在P < 0.05水平差异显著。N0、N1、N2和N3的施氮量分别为0 kg·hm-2、90 kg·hm-2、180 kg·hm-2和270 kg·hm-2。Different lowercase letters in the same row mean significant differences among different nitrogen levels at P < 0.05 level. The nitrogen rates of N0, N1, N2 and N3 nitrogen levels are 0 kg·hm-2, 90 kg·hm-2, 180 kg·hm-2 and 270 kg·hm-2, respectively. | |||||
下载: 导出CSV表2不同施氮水平下单作和间作小麦和蚕豆的花后干物质累积比例
Table2.Accumulation rates of dry matter after flowering of monocropped and intercropped wheat and faba bean under different nitrogen levels ?
| 年份Year | 种植模式Cropping pattern | N0 | N1 | N2 | N3 |
| 2016 | 单作小麦Monocropped wheat | 14.09±10.86abc | 10.79±4.43bc | 7.79±1.22c | 8.81±2.26bc |
| 间作小麦Intercropped wheat | 18.35±5.22a | 15.61±6.55ab | 14.87±3.71abc | 13.66±1.54abc | |
| 单作蚕豆Monocropped faba bean | 8.86±2.61a | 11.36±3.03a | 11.21±7.53a | 12.55±2.73a | |
| 间作蚕豆Intercropped faba bean | 9.80±7.49a | 12.59±2.34a | 13.83±11.17a | 16.40±1.92a | |
| 2017 | 单作小麦Monocropped wheat | 21.26±6.14a | 17.16±7.02a | 14.93±2.00a | 15.24±5.33a |
| 间作小麦Intercropped wheat | 23.50±6.65a | 19.00±6.18a | 20.31±5.94a | 18.90±0.73a | |
| 单作蚕豆Monocropped faba bean | 14.12±6.14b | 24.82±1.25ab | 19.14±10.51ab | 27.11±2.89a | |
| 间作蚕豆Intercropped faba bean | 22.31±9.42ab | 26.51±3.99a | 28.72±5.57a | 24.97±3.55ab | |
| 同行不同小写字母表示不同施氮水平之间单、间作小麦或蚕豆在P < 0.05水平差异显著。N0、N1、N2和N3的施氮量分别为0 kg·hm-2、90 kg·hm-2、180 kg·hm-2和270 kg·hm-2。Different lowercase letters in the same row mean significant differences among different nitrogen levels of wheat or faba bean in different cropping patterns at P < 0.05 level. The nitrogen rates of N0, N1, N2 and N3 nitrogen levels are 0 kg·hm-2, 90 kg·hm-2, 180 kg·hm-2 and 270 kg·hm-2, respectively. | |||||
下载: 导出CSV表3不同施氮水平下单作和间作小麦、蚕豆的干物质转移率和干物质贡献率
Table3.Dry matter transfer rates and contribution rates of monocropped and intercropped wheat and faba bean under different nitrogen levels ?
| 年份Year | 种植模式Cropping pattern | N0 | N1 | N2 | N3 | |
| 干物质转移率 Dry matter transfer rate | 2016 | 单作小麦Monocropped wheat | 44.64±1.79ab | 40.69±2.81bc | 35.84±4.35bc | 32.54±2.97c |
| 间作小麦Intercropped wheat | 50.78±7.23a | 42.62±7.84ab | 36.18±4.02bc | 32.73±1.58c | ||
| 单作蚕豆Monocropped faba bean | 43.73±4.71ab | 40.67±4.25abc | 35.43±9.62bc | 32.46±4.31c | ||
| 间作蚕豆Intercropped faba bean | 51.32±7.93a | 48.99±1.33a | 45.15±7.72ab | 41.92±0.34abc | ||
| 2017 | 单作小麦Monocropped wheat | 39.42±4.25ab | 35.81±8.04abc | 30.51±6.86bc | 27.30±4.36c | |
| 间作小麦Intercropped wheat | 45.37±5.52a | 40.23±8.06ab | 32.85±3.17bc | 28.40±1.30c | ||
| 单作蚕豆Monocropped faba bean | 39.99±7.77ab | 30.17±1.84bcd | 26.88±7.35cd | 18.92±6.01d | ||
| 间作蚕豆Intercropped faba bean | 44.17±9.33a | 41.77±7.44ab | 35.69±4.69abc | 42.09±3.81ab | ||
| 干物质贡献率 Dry matter contribution rate | 2016 | 单作小麦Monocropped wheat | 69.08±9.94a | 69.46±14.42a | 68.81±10.26a | 67.41±3.93a |
| 间作小麦Intercropped wheat | 73.17±5.86a | 77.17±9.37a | 80.89±4.37a | 77.00±6.55a | ||
| 单作蚕豆Monocropped faba bean | 81.61±6.55a | 75.87±7.22a | 67.29±10.74a | 60.15±7.85a | ||
| 间作蚕豆Intercropped faba bean | 82.11±14.61a | 77.29±4.04a | 73.30±7.96a | 68.17±3.32a | ||
| 2017 | 单作小麦Monocropped wheat | 60.36±12.85a | 62.68±12.24a | 54.53±14.60a | 54.93±1.72a | |
| 间作小麦Intercropped wheat | 65.51±11.56a | 63.00±7.83a | 63.65±5.42a | 60.52±13.23a | ||
| 单作蚕豆Monocropped faba bean | 50.48±4.57a | 47.74±1.32a | 39.98±12.45a | 33.55±10.22a | ||
| 间作蚕豆Intercropped faba bean | 60.56±17.81a | 53.47±9.47a | 47.15±9.93a | 55.84±6.81a | ||
| 同行不同小写字母表示不同施氮水平之间单、间作小麦或蚕豆在P < 0.05水平差异显著。N0、N1、N2和N3的施氮量分别为0 kg·hm-2、90 kg·hm-2、180 kg·hm-2和270 kg·hm-2。Different lowercase letters in the same row mean significant differences among different nitrogen levels of wheat or faba bean in different cropping patterns at P < 0.05 level. The nitrogen rates of N0, N1, N2 and N3 nitrogen levels are 0 kg·hm-2, 90 kg·hm-2, 180 kg·hm-2 and 270 kg·hm-2, respectively. | ||||||
下载: 导出CSV表4不同施氮水平下小麦||蚕豆间作系统的作物种间相对关系指数
Table4.Relative interaction indexes of crops of wheat||faba bean intercropping system under different nitrogen levels
| 作物Crop | 年份Year | N0 | N1 | N2 | N3 |
| 小麦 Wheat | 2016 | 0.11±0.01a | 0.09±0.003b | 0.09±0.01b | 0.08±0.004c |
| 2017 | 0.15±0.01a | 0.13±0.003b | 0.10±0.004b | 0.08±0.01c | |
| 平均值Average | 0.13±0.01a | 0.11±0.003b | 0.10±0.004b | 0.08±0.01c | |
| 蚕豆 Faba bean | 2016 | 0.004±0.03a | -0.06±0.02b | -0.09±0.01b | -0.11±0.01b |
| 2017 | -0.02±0.01a | -0.004±0.04ab | -0.07±0.02ab | -0.05±0.01b | |
| 平均值Average | -0.01±0.02a | -0.03±0.03ab | -0.08±0.02ab | -0.08±0.01b | |
| 同行不同小写字母表示不同施氮水平间在P < 0.05水平差异显著。N0、N1、N2和N3的施氮量分别为0 kg·hm-2、90 kg·hm-2、180 kg·hm-2和270 kg·hm-2。Different lowercase letters in the same row mean significant differences among different nitrogen levels at P < 0.05 level. The nitrogen rates of N0, N1, N2 and N3 nitrogen levelss are 0 kg·hm-2, 90 kg·hm-2, 180 kg·hm-2 and 270 kg·hm-2, respectively. | |||||
下载: 导出CSV表5不同施氮水平下小麦||蚕豆间作系统的作物相对种间竞争
Table5.Relative interspecific competitiveness of wheat to faba bean of wheat||faba bean intercropping system under different nitrogen levels
| 年份Year | N0 | N1 | N2 | N3 |
| 2016 | 0.56±0.01a | 0.58±0.04a | 0.61±0.02a | 0.63±0.03a |
| 2017 | 0.47±0.04a | 0.49±0.03a | 0.52±0.04a | 0.53±0.001a |
| 平均值 Average | 0.51±0.02a | 0.54±0.03a | 0.56±0.03a | 0.58±0.02a |
| 同行不同小写字母表示不同施氮水平间在P < 0.05水平差异显著。N0、N1、N2和N3的施氮量分别为0 kg·hm-2、90 kg·hm-2、180 kg·hm-2和270 kg·hm-2。Different lowercase letters in the same row mean significant differences among different nitrogen levels in the same year at P < 0.05 level. The nitrogen rates of N0, N1, N2 and N3 nitrogen levels are 0 kg·hm-2, 90 kg·hm-2, 180 kg·hm-2 and 270 kg·hm-2, respectively. | ||||
下载: 导出CSV表6不同施氮水平下小麦||蚕豆间作系统作物的相对种间竞争强度
Table6.Relative competition intensity of wheat to faba bean of wheat||faba bean intercropping system under different nitrogen levels
| 作物Crop | 年份Year | N0 | N1 | N2 | N3 |
| 小麦 Wheat | 2016 | -0.13±0.08c | -0.01±0.17bc | 0.26±0.14ab | 0.40±0.04a |
| 2017 | -0.24±0.14b | -0.15±0.004b | 0.16±0.01a | 0.24±0.03a | |
| 平均值Average | -0.18±0.11b | -0.08±0.09b | 0.21±0.08a | 0.32±0.03a | |
| 蚕豆 Faba bean | 2016 | -0.82±0.02c | -0.81±0.01bc | -0.73±0.03ab | -0.72±0.05a |
| 2017 | -0.67±0.15a | -0.69±0.06a | -0.59±0.10a | -0.58±0.01a | |
| 平均值Average | -0.75±0.08a | -0.75±0.03a | -0.66±0.06a | -0.65±0.03a | |
| 同行不同小写字母表示不同施氮水平间在P < 0.05水平差异显著。N0、N1、N2和N3的施氮量分别为0 kg·hm-2、90 kg·hm-2、180 kg·hm-2和270 kg·hm-2。Different lowercase letters in the same row mean significant differences among different nitrogen levels in the same year at P < 0.05 level. The nitrogen rates of N0, N1, N2 and N3 nitrogen levels are 0 kg·hm-2, 90 kg·hm-2, 180 kg·hm-2 and 270 kg·hm-2, respectively. | |||||
下载: 导出CSV参考文献
| [1] | MU Y P, CHAI Q, YU A Z, et al. Performance of wheat/maize intercropping is a function of belowground interspecies interactions[J]. Crop Science, 2013, 53(5): 2186-2194 doi: 10.2135/cropsci2012.11.0619 |
| [2] | AGEGNEHU G, GHIZAW A, SINEBO W. Yield potential and land-use efficiency of wheat and faba bean mixed intercropping[J]. Agronomy for Sustainable Development, 2008, 28(2): 257-263 doi: 10.1051/agro:2008012 |
| [3] | DAPAAH H K, ASAFU-AGYEI J N, ENNIN S A, et al. Yield stability of cassava, maize, soya bean and cowpea intercrops[J]. The Journal of Agriculture Science, 2003, 140(1): 73-82 |
| [4] | NDAKIDEMI P A. Manipulating legume/cereal mixtures to optimize the above and below ground interactions in the traditional African cropping systems[J]. African Journal of Biotechnology, 2006, 5(25): 2526-2533 |
| [5] | FIRBANK L G, WATKINSON A R. On the effects of competition: From monocultures to mixtures[M]//GRACE J B, TILMAN D. Perspectives on Plant Competition. San Diego: Academic Press, 1990: 165-192 |
| [6] | YANG F, LIAO D P, FAN Y F, et al. Effect of narrow-row planting patterns on crop competitive and economic advantage in maize-soybean relay strip intercropping system[J]. Plant Production Science, 2017, 20(1): 1-11 doi: 10.1080/1343943X.2016.1224553 |
| [7] | LI L, SUN J H, ZHANG F S, et al. Wheat/maize or wheat/soybean strip intercropping: Ⅱ. Recovery or compensation of maize and soybean after wheat harvesting[J]. Field Crops Research, 2001, 71(3): 173-181 doi: 10.1016/S0378-4290(01)00157-5 |
| [8] | TSAY J S, FUKAI S, WILSON G L. Effects of relative sowing time of soybean on growth and yield of cassava in cassava/soybean intercropping[J]. Field Crops Research, 1988, 19(3): 227-239 doi: 10.1016/0378-4290(88)90045-7 |
| [9] | 肖焱波, 李隆, 张福锁.豆科//禾本科间作系统中氮营养研究进展[J].中国农业科技导报, 2003, 5(6): 44-49 XIAO Y B, LI L, ZHANG F S. An outlook of the complementary nitrogen nutrition in the legume//graminaceae system[J]. Review of China Agricultural Science and Technology, 2003, 5(6): 44-49 |
| [10] | 李玉英, 余常兵, 孙建好, 等.蚕豆/玉米间作系统经济生态施氮量及对氮素环境承受力[J].农业工程学报, 2008, 24(3): 223-227 LI Y Y, YU C B, SUN J H, et al. Nitrogen environmental endurance and economically-ecologically appropriate amount of nitrogen fertilizer in faba bean/maize intercropping system[J]. Transactions of the CSAE, 2008, 24(3): 223-227 |
| [11] | HAUGGAARD-NIELSEN H, GOODING M, AMBUS P, et al. Pea-barley intercropping for efficient symbiotic N2-fixation, soil N acquisition and use of other nutrients in European organic cropping systems[J]. Field Crops Research, 2009, 113(1): 64-71 doi: 10.1016/j.fcr.2009.04.009 |
| [12] | VAN KESSEL C, HARTLEY H. Agricultural management of grain legumes: Has it led to an increase in nitrogen fixation?[J]. Field Crops Research, 2000, 65(2/3): 165-181 |
| [13] | 耿川雄, 任家兵, 马心灵, 等.基于LCA的不同间作体系产量优势及温室效应研究[J].中国生态农业学报(中英文), 2020, 28(2): 159-167 http://www.ecoagri.ac.cn/zgstny/ch/reader/view_abstract.aspx?file_no=2020-0201&flag=1 GENG C X, REN J B, MA X L, et al. Yield improvement and greenhouse effect of different intercropping systems based on life cycle assessment[J]. Chinese Journal of Eco-Agriculture, 2020, 28(2): 159-167 http://www.ecoagri.ac.cn/zgstny/ch/reader/view_abstract.aspx?file_no=2020-0201&flag=1 |
| [14] | 罗娅婷, 汤利, 郑毅, 等.不同施氮水平下小麦蚕豆间作对作物产量和蚕豆根际镰刀菌的影响[J].土壤通报, 2012, 43(4): 826-831 LUO Y T, TANG L, ZHENG Y, et al. Effects of wheat-fababean intercropping on the yield and rhizosphere pathogen in different N application rates[J]. Chinese Journal of Soil Science, 2012, 43(4): 826-831 |
| [15] | 李勇杰, 陈远学, 汤利, 等.地下部分隔对间作小麦养分吸收和白粉病发生的影响[J].植物营养与肥料学报, 2007, 13(5): 929-934 LI Y J, CHEN Y X, TANG L, et al. Effects of root separation on nutrient uptake of wheat and occurrence of powdery mildew under wheat-faba bean intercropping[J]. Plant Nutrition and Fertilizer Science, 2007, 13(5): 929-934 |
| [16] | 肖靖秀, 汤利, 郑毅.氮肥用量对油菜//蚕豆间作系统作物产量及养分吸收的影响[J].植物营养与肥料学报, 2011, 17(6): 1468-1473 XIAO J X, TANG L, ZHENG Y. Effects of N fertilization on yield and nutrient absorption in rape and faba bean intercropping system[J]. Plant Nutrition and Fertilizer Science, 2011, 17(6): 1468-1473 |
| [17] | 张德闪, 王宇蕴, 汤利, 等.小麦蚕豆间作对红壤有效磷的影响及其与根际pH值的关系[J].植物营养与肥料学报, 2013, 19(1): 127-133 ZHANG D S, WANG Y Y, TANG L, et al. Effects of wheat and faba bean intercropping on available phosphorus of red soils and its relationship with rhizosphere soil pH[J]. Plant Nutrition and Fertilizer Science, 2013, 19(1): 127-133 |
| [18] | 王宇蕴, 任家兵, 郑毅, 等.间作小麦根际和土体磷养分的动态变化[J].云南农业大学学报, 2011, 26(6): 851-855 WANG Y Y, REN J B, ZHENG Y, et al. Dynamics of available phosphorus in rhizosphere and bulk soil of wheat under intercropping[J]. Journal of Yunnan Agricultural University, 2011, 26(6): 851-855 |
| [19] | 董艳, 董坤, 杨智仙, 等.间作减轻蚕豆枯萎病的微生物和生理机制[J].应用生态学报, 2016, 27(6): 1984-1992 DONG Y, DONG K, YANG Z X, et al. Microbial and physiological mechanisms for alleviating fusarium wilt of faba bean in intercropping system[J]. Chinese Journal of Applied Ecology, 2016, 27(6): 1984-1992 |
| [20] | 杨智仙, 汤利, 郑毅, 等.不同品种小麦与蚕豆间作对蚕豆枯萎病发生、根系分泌物和根际微生物群落功能多样性的影响[J].植物营养与肥料学报, 2014, 20(3): 570-579 YANG Z X, TANG L, ZHENG Y, et al. Effects of different wheat cultivars intercropped with faba bean on faba bean Fusarium wilt, root exudates and rhizosphere microbial community functional diversity[J]. Plant Nutrition and Fertilizer Science, 2014, 20(3): 570-579 |
| [21] | 任家兵, 汤利, 耿川雄, 等.基于LCA分析的间作小麦土壤酸化气体排放[J].土壤学报, 2019, 56(5): 1259-1268 REN J B, TANG L, GENG C X, et al. Emission of acidified gas from intercropped wheat field based on LCA analysis[J]. Acta Pedologica Sinica, 2019, 56(5): 1259-1268 |
| [22] | XIAO J X, YIN X H, REN J B, et al. Complementation drives higher growth rate and yield of wheat and saves nitrogen fertilizer in wheat and faba bean intercropping[J]. Field Crops Research, 2018, 221: 119-129 doi: 10.1016/j.fcr.2017.12.009 |
| [23] | 字淑慧, 吴开贤, 安曈昕, 等.行距对间作玉米/马铃薯产量优势和种间关系的影响[J].云南农业大学学报:自然科学版, 2019, 34(2): 200-209 ZI S H, WU K X, AN T X, et al. Effects of row spacing on the yields advantage and interspecific interaction of the intercropped maize and potato[J]. Journal of Yunnan Agricultural University: Natural Science, 2019, 34(2): 200-209 |
| [24] | 李娟, 王文丽, 赵旭, 等.根际分隔对玉米/豌豆间作种间竞争及豌豆结瘤固氮的影响[J].干旱地区农业研究, 2016, 34(6): 177-183 LI J, WANG W L, ZHAO X, et al. Effect of roots partitions on interspecific competition and nitrogen fixation in the pea-maize intercropping[J]. Agricultural Research in the Arid Areas, 2016, 34(6): 177-183 |
| [25] | 王利立, 朱永永, 殷文, 等.大麦/豌豆间作系统种间竞争力及产量对地下作用和密度互作的响应[J].中国生态农业学报, 2016, 24(3): 265-273 http://www.ecoagri.ac.cn/zgstny/ch/reader/view_abstract.aspx?file_no=2016301&flag=1 WANG L L, ZHU Y Y, YIN W, et al. Competitiveness and yield response to belowground interaction and density in barley-pea intercropping system[J]. Chinese Journal of Eco-Agriculture, 2016, 24(3): 265-273 http://www.ecoagri.ac.cn/zgstny/ch/reader/view_abstract.aspx?file_no=2016301&flag=1 |
| [26] | 张妍, 王利立, 柴强, 等.施氮水平对大麦间作豌豆种间竞争的调控效应[J].农业现代化研究, 2014, 35(3): 381-384 ZHANG Y, WANG L L, CHAI Q, et al. Effects of nitrogen fertilization on inter-competitiveness in a barley-pea intercropping system[J]. Research of Agricultural Modernization, 2014, 35(3): 381-384 |
| [27] | 林伟伟, 罗晓棉, 林文雄.玉米与花生间作的根际互惠方式及其机制[J].福建农林大学学报:自然科学版, 2019, 48(4): 409-417 LIN W W, LUO X M, LIN W X. Rhizospheric mutual facilitation mode and its mechanism under maize/peanut intercropping system[J]. Journal of Fujian Agriculture and Forestry University: Natural Science Edition, 2019, 48(4): 409-417 |
| [28] | 柏文恋, 张梦瑶, 任家兵, 等.小麦/蚕豆间作作物生长曲线的模拟及种间互作分析[J].应用生态学报, 2018, 29(12): 4037-4046 BAI W L, ZHANG M Y, REN J B, et al. Simulation of crop growth curve and analysis of interspecific interaction in wheat and faba bean intercropping system[J]. Chinese Journal of Applied Ecology, 2018, 29(12): 4037-4046 |
| [29] | 马迎辉, 王玲敏, 黄玉芳, 等.氮肥运筹对冬小麦干物质累积、产量及氮素吸收利用的影响[J].华北农学报, 2013, 28(1): 187-192 MA Y H, WANG L M, HUANG Y F, et al. Effect of nitrogen application on dry matter accumulation, yield and nitrogen utilization efficiency of winter wheat[J]. Acta Agriculturae Boreali-Sinica, 2013, 28(1): 187-192 |
| [30] | 刘广才, 李隆, 黄高宝, 等.大麦/玉米间作优势及地上部和地下部因素的相对贡献研究[J].中国农业科学, 2005, 38(9): 1787-1795 LIU G C, LI L, HUANG G B, et al. Intercropping advantage and contribution of above-ground and below-ground interactions in the barley-maize intercropping[J]. Scientia Agricultura Sinica, 2005, 38(9): 1787-1795 |
| [31] | ZHANG F S, LI L. Using competitive and facilitative interactions in intercropping systems enhances crop productivity and nutrient-use efficiency[J]. Plant and Soil, 2003, 248(1): 305-312 |
| [32] | 刘广才, 杨祁峰, 李隆, 等.小麦/玉米间作优势及地上部与地下部因素的相对贡献[J].植物生态学报, 2008, 32(2): 477-484 LIU G C, YANG Q F, LI L, et al. Intercropping advantage and contribution of above- and below-ground interactions in wheat-maize intercropping[J]. Journal of Plant Ecology, 2008, 32(2): 477-484 |
| [33] | 马怡茹, 魏飞, 马子豪, 等.连作棉田间作洋葱、孜然对棉花光合特性及根系生长的影响[J].农业资源与环境学报, 2019, 36(6): 792-797 MA Y R, WEI F, MA Z H, et al. Effects of continuous cropping cotton intercropping onion and cumin on photosynthetic characteristics and root growth of cotton[J]. Journal of Agricultural Resources and Environment, 2019, 36(6): 792-797 |
| [34] | 殷文, 赵财, 于爱忠, 等.秸秆还田后少耕对小麦/玉米间作系统中种间竞争和互补的影响[J].作物学报, 2015, 41(4): 633-641 YIN W, ZHAO C, YU A Z, et al. Effect of straw returning and reduced tillage on interspecific competition and complementation in wheat/maize intercropping system[J]. Acta Agronomica Sinica, 2015, 41(4): 633-641 |
| [35] | 褚贵新, 沈其荣, 王树起.不同供氮水平对水稻/花生间作系统中氮素行为的影响[J].土壤学报, 2004, 41(5): 789-794 CHU G X, SHEN Q R, WANG S Q. Effects of N levels on biological N fixation and N transfer in intercropping system of groundnut with rice cultivated in aerobic soil[J]. Acta Pedologica Sinica, 2004, 41(5): 789-794 |
| [36] | 杨文亭, 王晓维, 王建武.豆科-禾本科间作系统中作物和土壤氮素相关研究进展[J].生态学杂志, 2013, 32(9): 2408-2484 YANG W T, WANG X W, WANG J W. Crop and soil nitrogen in legume-gramineae intercropping system: Research progress[J]. Chinese Journal of Ecology, 2013, 32(9): 2408-2484 |
