张建杰1, 2,
佟丙辛1,
马林3,
马文奇1,,
1.河北农业大学资源与环境科学学院 保定 071000
2.山西农业大学资源环境学院 太原 030031
3.中国科学院遗传与发育生物学研究所农业资源研究中心 石家庄 050022
基金项目: “十三五”国家重点研发计划项目2016YFD0200403
详细信息
作者简介:崔石磊, 研究方向为植物营养调控与养分高效管理。E-mail:acuishilei@163.com
通讯作者:马文奇, 主要从事养分资源管理与利用研究。E-mail:mawq@hebau.edu.cn
中图分类号:S19;S158.5计量
文章访问数:307
HTML全文浏览量:0
PDF下载量:279
被引次数:0
出版历程
收稿日期:2020-03-04
录用日期:2020-05-21
刊出日期:2020-08-01
Spatiotemporal variation of nitrogen indicators related to agricultural green development in China
CUI Shilei1,,ZHANG Jianjie1, 2,
TONG Bingxin1,
MA Lin3,
MA Wenqi1,,
1. College of Resources and Environmental Sciences, Hebei Agricultural University, Baoding 071000, China
2. College of Resources and Environment, Shanxi Agricultural University, Taiyuan 030031, China
3. Center for Agricultural Resources Research, Institute of Genetics and Developmental Biology, Chinese Academy of Sciences, Shijiazhuang 050022, China
Funds: the National Key Research and Development Project of China2016YFD0200403
More Information
Corresponding author:E-mail: mawq@hebau.edu.cn
摘要
HTML全文
图
参考文献
相关文章
施引文献
资源附件
访问统计
摘要
摘要:氮素在农业和食物系统中的行为关乎资源、环境、食物安全和人体健康等重要问题,是反映农业绿色发展的关键指标。本文选取18个与农业绿色发展密切相关的氮素指标,并按照农业绿色发展程度从高到低分成Ⅰ、Ⅱ、Ⅲ和Ⅳ级,基于统计数据和文献资料,通过食物链养分流动模型(NUFER)定量相关氮素指标,分析其时空变化特征,探讨相关氮素指标的影响因素,为农业绿色发展提供改善意见和建议。结果表明,1980—2017年间全国氮素使用强度、环境排放及整体利用效率均呈现由Ⅰ级向Ⅳ级水平转变的下降趋势,秸秆循环利用效率、大部分氮素生产类以及食物消费类的指标均呈现由Ⅳ级向Ⅰ级水平转变的上升趋势。从空间分布看,氮素投入和环境损失较高的区域主要分布在华北地区、华东地区、华中地区以及华南地区;食物消费水平在各地区均有提升,其中东部地区提升更明显;东部和北部地区的单位植物和动物蛋白产量水平相对较高,但仍处于Ⅲ级水平;效率类指标在31个省份中,大部分地区处于Ⅲ和Ⅳ级水平。与1980年相比,2017年全国氮素指标Ⅳ级和Ⅲ级水平占比变化不大,但Ⅰ级水平占比由27.1%降低至8.3%,农业绿色发展水平整体呈下降趋势。七大地区中各个地区Ⅰ级水平占比均降低,并且大部分地区均低于30.0%,Ⅲ级和Ⅱ级水平的占比明显增加。在指标类型方面,与1980年相比,2017年氮素生产类和食物消费类指标等级在Ⅳ级水平占比降低,农业绿色发展水平呈上升趋势;氮素环境排放类和效率类指标等级在Ⅰ级和Ⅱ级水平占比之和也在降低,农业绿色发展水平呈下降趋势。这是由种植业和畜牧业氮素资源投入高、种植以及养殖结构改变、农牧系统生产脱节严重、社会经济发展不平衡等因素造成的。因此,需要针对不同类型指标的时空变化特征,通过测土配方施肥、改变种养结构和应用氮素减排技术与政策等手段实现氮素指标的优化,推动中国农业绿色发展。
Abstract:Nitrogen is an important indicator of green development of agriculture, which is related to resources, environment, food security and human health in agricultural and food production systems. In this study, the model of NUtrient Flows in food chains, Environmental and Resources use (NUFER) was used to quantify 18 nitrogen indicators related to agricultural green development in China based on collected statistics and data from the scientific literature. Based on the potential values and thresholds reported in the literature, the levels of agricultural green development of each indicator were divided, from high to low, into levels Ⅰ, Ⅱ, Ⅲ and Ⅳ. These were used to evaluate and analyze the variations in the spatiotemporal characteristics of the nitrogen indicators, and to identify the factors influencing the relevant nitrogen indicators, which allowed us to suggest improvements for agricultural green development. From 1980-2017, the nitrogen use intensity indicators, environmental emission indicators and most of the efficiency use indicators decreased from level Ⅰ to level Ⅳ. The straw recycling efficiency indicator, most of the nitrogen production indicators and the food consumption indicators increased over time from level Ⅳ to Ⅰ. From the spatial distribution perspective, nitrogen input and environmental losses increased in the north, east, central, and south regions of China. The diet consumption level increased in all regions and was more pronounced in the eastern regions. Compared with 1980, the unit animal protein production and unit area plant protein production levels in the east and north of China were higher in 2017, but still at level Ⅲ. The levels of the efficiency indicators of agricultural green development in all regions of China were low, and most regions were still at level Ⅲ and Ⅳ in 2017. Compared to 1980, the nationwide proportion of nitrogen indicators at levels Ⅳ and Ⅲ were relatively stable in 2017, and the proportion of indicators at level Ⅰ decreased from 27.1% to 8.3%. From 1980 to 2017, the levels of agricultural green development across the whole China decreased. Among the seven major regions, the proportion of level Ⅰ in each region decreased (with most areas below 30.0%), while the proportion of levels Ⅲ and Ⅱ significantly increased. In terms of indicator types, the proportion of nitrogen production and food consumption indicators at level Ⅳ decreased in 2017 compared with 1980, and the sum of the proportion of nitrogen environmental emissions and efficiency indicators at levels Ⅰ and Ⅱ also decreased. The reasons for these trends include the irrational use of nitrogen resources in crop-livestock systems, changes in planting and breeding structures, inadequate integration of agriculture and livestock husbandry, and uneven development of the economy and society. Therefore, based on the characteristics of the spatiotemporal changes of these different types of indicators, it is necessary to optimize the use of nitrogen to improve the nitrogen indicators by means of soil fertilization, changing the cultivation structure, applying nitrogen emission reduction technologies and policies, and promoting agricultural green development in China.
HTML全文
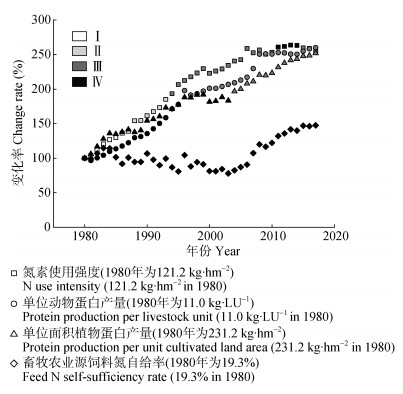
图11980—2017年中国农业绿色发展氮素生产类指标的时间变化
Figure1.Time variation of nitrogen production indicators of agricultural green development in China from 1980 to 2017
 下载: 全尺寸图片幻灯片
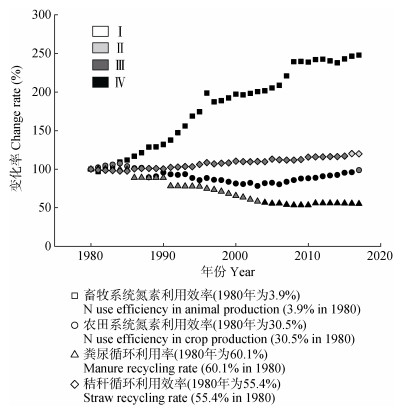
图21980—2017年中国农业绿色发展氮素利用效率类指标的时间变化
Figure2.Time variation of nitrogen utilization efficiency indicators of agricultural green development in China from 1980 to 2017
下载: 全尺寸图片幻灯片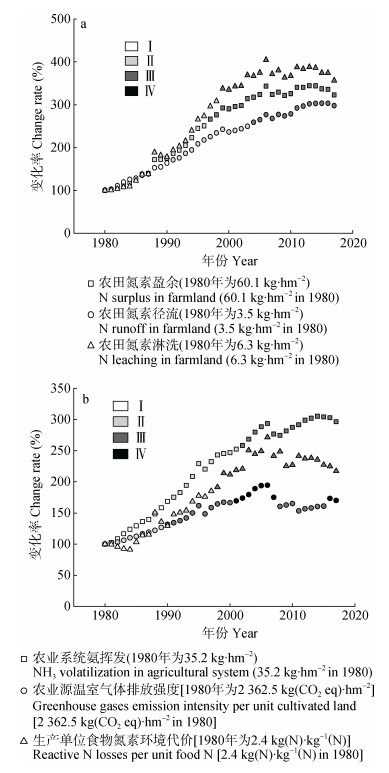
图31980—2017年中国农业绿色发展氮素环境排放类指标的时间变化
Figure3.Time variation of nitrogen environmental emission indicators of agriculture green development in China from 1980 to 2017
下载: 全尺寸图片幻灯片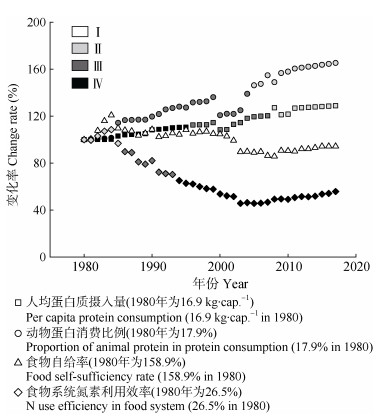
图41980—2017年中国农业绿色发展氮素食物消费类指标的时间变化
Figure4.Time variation of nitrogen food consumption indicators of agriculture green development in China from 1980 to 2017
下载: 全尺寸图片幻灯片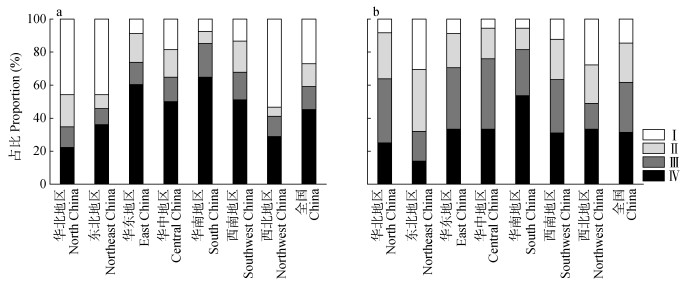
图51980年(a)和2017年(b)全国以及各地区农业绿色发展等级占比
Figure5.Proportions of agricultural green development levels in the whole country and each regional scales in 1980 (a) and 2017 (b) in China
下载: 全尺寸图片幻灯片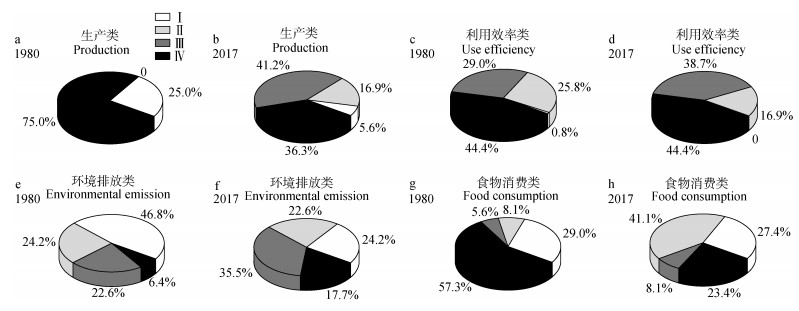
图61980年和2017年4类氮素指标农业绿色发展等级占比
Figure6.Proportion of agricultural green development levels of four ategories nitrogen indicators in China in 1980 and 2017
下载: 全尺寸图片幻灯片表1中国农业绿色发展相关氮素指标
Table1.Nitrogen indicators related to agriculture green development in China
| 分类 Category | 氮素指标 Nitrogen indicator | 计算方法 Calculation method | 数据来源文献 Data source reference | 分级标准 Grading standard | |||
| Ⅰ | Ⅱ | Ⅲ | Ⅳ | ||||
| 生产类 Production | 氮素使用强度 N use intensity (kg·hm–2) | 氮素总投入量/总播种面积 Total N input/total planting area | [23, 25] | < 180 | 180~225 | 225~315 | > 315 |
| 单位动物蛋白产量 Protein production per livestock unit (kg·LU–1) | 畜禽动物蛋白产量(肉、蛋、奶)/标准动物单位总数 Livestock and poultry protein production (meat, eggs, milk)/total number of standard animal units | [24, 27] | > 60 | 40~60 | 20~40 | < 20 | |
| 单位面积植物蛋白产量 Protein production per unit cultivated land (kg·hm–2) | 种植业植物蛋白产量/耕地面积 Planting plant protein yield/ cultivated area | [23, 25, 27] | > 1 125 | 750~1 125 | 450~750 | < 450 | |
| 畜牧农业源饲料氮自给率 Feed N self-sufficiency rate (%) | [17] | [24, 29] | > 80 | 65~80 | 50~65 | < 50 | |
| 利用效率类 Use efficiency | 畜牧系统氮素利用效率 N use efficiency in animal production (%) | [17] | [24, 27, 29] | > 19 | 15~19 | 10~15 | < 10 |
| 农田系统氮素利用效率 N use efficiency in crop production (%) | [17] | [17, 27] | > 70 | 50~70 | 30~50 | < 30 | |
| 粪尿循环利用率 Manure recycling rate (%) | [17] | [17, 24, 28] | > 75 | 55~75 | 35~55 | < 35 | |
| 秸秆循环利用效率 Straw recycling rate (%) | [17] | [17, 27] | > 80 | 65~80 | 50~65 | < 50 | |
| 环境排放类 Environmental emission | 农田氮素盈余 N surplus in farmland (kg·hm–2) | [17] | [17] | < 80 | 80~160 | 160~240 | > 240 |
| 农田氮素径流 N runoff in farmland (kg·hm–2) | [17] | [17] | < 6 | 6~9 | 9~18 | > 18 | |
| 农田氮素淋洗 N leaching in farmland (kg·hm–2) | [17] | [17] | < 10 | 10~20 | 20~30 | > 30 | |
| 农业系统氨挥发 NH3 volatilization in agricultural system (kg·hm–2) | [17] | [17] | < 60 | 60~90 | 90~120 | > 120 | |
| 农业源温室气体排放强度 Greenhouse gases emission intensity per unit cultivated land area [kg(CO2-eq)·hm–2] | [17] | [17] | < 2 000 | 2 000~3 000 | 3 000~4 000 | > 4 000 | |
| 生产单位食物氮素环境代价 Reactive N losses per unit food N [kg(N)·kg–1(N)] | 整个食物系统的活性氮损失总量/食物氮生产总量 Total active N loss/total food N production of food system | [17, 27] | < 3 | 3~4.5 | 4.5~6 | > 6 | |
| 食物消费类 Food consumption | 动物蛋白消费比例 Proportion of animal protein in protein consumption (%) | 动物性食品蛋白摄入量/总蛋白摄入量 Animal food protein intake/total protein intake | [17] | 30~35 | 25~30 35~40 | 20~25 40~45 | < 20 > 40 |
| 人均蛋白质摄入量 Per capita protein consumption (kg·cap.–1) | [17] | [17] | > 23.7 | 21.3~ 23.7 | 19~21.3 | < 19 | |
| 食物自给率 Food self-sufficiency rate (%) | 生产食物的氮素携出量/整个食物系统氮素投入量 N output from food production/ N input of food system | [17] | > 100 | 75~100 | 50~75 | < 50 | |
| 食物系统氮素利用效率 N use efficiency in food system (%) | [17] | [17, 23-24, 27] | > 30 | 25~30 | 18~25 | < 18 | |
| LU为livestock unit, 表示标准牛当量(折合500 kg奶牛), 不同动物的折换比例分别为:奶牛, 1:1;肉牛、水牛和黄牛、驴、骡、马, 0.8:1;猪, 0.3:1;羊, 0.1:1;蛋鸡, 0.014:1;肉鸡, 0.007:1;兔子, 0.002:1。LU is livestock unit, which means the standard cattle equivalent (equivalent to 500 kg cows). The conversion ratio of different animals is 1:1 for cows; 0.8:1 for beef cattle, buffalo and yellow cattle, donkeys, mules, horses; 0.3:1 for pig; 0.1:1 for sheep; 0.014:1 for layer; 0.007:1 for broiler; 0.002:1 for rabbit. | |||||||
下载: 导出CSV表21980年和2017年中国各省(市、自治区)农业绿色发展氮素生产类指标的变化
Table2.Variation of nitrogen production indicators of agricultural green development in different provinces (cities, autonomous regions) of China in 1980 and 2017
| 分区 Partition | 省(市、自治区) Province (city, autonomous region) | 氮素使用强度 N use intensity (kg·hm–2) | 单位动物蛋白产量 Protein production per livestock unit (kg·LU–1) | 单位面积植物蛋白产量 Protein production per unit cultivated land (kg·hm–2) | 畜牧农业源饲料氮自给率 Feed N self-sufficiency rate (%) | |||||||
| 1980 | 2017 | 1980 | 2017 | 1980 | 2017 | 1980 | 2017 | |||||
| 数值(级别) Value (level) | 数值(级别) Value (level) | 数值(级别) Value (level) | 数值(级别) Value (level) | 数值(级别) Value (level) | 数值(级别) Value (level) | 数值(级别) Value (level) | 数值(级别) Value (level) | |||||
| 华北地区 North China | 北京市Beijing | 145.0(Ⅰ) | 704.1(Ⅳ) | 19.7(Ⅳ) | 43.0(Ⅱ) | 327.4(Ⅳ) | 756.1(Ⅱ) | 13.8(Ⅳ) | 10.7(Ⅳ) | |||
| 天津市Tianjin | 74.4(Ⅰ) | 324.4(Ⅳ) | 16.5(Ⅳ) | 45.3(Ⅱ) | 204.2(Ⅳ) | 700.7(Ⅲ) | 26.6(Ⅳ) | 26.4(Ⅳ) | ||||
| 河北省Hebei | 101.3(Ⅰ) | 302.3(Ⅲ) | 10.8(Ⅳ) | 46.7(Ⅱ) | 206.1(Ⅳ) | 730.4(Ⅲ) | 31.9(Ⅳ) | 30.1(Ⅳ) | ||||
| 山西省Shanxi | 85.8(Ⅰ) | 205.2(Ⅱ) | 7.3(Ⅳ) | 44.5(Ⅱ) | 177.8(Ⅳ) | 522.7(Ⅲ) | 29.9(Ⅳ) | 58.6(Ⅲ) | ||||
| 东北地区 Northeast China | 内蒙古自治区 Inner-Mongolia | 48.1(Ⅰ) | 185.3(Ⅱ) | 8.3(Ⅳ) | 50.4(Ⅱ) | 90.8(Ⅳ) | 475.8(Ⅲ) | 5.1(Ⅳ) | 44.2(Ⅳ) | |||
| 辽宁省Liaoning | 148.7(Ⅰ) | 303.1(Ⅲ) | 17.5(Ⅳ) | 41.5(Ⅱ) | 350.0(Ⅳ) | 772.2(Ⅱ) | 35.8(Ⅳ) | 41.2(Ⅳ) | ||||
| 吉林省Jilin | 127.0(Ⅰ) | 272.3(Ⅲ) | 11.0(Ⅳ) | 42.6(Ⅱ) | 249.6(Ⅳ) | 829.8(Ⅱ) | 38.8(Ⅳ) | 112.9(Ⅰ) | ||||
| 黑龙江省Heilongjiang | 65.4(Ⅰ) | 151.7(Ⅰ) | 11.3(Ⅳ) | 53.0(Ⅱ) | 239.9(Ⅳ) | 597.1(Ⅲ) | 41.9(Ⅳ) | 104.1(Ⅰ) | ||||
| 华东地区 East China | 上海市Shanghai | 184.3(Ⅰ) | 312.6(Ⅲ) | 23.8(Ⅳ) | 36.0(Ⅲ) | 115.2(Ⅳ) | 520.3(Ⅲ) | 2.3(Ⅳ) | 10.8(Ⅳ) | |||
| 江苏省Jiangsu | 147.8(Ⅰ) | 313.0(Ⅲ) | 17.9(Ⅳ) | 33.0(Ⅲ) | 151.9(Ⅳ) | 674.4(Ⅲ) | 6.9(Ⅳ) | 20.3(Ⅳ) | ||||
| 浙江省Zhejiang | 148.4(Ⅰ) | 346.8(Ⅳ) | 15.6(Ⅳ) | 28.3(Ⅲ) | 85.1(Ⅳ) | 491.5(Ⅲ) | 4.8(Ⅳ) | 15.1(Ⅳ) | ||||
| 安徽省Anhui | 115.9(Ⅰ) | 244.9(Ⅲ) | 13.0(Ⅳ) | 32.1(Ⅲ) | 126.7(Ⅳ) | 621.2(Ⅲ) | 10.9(Ⅳ) | 22.7(Ⅳ) | ||||
| 福建省Fujian | 152.7(Ⅰ) | 487.1(Ⅳ) | 13.6(Ⅳ) | 28.3(Ⅲ) | 83.1(Ⅳ) | 508.7(Ⅲ) | 10.3(Ⅳ) | 7.5(Ⅳ) | ||||
| 江西省Jiangxi | 90.4(Ⅰ) | 184.3(Ⅱ) | 12.3(Ⅳ) | 25.2(Ⅲ) | 38.6(Ⅳ) | 436.9(Ⅳ) | 4.0(Ⅳ) | 11.3(Ⅳ) | ||||
| 山东省Shandong | 142.0(Ⅰ) | 281.9(Ⅲ) | 13.4(Ⅳ) | 38.8(Ⅲ) | 289.0(Ⅳ) | 843.6(Ⅱ) | 31.5(Ⅳ) | 30.0(Ⅳ) | ||||
| 华中地区 Central China | 河南省Henan | 106.2(Ⅰ) | 299.4(Ⅲ) | 8.0(Ⅳ) | 35.5(Ⅲ) | 236.1(Ⅳ) | 772.8(Ⅱ) | 24.3(Ⅳ) | 28.9(Ⅳ) | |||
| 湖北省Hubei | 120.8(Ⅰ) | 289.1(Ⅲ) | 13.6(Ⅳ) | 28.2(Ⅲ) | 96.8(Ⅳ) | 528.7(Ⅲ) | 6.2(Ⅳ) | 15.5(Ⅳ) | ||||
| 湖南省Hunan | 110.9(Ⅰ) | 241.7(Ⅲ) | 14.6(Ⅳ) | 23.5(Ⅲ) | 54.7(Ⅳ) | 465.9(Ⅲ) | 4.3(Ⅳ) | 11.2(Ⅳ) | ||||
| 华南地区 South China | 广东省Guangdong | 150.8(Ⅰ) | 419.7(Ⅳ) | 14.6(Ⅳ) | 23.9(Ⅲ) | 82.5(Ⅳ) | 496.6(Ⅲ) | 6.3(Ⅳ) | 10.3(Ⅳ) | |||
| 广西壮族自治区Guangxi | 109.6(Ⅰ) | 268.1(Ⅲ) | 10.4(Ⅳ) | 22.4(Ⅲ) | 76.4(Ⅳ) | 447.8(Ⅳ) | 5.8(Ⅳ) | 16.6(Ⅳ) | ||||
| 海南省Hainan | 150.8(Ⅰ) | 425.6(Ⅳ) | 14.6(Ⅳ) | 24.8(Ⅲ) | 82.5(Ⅳ) | 429.1(Ⅳ) | 6.3(Ⅳ) | 10.1(Ⅳ) | ||||
| 西南地区 Southwest China | 重庆市Chongqing | 131.0(Ⅰ) | 248.4(Ⅲ) | 12.2(Ⅳ) | 25.2(Ⅲ) | 169.3(Ⅳ) | 403.1(Ⅳ) | 9.8(Ⅳ) | 22.9(Ⅳ) | |||
| 四川省Sichuan | 131.0(Ⅰ) | 247.3(Ⅲ) | 12.2(Ⅳ) | 23.9(Ⅲ) | 169.3(Ⅳ) | 518.2(Ⅲ) | 9.8(Ⅳ) | 18.8(Ⅳ) | ||||
| 贵州省Guizhou | 128.4(Ⅰ) | 165.0(Ⅰ) | 5.6(Ⅳ) | 24.6(Ⅲ) | 150.2(Ⅳ) | 311.5(Ⅳ) | 9.3(Ⅳ) | 29.0(Ⅳ) | ||||
| 云南省Yunnan | 120.3(Ⅰ) | 278.1(Ⅲ) | 4.8(Ⅳ) | 27.2(Ⅲ) | 139.4(Ⅳ) | 389.3(Ⅳ) | 7.7(Ⅳ) | 24.0(Ⅳ) | ||||
| 西藏自治区Tibet | 26.6(Ⅰ) | 156.7(Ⅰ) | 4.5(Ⅳ) | 58.1(Ⅱ) | 134.7(Ⅳ) | 580.8(Ⅲ) | 0.1(Ⅳ) | 5.6(Ⅳ) | ||||
| 西北地区 Northwest China | 陕西省Shaanxi | 87.1(Ⅰ) | 367.7(Ⅳ) | 7.9(Ⅳ) | 39.4(Ⅲ) | 163.3(Ⅳ) | 513.7(Ⅲ) | 18.9(Ⅳ) | 40.3(Ⅳ) | |||
| 甘肃省Gansu | 58.6(Ⅰ) | 169.9(Ⅰ) | 5.2(Ⅳ) | 40.2(Ⅱ) | 148.0(Ⅳ) | 413.9(Ⅳ) | 6.7(Ⅳ) | 35.2(Ⅳ) | ||||
| 青海省Qinghai | 53.6(Ⅰ) | 129.8(Ⅰ) | 5.2(Ⅳ) | 70.1(Ⅰ) | 197.3(Ⅳ) | 341.9(Ⅳ) | 0.3(Ⅳ) | 4.8(Ⅳ) | ||||
| 宁夏回族自治区Ningxia | 77.5(Ⅰ) | 277.9(Ⅲ) | 5.1(Ⅳ) | 90.7(Ⅰ) | 110.3(Ⅳ) | 434.4(Ⅳ) | 6.7(Ⅳ) | 30.4(Ⅳ) | ||||
| 新疆维吾尔自治区 Xinjiang | 56.5(Ⅰ) | 262.8(Ⅲ) | 6.8(Ⅳ) | 45.5(Ⅱ) | 169.0(Ⅳ) | 424.0(Ⅳ) | 5.3(Ⅳ) | 25.6(Ⅳ) | ||||
下载: 导出CSV表31980年和2017年中国各省(市、自治区)农业绿色发展氮素利用效率类指标的变化
Table3.Variation of nitrogen utilization efficiency indicators of agricultural green development in different provinces (cities, autonomous regions) of China in 1980 and 2017
| 分区 Partition | 省(市、自治区) Province (city, autonomous region) | 畜牧系统氮素利用效率 N use efficiency in animal production (%) | 农田系统氮素利用效率 N use efficiency in crop production (%) | 粪尿循环利用率 Manure recycling rate (%) | 秸秆循环利用效率 Straw recycling rate (%) | |||||||
| 1980 | 2017 | 1980 | 2017 | 1980 | 2017 | 1980 | 2017 | |||||
| 数值(级别) Value (level) | 数值(级别) Value (level) | 数值(级别) Value (level) | 数值(级别) Value (level) | 数值(级别) Value (level) | 数值(级别) Value (level) | 数值(级别) Value (level) | 数值(级别) Value (level) | |||||
| 华北地区 North China | 北京市Beijing | 7.3(Ⅳ) | 12.4(Ⅲ) | 36.1(Ⅲ) | 17.2(Ⅳ) | 56.2(Ⅱ) | 33.5(Ⅳ) | 51.3(Ⅲ) | 71.1(Ⅱ) | |||
| 天津市Tianjin | 6.5(Ⅳ) | 13.4(Ⅲ) | 43.9(Ⅲ) | 34.6(Ⅲ) | 57.0(Ⅱ) | 35.0(Ⅲ) | 51.4(Ⅲ) | 68.3(Ⅱ) | ||||
| 河北省Hebei | 4.1(Ⅳ) | 12.5(Ⅲ) | 32.6(Ⅲ) | 38.7(Ⅲ) | 59.5(Ⅱ) | 31.9(Ⅳ) | 55.0(Ⅲ) | 71.2(Ⅱ) | ||||
| 山西省Shanxi | 2.8(Ⅳ) | 12.3(Ⅲ) | 33.2(Ⅲ) | 40.7(Ⅲ) | 61.2(Ⅱ) | 30.3(Ⅳ) | 54.5(Ⅲ) | 72.0(Ⅱ) | ||||
| 东北地区 Northeast China | 内蒙古自治区 Inner-Mongolia | 2.7(Ⅳ) | 8.8(Ⅳ) | 30.2(Ⅲ) | 41.1(Ⅲ) | 6.4(Ⅳ) | 4.4(Ⅳ) | 57.4(Ⅲ) | 70.6(Ⅱ) | |||
| 辽宁省Liaoning | 7.3(Ⅳ) | 14.1(Ⅲ) | 37.7(Ⅲ) | 40.8(Ⅲ) | 58.5(Ⅱ) | 31.7(Ⅳ) | 50.5(Ⅲ) | 70.5(Ⅱ) | ||||
| 吉林省Jilin | 4.5(Ⅳ) | 12.8(Ⅲ) | 31.5(Ⅲ) | 48.8(Ⅲ) | 60.8(Ⅱ) | 34.3(Ⅳ) | 52.1(Ⅲ) | 70.3(Ⅱ) | ||||
| 黑龙江省Heilongjiang | 4.1(Ⅳ) | 12.2(Ⅲ) | 58.7(Ⅱ) | 63.0(Ⅱ) | 60.1(Ⅱ) | 36.2(Ⅲ) | 53.7(Ⅲ) | 65.7(Ⅱ) | ||||
| 华东地区 East China | 上海市Shanghai | 8.6(Ⅳ) | 10.4(Ⅲ) | 10.0(Ⅳ) | 26.6(Ⅳ) | 54.9(Ⅲ) | 36.0(Ⅳ) | 46.6(Ⅳ) | 64.2(Ⅲ) | |||
| 江苏省Jiangsu | 6.0(Ⅳ) | 12.1(Ⅲ) | 16.5(Ⅳ) | 34.5(Ⅲ) | 56.3(Ⅱ) | 31.0(Ⅲ) | 59.9(Ⅲ) | 64.4(Ⅲ) | ||||
| 浙江省Zhejiang | 5.1(Ⅳ) | 10.1(Ⅲ) | 9.2(Ⅳ) | 22.7(Ⅳ) | 55.8(Ⅱ) | 32.9(Ⅳ) | 62.3(Ⅲ) | 64.6(Ⅲ) | ||||
| 安徽省Anhui | 4.6(Ⅳ) | 11.7(Ⅲ) | 17.5(Ⅳ) | 40.6(Ⅲ) | 60.0(Ⅱ) | 30.8(Ⅳ) | 69.5(Ⅱ) | 64.1(Ⅲ) | ||||
| 福建省Fujian | 4.9(Ⅳ) | 13.6(Ⅲ) | 8.7(Ⅳ) | 16.7(Ⅳ) | 58.6(Ⅱ) | 33.5(Ⅳ) | 67.7(Ⅱ) | 70.0(Ⅱ) | ||||
| 江西省Jiangxi | 4.3(Ⅳ) | 8.6(Ⅳ) | 6.8(Ⅳ) | 37.9(Ⅲ) | 59.1(Ⅱ) | 35.6(Ⅲ) | 56.9(Ⅲ) | 63.1(Ⅲ) | ||||
| 山东省Shandong | 5.4(Ⅳ) | 13.6(Ⅲ) | 32.6(Ⅲ) | 47.9(Ⅲ) | 58.4(Ⅱ) | 31.4(Ⅳ) | 64.4(Ⅲ) | 70.1(Ⅱ) | ||||
| 华中地区 Central China | 河南省Henan | 3.0(Ⅳ) | 11.2(Ⅲ) | 35.6(Ⅲ) | 41.3(Ⅲ) | 61.6(Ⅱ) | 31.5(Ⅳ) | 63.6(Ⅲ) | 69.4(Ⅱ) | |||
| 湖北省Hubei | 5.0(Ⅳ) | 9.3(Ⅳ) | 12.8(Ⅳ) | 29.3(Ⅳ) | 59.2(Ⅱ) | 33.4(Ⅳ) | 59.3(Ⅲ) | 63.8(Ⅲ) | ||||
| 湖南省Hunan | 5.3(Ⅳ) | 7.4(Ⅳ) | 7.9(Ⅳ) | 30.8(Ⅲ) | 58.0(Ⅱ) | 34.2(Ⅳ) | 64.2(Ⅲ) | 63.8(Ⅲ) | ||||
| 华南地区 South China | 广东省Guangdong | 5.9(Ⅳ) | 10.0(Ⅳ) | 8.8(Ⅳ) | 18.9(Ⅳ) | 60.2(Ⅱ) | 35.0(Ⅲ) | 61.3(Ⅲ) | 54.4(Ⅲ) | |||
| 广西壮族自治区Guangxi | 4.1(Ⅳ) | 8.6(Ⅳ) | 11.2(Ⅳ) | 26.7(Ⅳ) | 61.9(Ⅱ) | 35.7(Ⅲ) | 52.7(Ⅲ) | 36.0(Ⅳ) | ||||
| 海南省Hainan | 5.9(Ⅳ) | 9.6(Ⅳ) | 8.8(Ⅳ) | 16.1(Ⅳ) | 60.2(Ⅱ) | 34.7(Ⅳ) | 61.3(Ⅲ) | 56.7(Ⅲ) | ||||
| 西南地区 Southwest China | 重庆市Chongqing | 4.3(Ⅳ) | 8.6(Ⅳ) | 20.7(Ⅳ) | 26.0(Ⅳ) | 59.4(Ⅱ) | 32.9(Ⅳ) | 68.3(Ⅱ) | 74.9(Ⅱ) | |||
| 四川省Sichuan | 4.3(Ⅳ) | 7.9(Ⅳ) | 20.7(Ⅳ) | 33.5(Ⅲ) | 59.4(Ⅱ) | 33.7(Ⅳ) | 68.3(Ⅱ) | 70.0(Ⅱ) | ||||
| 贵州省Guizhou | 2.0(Ⅳ) | 7.0(Ⅳ) | 18.7(Ⅳ) | 30.2(Ⅲ) | 62.3(Ⅱ) | 36.1(Ⅲ) | 58.8(Ⅲ) | 72.6(Ⅱ) | ||||
| 云南省Yunnan | 1.7(Ⅳ) | 7.4(Ⅳ) | 18.5(Ⅳ) | 22.4(Ⅳ) | 62.8(Ⅱ) | 35.1(Ⅲ) | 57.5(Ⅲ) | 59.9(Ⅲ) | ||||
| 西藏自治区Tibet | 1.5(Ⅳ) | 7.8(Ⅳ) | 81.0(Ⅰ) | 59.3(Ⅱ) | 0.3(Ⅳ) | 0.2(Ⅳ) | 50.0(Ⅳ) | 71.1(Ⅱ) | ||||
| 西北地区 Northwest China | 陕西省Shaanxi | 2.9(Ⅳ) | 10.0(Ⅲ) | 30.0(Ⅳ) | 22.4(Ⅳ) | 60.7(Ⅱ) | 32.0(Ⅳ) | 57.5(Ⅲ) | 71.4(Ⅱ) | |||
| 甘肃省Gansu | 2.0(Ⅳ) | 7.7(Ⅳ) | 40.4(Ⅲ) | 39.0(Ⅲ) | 17.5(Ⅳ) | 15.5(Ⅳ) | 63.4(Ⅲ) | 75.5(Ⅱ) | ||||
| 青海省Qinghai | 1.8(Ⅳ) | 8.5(Ⅳ) | 58.9(Ⅱ) | 42.2(Ⅲ) | 1.1(Ⅳ) | 0.4(Ⅳ) | 69.4(Ⅱ) | 72.8(Ⅱ) | ||||
| 宁夏回族自治区Ningxia | 2.2(Ⅳ) | 12.5(Ⅲ) | 22.8(Ⅳ) | 25.0(Ⅳ) | 63.2(Ⅱ) | 33.0(Ⅳ) | 63.4(Ⅲ) | 73.6(Ⅱ) | ||||
| 新疆维吾尔自治区 Xinjiang | 2.3(Ⅳ) | 7.5(Ⅳ) | 47.8(Ⅲ) | 25.8(Ⅳ) | 1.7(Ⅳ) | 3.8(Ⅳ) | 50.6(Ⅲ) | 47.2(Ⅳ) | ||||
下载: 导出CSV表41980年和2017年中国各省(市、自治区)农业绿色发展氮素环境排放类指标的变化
Table4.Variation of nitrogen environmental emission indicators of agricultural green development in different provinces (cities, autonomous regions) of China in 1980 and 2017
 |
表51980年和2017年中国各省(市、自治区)农业绿色发展氮素食物消费类指标的变化
Table5.Variation of nitrogen food consumption indicators of agricultural green development in various province (cities, autonomous regions) of China in 1980 and 2017
| 分区 Partition | 省(市、自治区) Province (city, autonomous region) | 人均蛋白质摄入量 Per capita protein consumption (kg·cap.–1) | 动物蛋白消费比例 Proportion of animal protein in protein consumption (%) | 食物自给率 Food self-sufficiency rate (%) | 食物系统氮素利用效率 N use efficiency in food system (%) | |||||||
| 1980 | 2017 | 1980 | 2017 | 1980 | 2017 | 1980 | 2017 | |||||
| 数值(级别) Value (level) | 数值(级别) Value (level) | 数值(级别) Value (level) | 数值(级别) Value (level) | 数值(级别) Value (level) | 数值(级别) Value (level) | 数值(级别) Value (level) | 数值(级别) Value (level) | |||||
| 华北地区 North China | 北京市Beijing | 16.3(Ⅳ) | 23.1(Ⅱ) | 20.8(Ⅲ) | 32.5(Ⅰ) | 124.0(Ⅰ) | 15.2(Ⅳ) | 29.4(Ⅱ) | 7.1(Ⅳ) | |||
| 天津市Tianjin | 16.4(Ⅳ) | 22.9(Ⅱ) | 20.3(Ⅲ) | 32.2(Ⅰ) | 87.8(Ⅱ) | 46.1(Ⅳ) | 33.1(Ⅰ) | 14.3(Ⅳ) | ||||
| 河北省Hebei | 17.0(Ⅳ) | 21.6(Ⅱ) | 17.3(Ⅳ) | 29.1(Ⅱ) | 156.8(Ⅰ) | 183.4(Ⅰ) | 24.1(Ⅲ) | 19.2(Ⅲ) | ||||
| 山西省Shanxi | 16.9(Ⅳ) | 21.7(Ⅱ) | 17.9(Ⅳ) | 29.4(Ⅱ) | 140.3(Ⅰ) | 82.3(Ⅱ) | 29.4(Ⅱ) | 15.9(Ⅳ) | ||||
| 东北地区 Northeast China | 内蒙古自治区 Inner Mongolia | 16.8(Ⅳ) | 21.9(Ⅱ) | 18.1(Ⅳ) | 29.9(Ⅱ) | 114.3(Ⅰ) | 216.8(Ⅰ) | 12.1(Ⅳ) | 10.9(Ⅳ) | |||
| 辽宁省Liaoning | 16.6(Ⅳ) | 22.2(Ⅱ) | 19.1(Ⅳ) | 30.5(Ⅰ) | 178.7(Ⅰ) | 133.7(Ⅰ) | 34.9(Ⅰ) | 17.0(Ⅳ) | ||||
| 吉林省Jilin | 16.6(Ⅳ) | 21.7(Ⅱ) | 19.3(Ⅳ) | 29.3(Ⅱ) | 191.5(Ⅰ) | 192.0(Ⅰ) | 26.9(Ⅱ) | 17.8(Ⅳ) | ||||
| 黑龙江省Heilongjiang | 16.6(Ⅳ) | 21.8(Ⅱ) | 19.3(Ⅳ) | 29.6(Ⅱ) | 239.9(Ⅰ) | 341.0(Ⅰ) | 54.0(Ⅰ) | 39.8(Ⅰ) | ||||
| 华东地区 Eastern China | 上海市Shanghai | 16.2(Ⅳ) | 23.2(Ⅱ) | 21.0(Ⅲ) | 32.7(Ⅰ) | 47.3(Ⅳ) | 18.9(Ⅳ) | 7.8(Ⅳ) | 10.4(Ⅳ) | |||
| 江苏省Jiangsu | 16.9(Ⅳ) | 22.2(Ⅱ) | 17.6(Ⅳ) | 30.7(Ⅰ) | 108.1(Ⅰ) | 171.0(Ⅰ) | 12.9(Ⅳ) | 22.6(Ⅲ) | ||||
| 浙江省Zhejiang | 17.0(Ⅳ) | 22.2(Ⅱ) | 17.4(Ⅳ) | 30.6(Ⅰ) | 46.2(Ⅳ) | 48.4(Ⅳ) | 6.0(Ⅳ) | 12.4(Ⅳ) | ||||
| 安徽省Anhui | 17.0(Ⅳ) | 21.5(Ⅱ) | 17.4(Ⅳ) | 28.9(Ⅱ) | 79.4(Ⅱ) | 225.4(Ⅰ) | 11.4(Ⅳ) | 25.6(Ⅱ) | ||||
| 福建省Fujian | 16.9(Ⅳ) | 22.0(Ⅱ) | 17.9(Ⅳ) | 30.2(Ⅰ) | 35.0(Ⅳ) | 83.5(Ⅱ) | 5.4(Ⅳ) | 12.6(Ⅳ) | ||||
| 江西省Jiangxi | 16.9(Ⅳ) | 21.6(Ⅱ) | 17.8(Ⅳ) | 29.0(Ⅱ) | 32.7(Ⅳ) | 166.9(Ⅰ) | 4.8(Ⅳ) | 25.2(Ⅱ) | ||||
| 山东省Shandong | 17.0(Ⅳ) | 21.8(Ⅱ) | 17.1(Ⅳ) | 29.7(Ⅱ) | 165.2(Ⅰ) | 207.1(Ⅰ) | 26.1(Ⅱ) | 24.1(Ⅲ) | ||||
| 华中地区 Central China | 河南省Henan | 17.0(Ⅳ) | 21.3(Ⅱ) | 17.5(Ⅳ) | 28.5(Ⅱ) | 145.2(Ⅰ) | 259.5(Ⅰ) | 29.1(Ⅱ) | 21.4(Ⅲ) | |||
| 湖北省Hubei | 16.9(Ⅳ) | 21.8(Ⅱ) | 17.7(Ⅳ) | 29.6(Ⅱ) | 76.1(Ⅱ) | 183.4(Ⅰ) | 9.8(Ⅳ) | 16.6(Ⅳ) | ||||
| 湖南省Hunan | 17.0(Ⅳ) | 21.6(Ⅱ) | 17.4(Ⅳ) | 29.0(Ⅱ) | 46.5(Ⅳ) | 163.5(Ⅰ) | 6.3(Ⅳ) | 17.9(Ⅳ) | ||||
| 华南地区 South China | 广东省Guangdong | 16.9(Ⅳ) | 22.3(Ⅱ) | 17.7(Ⅳ) | 30.8(Ⅰ) | 43.3(Ⅳ) | 57.0(Ⅲ) | 5.5(Ⅳ) | 10.9(Ⅳ) | |||
| 广西壮族自治区Guangxi | 17.0(Ⅳ) | 21.3(Ⅱ) | 17.3(Ⅳ) | 28.4(Ⅱ) | 46.3(Ⅳ) | 134.4(Ⅰ) | 7.1(Ⅳ) | 13.4(Ⅳ) | ||||
| 海南省Hainan | 16.9(Ⅳ) | 21.7(Ⅱ) | 17.7(Ⅳ) | 29.4(Ⅱ) | 43.3(Ⅳ) | 107.7(Ⅰ) | 5.5(Ⅳ) | 10.5(Ⅳ) | ||||
| 西南地区 Southwest China | 重庆市Chongqing | 17.0(Ⅳ) | 22.0(Ⅱ) | 17.1(Ⅳ) | 30.1(Ⅰ) | 133.4(Ⅰ) | 103.6(Ⅰ) | 15.7(Ⅳ) | 13.1(Ⅳ) | |||
| 四川省Sichuan | 17.0(Ⅳ) | 21.4(Ⅱ) | 17.1(Ⅳ) | 28.6(Ⅱ) | 133.4(Ⅰ) | 134.2(Ⅰ) | 15.7(Ⅳ) | 14.6(Ⅳ) | ||||
| 贵州省Guizhou | 16.9(Ⅳ) | 21.1(Ⅲ) | 17.9(Ⅳ) | 28.0(Ⅱ) | 65.5(Ⅲ) | 95.5(Ⅱ) | 11.6(Ⅳ) | 12.5(Ⅳ) | ||||
| 云南省Yunnan | 17.0(Ⅳ) | 21.2(Ⅲ) | 17.4(Ⅳ) | 28.1(Ⅱ) | 77.8(Ⅱ) | 105.8(Ⅰ) | 12.1(Ⅳ) | 8.8(Ⅳ) | ||||
| 西藏自治区Tibet | 17.0(Ⅳ) | 20.4(Ⅲ) | 17.4(Ⅳ) | 26.1(Ⅱ) | 126.2(Ⅰ) | 172.7(Ⅰ) | 3.2(Ⅳ) | 10.9(Ⅳ) | ||||
| 西北地区 Northwest China | 陕西省Shaanxi | 16.9(Ⅳ) | 21.7(Ⅱ) | 17.8(Ⅳ) | 29.3(Ⅱ) | 130.6(Ⅰ) | 110.7(Ⅰ) | 24.2(Ⅲ) | 10.7(Ⅳ) | |||
| 甘肃省Gansu | 16.9(Ⅳ) | 21.2(Ⅲ) | 17.5(Ⅳ) | 28.1(Ⅱ) | 126.5(Ⅰ) | 106.5(Ⅰ) | 22.6(Ⅲ) | 13.8(Ⅳ) | ||||
| 青海省Qinghai | 16.9(Ⅳ) | 21.5(Ⅱ) | 17.9(Ⅳ) | 28.9(Ⅱ) | 144.0(Ⅰ) | 105.2(Ⅰ) | 6.3(Ⅳ) | 11.0(Ⅳ) | ||||
| 宁夏回族自治区Ningxia | 16.9(Ⅳ) | 21.7(Ⅱ) | 17.8(Ⅳ) | 29.4(Ⅱ) | 125.1(Ⅰ) | 166.9(Ⅰ) | 18.2(Ⅲ) | 12.7(Ⅳ) | ||||
| 新疆维吾尔自治区Xinjiang | 16.7(Ⅳ) | 21.3(Ⅱ) | 18.6(Ⅳ) | 28.4(Ⅱ) | 189.6(Ⅰ) | 214.5(Ⅰ) | 21.5(Ⅲ) | 10.5(Ⅳ) | ||||
下载: 导出CSV参考文献
| [1] | 马文奇, 张福锁, 陈新平.中国养分资源综合管理研究的意义与重点[J].科技导报, 2006, 24(10):64-67 http://www.wanfangdata.com.cn/details/detail.do?_type=perio&id=kjdb200610015 MA W Q, ZHANG F S, CHEN X P. Significance and keystone of research of integrated nutrient resource management in China[J]. Science & Technology Review, 2006, 24(10):64-67 http://www.wanfangdata.com.cn/details/detail.do?_type=perio&id=kjdb200610015 |
| [2] | FALKOWSKI P, SCHOLES R J, BOYLE E, et al. The global carbon cycle:A test of our knowledge of earth as a system[J]. Science, 2000, 290(5490):291-296 https://pubmed.ncbi.nlm.nih.gov/11030643/ |
| [3] | GALLOWAY J N, DENTENER F J, CAPONE D G, et al. Nitrogen cycles:Past, present, and future[J]. Biogeochemistry, 2004, 70:153-226 http://www.bioone.org/servlet/linkout?suffix=i1551-5028-63-1-109-Galloway1&dbid=16&doi=10.2111%2F08-255.1&key=10.1007%2Fs10533-004-0370-0 |
| [4] | 马文奇, 马林, 张建杰, 等.农业绿色发展理论框架和实现路径的思考[J].中国生态农业学报(中英文), 2020, DOI: 10.13930/j.cnki.cjea.200238 MA W Q, MA L, ZHANG J J, et al. Theoretical framework and realization pathway of agricultural green development[J]. Chinese Journal of Eco-Agriculture, 2020, DOI: 10.13930/j.cnki.cjea.200238 |
| [5] | LIU X J, ZHANG Y, HAN W X, et al. Enhanced nitrogen deposition over China[J]. Nature, 2013, 494(7438):459-462 http://www.wanfangdata.com.cn/details/detail.do?_type=perio&id=4a5bb880fec5fdecfebdbcfe1691c9a1 |
| [6] | FOWLER D, COYLE M, SKIBA U, et al. The global nitrogen cycle in the twenty-first century[J]. Philosophical Transactions of the Royal Society B:Biological Sciences, 2013, 368(1621):20130165 |
| [7] | GAO Z L, MA W Q, ZHU G D, et al. Estimating farm-gate ammonia emissions from major animal production systems in China[J]. Atmospheric Environment, 2013, 79:20-28 http://www.wanfangdata.com.cn/details/detail.do?_type=perio&id=60d643c07203d1722135cfce7e29441c |
| [8] | 郭四代, 张华, 郭杰, 等.基于空间计量模型的中国环境污染评价及影响因素分析[J].生态学杂志, 2018, 37(2):471-481 http://www.wanfangdata.com.cn/details/detail.do?_type=perio&id=stxzz201802023 GUO S D, ZHANG H, GUO J, et al. Evaluation and impact factors of environmental pollution of China based on spatial metric model[J]. Chinese Journal of Ecology, 2018, 37(2):471-481 http://www.wanfangdata.com.cn/details/detail.do?_type=perio&id=stxzz201802023 |
| [9] | United Nations. Transforming Our World: The 2030 Agenda for Sustainable Development[R]. New York: United Nations, Department of Economic and Social Affairs, 2015: 1-41 http://ethics.iit.edu/eelibrary/node/17947 |
| [10] | SUTTON M A, HOWARD C M, ERISMAN J W, et al. The European Nitrogen Assessment:Sources, Effects and Policy Perspectives[M]. Cambridge:Cambridge University Press, 2011 |
| [11] | TOMICH T P, BRODT S B, DAHLGREN R A, et al. The California Nitrogen Assessment:Challenges and Solutions for People, Agriculture, and the Environment[M]. Oakland:University of California Press, 2016 |
| [12] | ABROL Y P, ADHYA T K, ANEJA V P, et al. The Indian Nitrogen Assessment:Sources of Reactive Nitrogen, Environmental and Climate Effects, Management Options, and policies[M]. Duxford, UK:Elsevier, 2017 |
| [13] | STEFFEN W, RICHARDSON K, ROCKSTR?M J, et al. Planetary boundaries:Guiding human development on a changing planet[J]. Science, 2015, 347(6223):1259855 https://pubmed.ncbi.nlm.nih.gov/25592418/ |
| [14] | CUI S H, SHI Y L, GROFFMAN P M, et al. Centennial-scale analysis of the creation and fate of reactive nitrogen in China (1910-2010)[J]. Proceedings of the National Academy of Sciences of the United States of America, 2013, 110(6):2052-2057 http://www.wanfangdata.com.cn/details/detail.do?_type=perio&id=cbccb3a88f13e79b5120022e903de946 |
| [15] | GU B J, JU X T, CHANG J, et al. Integrated reactive nitrogen budgets and future trends in China[J]. Proceedings of the National Academy of Sciences of the United States of America, 2015, 112(28):8792-8797 http://www.wanfangdata.com.cn/details/detail.do?_type=perio&id=fb75d378382035b7ab82d71b6384a648 |
| [16] | GU B J, JU X T, CHANG S X, et al. Nitrogen use efficiencies in Chinese agricultural systems and implications for food security and environmental protection[J]. Regional Environmental Change, 2017, 17(4):1217-1227 http://www.wanfangdata.com.cn/details/detail.do?_type=perio&id=5740c2ae73dabefff4767e4012d509df |
| [17] | MA L, VELTHOF G L, WANG F H, et al. Nitrogen and phosphorus use efficiencies and losses in the food chain in China at regional scales in 1980 and 2005[J]. Science of the Total Environment, 2012, 434:51-61 http://www.wanfangdata.com.cn/details/detail.do?_type=perio&id=52a0e4951e056a2a7262070d88ae8064 |
| [18] | WANG M R, MA L, STROKAL M, et al. Hotspots for nitrogen and phosphorus losses from food production in China:A county-scale analysis[J]. Environmental Science & Technology, 2018, 52(10):5782-5791 |
| [19] | BAI Z H, MA W Q, MA L, et al. China's livestock transition:Driving forces, impacts, and consequences[J]. Science Advances, 2018, 4(7):eaar8534 |
| [20] | 张建杰, 崔石磊, 马林, 等.中国农业绿色发展指标体系的构建与例证[J].中国生态农业学报(中英文), 2020, DOI: 10.13930/j.cnki.cjea.200069 ZHANG J J, CUI S L, MA L, et al. Construction of a green development index system for agriculture in China and examples http://www.ecoagri.ac.cn/zgstny/ch/reader/view_abstract.aspx?file_no=2020-0802&flag=1 |
| [21] | KANTER D R, WINIWARTER W, BODIRSKY B L, et al. A framework for nitrogen futures in the shared socioeconomic pathways[J]. Global Environmental Change, 2020, 61:102029 |
| [22] | 王海宾, 陈晓文, 于婧. DPSIR框架研究综述[J].经济研究导刊, 2013(19):4-5 http://www.wanfangdata.com.cn/details/detail.do?_type=perio&id=CASS_46540543 WANG H B, CHEN X W, YU J. Research review of DPSIR framework[J]. Economic Research Guide, 2013(19):4-5 http://www.wanfangdata.com.cn/details/detail.do?_type=perio&id=CASS_46540543 |
| [23] | 中华人民共和国国家统计局.中国统计年鉴[M].北京: 中国统计出版社, 1980-2017 National Bureau of Statistics of the People's Republic of China. China Statistical Yearbook[M]. Beijing: China Statistics Press, 1980-2017 |
| [24] | 中国畜牧兽医年鉴编辑委员会.中国畜牧兽医年鉴[M].北京: 中国农业出版社, 1985-2017 Editorial Committee of China Animal Husbandry and Veterinary Yearbook. China Animal Husbandry and Veterinary Yearbook[M]. Beijing: China Agriculture Press, 1985-2017 |
| [25] | 国家统计局农村社会经济调查司.中国农村统计年鉴[M].北京: 中国统计出版社, 1985-2017 Department of Rural Socio Economic Investigation, National Bureau of Statistics. China Rural Statistical Yearbook[M]. Beijing: China Statistics Press, 1985-2017 |
| [26] | 中华人民共和国农业部.中国农业统计资料[M].北京: 中国农业出版社, 1985-2017 Ministry of Agriculture of the People's Republic of China. Chinese Agricultural Statistics[M]. Beijing: China Agriculture Press, 1985-2017 |
| [27] | 中华人民共和国国家统计局.全国年度数据[DB/OL]. 1980-2017. http://data.stats.gov.cn/easyquery.htm?cn=E0103 National Bureau of Statistics of the People's Republic of China. National Annual Data[DB/OL]. 1980-2017. http://data.stats.gov.cn/easyquery.htm?cn=E0103 |
| [28] | MA L, MA W Q, VELTHOF G L, et al. Modeling nutrient flows in the food chain of China[J]. Journal of Environmental Quality, 2010, 39(4):1279-1289 http://www.wanfangdata.com.cn/details/detail.do?_type=perio&id=c6f1ff96561c98178eb17e3a1642596b |
| [29] | MA L, GUO J H, VELTHOF G L, et al. Impacts of urban expansion on nitrogen and phosphorus flows in the food system of Beijing from 1978 to 2008[J]. Global Environmental Change, 2014, 28:192-204 http://www.wanfangdata.com.cn/details/detail.do?_type=perio&id=0eb65f6bf45a333037ce47b816e3c610 |
| [30] | 赵济.中国自然地理[M].北京:中国高等教育出版社, 1995 ZHAO J. Physical Geography of China[M]. Beijing:China Higher Education Press, 1995 |
| [31] | CHEN X P, CUI Z L, FAN M S, et al. Producing more grain with lower environmental costs[J]. Nature, 2014, 514(7523):486-489 http://www.wanfangdata.com.cn/details/detail.do?_type=perio&id=67fc2836d8c52a208185a33261351ef8 |
| [32] | 李昊旻.中国畜牧养殖污染的生态环境胁迫效应分析[D].长沙: 湖南农业大学, 2013 http://cdmd.cnki.com.cn/article/cdmd-10537-1014182898.htm LI H M. Analysis of stress effects of livestock manure pollution on eco-environment in China[D]. Changsha: Hunan Agricultural University, 2013 http://cdmd.cnki.com.cn/article/cdmd-10537-1014182898.htm |
| [33] | 胡焕庸.中国人口地域分布[J].科学, 2015, 67(1):3-4 http://www.cnki.com.cn/Article/CJFDTotal-KXZZ201501002.htm HU H Y. China's population is geographically distributed[J]. Science, 2015, 67(1):3-4 http://www.cnki.com.cn/Article/CJFDTotal-KXZZ201501002.htm |
| [34] | 马林, 魏静, 王方浩, 等.中国食物链氮素资源流动特征分析[J].自然资源学报, 2009, 24(12):2104-2114 http://www.wanfangdata.com.cn/details/detail.do?_type=perio&id=zrzyxb200912008 MA L, WEI J, WANG F H, et al. Analysis on the feature of nitrogen flow from food chain perspective in China[J]. Journal of Natural Resources, 2009, 24(12):2104-2114 http://www.wanfangdata.com.cn/details/detail.do?_type=perio&id=zrzyxb200912008 |
| [35] | 佟丙辛, 张华芳, 高肖贤, 等.华北平原典型区域农牧系统氮素流动及其环境效应——以河北省为例[J].中国农业科学, 2018, 51(3):442-455 http://www.wanfangdata.com.cn/details/detail.do?_type=perio&id=zgnykx201803005 TONG B X, ZHANG H F, GAO X X, et al. Nitrogen flow and environmental effects of crop-livestock system in typical area of North China Plain-A case study in Hebei Province[J]. Scientia Agricultura Sinica, 2018, 51(3):442-455 http://www.wanfangdata.com.cn/details/detail.do?_type=perio&id=zgnykx201803005 |
| [36] | JARVIS S, HUTCHINGS N, BRENTRUP F, et al. Nitrogen flows in farming systems across Europe[M]//SUTTON M A. The European Nitrogen Assessment: Sources, Effects and Policy Perspectives. Cambridge, UK: Cambridge University Press, 2011: 211-227 |
| [37] | 王月宁, 冯朋博, 侯贤清, 等.秸秆还田的土壤环境效应及研究进展[J].北方园艺, 2019, (17):140-144 http://www.wanfangdata.com.cn/details/detail.do?_type=perio&id=bfyany201917021 WANG Y N, FENG P B, HOU X Q, et al. Soil environmental effects and research progress of straw returning to field[J]. Northern Horticulture, 2019, (17):140-144 http://www.wanfangdata.com.cn/details/detail.do?_type=perio&id=bfyany201917021 |
| [38] | DE KLEIN C A M, MONAGHAN R M, ALFARO M, et al. Nitrogen performance indicators for dairy production systems[J]. Soil Research, 2017, 55(6):479-488 http://www.wanfangdata.com.cn/details/detail.do?_type=perio&id=0a6ca554638b1f859a9abb6f43f47bb3 |
| [39] | SUN B, SHEN R P, BOUWMAN A F. Surface N balances in agricultural crop production systems in China for the period 1980-2015[J]. Pedosphere, 2008, 18(3):304-315 http://www.cnki.com.cn/Article/CJFDTotal-TRQY200803004.htm |
| [40] | ZHANG C, JU X T, POWLSON D S, et al. Nitrogen surplus benchmarks for controlling N pollution in the main cropping systems of China[J]. Environmental Science & Technology, 2019, 53(12):6678-6687 https://www.zhangqiaokeyan.com/academic-journal-foreign_other_thesis/0204113066150.html |
| [41] | 魏琦, 张斌, 金书秦.中国农业绿色发展指数构建及区域比较研究[J].农业经济问题, 2018, (11):11-20 http://www.wanfangdata.com.cn/details/detail.do?_type=perio&id=nyjjwt201811002 WEI Q, ZHANG B, JIN S Q. A study on construction and regional comparison of agricultural green development index in China[J]. Issues in Agricultural Economy, 2018, (11):11-20 http://www.wanfangdata.com.cn/details/detail.do?_type=perio&id=nyjjwt201811002 |
| [42] | 闵继胜, 胡浩.中国农业生产温室气体排放量的测算[J].中国人口?资源与环境, 2012, 22(7):21-27 http://www.wanfangdata.com.cn/details/detail.do?_type=perio&id=zgrkzyyhj201207004 MIN J S, HU H. Calculation of greenhouse gases emission from agricultural production in China[J]. China Population, Resources and Environment, 2012, 22(7):21-27 http://www.wanfangdata.com.cn/details/detail.do?_type=perio&id=zgrkzyyhj201207004 |
| [43] | 郭孟楚.中国膳食结构变化对食物链氮素流动的影响及优化途径[D].北京: 中国农业大学, 2018 https://kns.cnki.net/KCMS/detail/detail.aspx?dbcode=CDFD&dbname=CDFD&filename=1018064542.nh GUO M C. Impact of diet change on nitrogen flows in the food chain and optimization strategies in China[D]. Beijing: China Agricultural University, 2018 https://kns.cnki.net/KCMS/detail/detail.aspx?dbcode=CDFD&dbname=CDFD&filename=1018064542.nh |
| [44] | 中国营养学会.中国居民膳食营养素参考摄入量[M].北京:中国轻工业出版社, 2006 Chinese Nutrition Society. Chinese Dietary Reference Intakes[M]. Beijing:China Light Industry Press, 2006 |
| [45] | HOU Y, MA L, GAO Z L, et al. The driving forces for nitrogen and phosphorus flows in the food chain of China, 1980 to 2010[J]. Journal of Environmental Quality, 2013, 42(4):962-971 http://www.wanfangdata.com.cn/details/detail.do?_type=perio&id=3dd93846d32d9fb2eb2f455e1e1bc6c8 |
| [46] | 郭迷.中国农业绿色发展指标体系构建及评价研究[D].北京: 北京林业大学, 2011 http://cdmd.cnki.com.cn/Article/CDMD-10022-1011134902.htm GUO M. Research of agricultural green development and a preliminary study on the evaluation system[D]. Beijing: Beijing Forestry University, 2011 http://cdmd.cnki.com.cn/Article/CDMD-10022-1011134902.htm |
| [47] | 喻朝庆.水-氮耦合机制下的中国粮食与环境安全[J].中国科学:地球科学, 2019, 49(12):2018-2036 http://www.wanfangdata.com.cn/details/detail.do?_type=perio&id=zgkx-cd201912010 YU C Q. Food and environmental security in China under the water-nitrogen coupling mechanism[J]. Scientia Sinica:Terrae, 2019, 49(12):2018-2036 http://www.wanfangdata.com.cn/details/detail.do?_type=perio&id=zgkx-cd201912010 |
| [48] | CHEN X H, MA L, MA W Q, et al. What has caused the use of fertilizers to skyrocket in China?[J]. Nutrient Cycling in Agroecosystems, 2018, 110(2):241-255 doi: 10.1007/s10705-017-9895-1 |
| [49] | 张福锁.测土配方施肥技术[M].北京:中国农业大学出版社, 2011:3-22 ZHANG F S. Soil Testing and Fertilization Recommendation[M]. Beijing:China Agricultural University Press, 2011:3-22 |
| [50] | 张福锁, 马文奇, 陈新平, 等.养分资源综合管理理论与技术概论[M].北京:中国农业大学出版社, 2006 ZHANG F S, MA W Q, CHEN X P, et al. Introduction to the Theory and Technology of Integrated Management of Nutrient Resources[M]. Beijing:China Agricultural University Press, 2006 |
| [51] | 高强, 孔祥智.中国农业结构调整的总体估价与趋势判断[J].改革, 2014, (11):80-91 http://www.wanfangdata.com.cn/details/detail.do?_type=perio&id=662850367 GAO Q, KONG X Z. Overall evaluation and the trend of China's agricultural structure adjustment[J]. Reform, 2014, (11):80-91 http://www.wanfangdata.com.cn/details/detail.do?_type=perio&id=662850367 |
| [52] | OENEMA O. Governmental policies and measures regulating nitrogen and phosphorus from animal manure in European agriculture[J]. Journal of Animal Science, 2004, 82(S13):E196-E206 https://pubmed.ncbi.nlm.nih.gov/15471798/ |
| [53] | 王敬国, 林杉, 李保国.氮循环与中国农业氮管理[J].中国农业科学, 2016, 49(3):503-517 http://www.wanfangdata.com.cn/details/detail.do?_type=perio&id=zgnykx201603009 WANG J G, LIN S, LI B G. Nitrogen cycling and management strategies in Chinese agriculture[J]. Scientia Agricultura Sinica, 2016, 49(3):503-517 http://www.wanfangdata.com.cn/details/detail.do?_type=perio&id=zgnykx201603009 |
| [54] | 韩冬梅, 刘静, 金书秦.中国农业农村环境保护政策四十年回顾与展望[J].环境与可持续发展, 2019, 44(2):16-21 http://www.wanfangdata.com.cn/details/detail.do?_type=perio&id=hjkxdt201902003 HAN D M, LIU J, JIN S Q. Historical review for recent forty years and future prospects of agricultural and rural environmental protection policies in China[J]. Environment and Sustainable Development, 2019, 44(2):16-21 http://www.wanfangdata.com.cn/details/detail.do?_type=perio&id=hjkxdt201902003 |
