张建杰3,
刘玲4,
马文奇3,
马林4,
丁尚2,
赵洪伟2,,
1.海南大学林学院 海口 570228
2.海南大学生态与环境学院/海南省农林环境过程与生态调控重点实验室 海口 570228
3.河北农业大学资源与环境科学学院 保定 071001
4.中国科学院遗传与发育生物学研究所农业资源研究中心 石家庄 050022
基金项目: 海南省重大科技项目ZDKJ2017002
详细信息
作者简介:宋晨阳, 研究方向为区域养分资源管理。E-mail:Cysong1995@163.com
通讯作者:赵洪伟, 研究方向为污染生态学。E-mail:hwzhao@hainu.edu.cn
中图分类号:S19;S158.5计量
文章访问数:280
HTML全文浏览量:1
PDF下载量:209
被引次数:0
出版历程
收稿日期:2020-01-06
录用日期:2020-05-15
刊出日期:2020-08-01
Spatial and temporal characteristics of agricultural green development indica-tors in Hainan Island
SONG Chenyang1, 2,,ZHANG Jianjie3,
LIU Ling4,
MA Wenqi3,
MA Lin4,
DING Shang2,
ZHAO Hongwei2,,
1. College of Forestry, Hainan University, Haikou 570228, China
2. College of Ecology and Environment, Hainan University/Key Laboratory of A&F Environmental Processes and Ecological Regulation of Hainan Province, Haikou 570228, China
3. College of Resources and Environmental Sciences, Hebei Agricultural University, Baoding 071001, China
4. Center for Agricultural Resources Research, Institute of Genetics and Developmental Biology, Chinese Academy of Sciences, Shijiazhuang 050022, China
Funds: the Major Science and Technology Program of Hainan ProvinceZDKJ2017002
More Information
Corresponding author:E-mail: hwzhao@hainu.edu.cn
摘要
HTML全文
图
参考文献
相关文章
施引文献
资源附件
访问统计
摘要
摘要:海南自建省以来农业生产规模、结构及生产方式均发生了很大改变,影响了其农业绿色发展程度。本文借助中国农业绿色发展指标体系,利用NUFER模型(NUtrient flows in Food chains,Environment and Resources use),选取并定量计算1988—2017年海南岛20项农业绿色发展指标,研究其时空变化特征,探究制约海南岛农业绿色发展的影响因素。研究表明:30年间海南省农业绿色发展水平总体呈下降趋势,较低级别(Ⅲ、Ⅳ级)指标数量由12个增加至15个,较高级别(Ⅰ、Ⅱ级)指标数量由8个减少至5个。随着蔬菜、水果等经济作物种植比例增加,畜禽养殖规模扩大与集约化程度提高,海南农业产值与社会发展水平不断升高,农业产值和农业机械化投入分别从0.62×10⁴ ¥·hm-2和3 kW·hm-2增加至16.1×10⁴¥·hm-2和13 kW·hm-2。30年来农业资源(氮素、磷素、农药和农膜)过量投入,其中农药和农膜的使用强度增幅最大,分别从8.0 kg·hm-2和0 kg·hm-2增加至41.9 kg·hm-2和34.7 kg·hm-2;由于生产力水平较低,导致养分(农田氮素盈余量、农田氮素径流量、农业源氨挥发等)环境排放量大幅增加,农业源氨挥发和单位播种面积农田氮素盈余增幅最大,分别从61.0 kg·hm-2和152.1 kg·hm-2增加至131.4 kg·hm-2和297.9 kg·hm-2。农业资源投入过量、农牧分离导致的环境污染是制约海南岛农业绿色发展的主要原因。在空间上,由于中部为山地林区,是国家重点生态功能保护区,开发力度较小,因此沿海平原的资源投入增长更快、养分环境损失量更多,经济增长、社会发展和农业生产3类指标提升更为迅速。今后海南岛应合理优化沿海地区种植结构,提高生产管理水平,加强农牧结合减少资源损失,实现海南岛农业绿色发展。
Abstract:Since the establishment of Hainan Province, the scale, structure, and methods of agricultural production have undergone significant changes, which are critical with respect to the progress of agricultural green development (AGD). In this study we adopted China's AGD indicator system with 20 indicators, and using the NUFER (NUtrient flows in Food chains, Environment and Resources use) model, we quantitatively calculated the spatial and temporal changes in Hainan Island AGD indicators from 1988 to 2017. Moreover, we discussed the factors restricting AGD in Hainan Island. The results revealed that the overall level of Hainan Island's AGD had shown a declining trend over the past 30 years. The numbers of indicators at lower levels (Ⅲ and Ⅳ) had increased from 12 to 15, whereas those at higher levels (Ⅰ and Ⅱ) had decreased from 8 to 5. With increase in the proportion of economic crops such as vegetables and fruits, the scale of livestock and poultry farming and the degree of intensification, Hainan's agricultural output value and social development level had continued to increase. Furthermore, the agricultural output value per unit cultivated land area and level of agricultural mechanization had increased from 6 200 ¥·hm-2 and 3 kW·hm-2 to 161 000 ¥·hm-2 and 13 kW·hm-2, respectively. Over the past 30 years, there had been an increasingly excessive input of agricultural resources (nitrogen, phosphorus, pesticides, and agricultural film), among which, the intensities of pesticide and agricultural film usage had shown the highest increases, rising from 8.0 kg·hm-2 and 0 kg·hm-2 to 41.9 kg·hm-2 and 34.7 kg·hm-2, respectively. As a consequence of the low productivity levels, the environmental emissions of applied nutrients (e.g., nitrogen surplus in farmland, nitrogen runoff in farmland, and NH3 volatilization from agricultural system) had increased significantly, with NH3 volatilization and nitrogen surplus per unit sown area showing the largest increases, rising from 61.0 kg·hm-2 and 152.1 kg·hm-2 to 131.4 kg·hm-2 and 297.9 kg·hm-2, respectively. Environmental pollution caused by an excessive input of agricultural resources and the separation of agriculture and animal husbandry had been the main factors contributing to the restriction of AGD in Hainan Island. Given that the central part of the island is covered in montane forest and has been designated as a national key ecological function protection area, the scale of development in this region had been relatively limited. Consequently, the coastal plains had experience more rapid growth in resource input. Although this had a detrimental impact on the environment, the economy growth, social development, and agricultural productivity indicators for these areas had improved to a greater extent than those for mountain forest area. In the future, Hainan Island should rationally optimize the planting structure in coastal areas, improve the level of production management, and strengthen the combination of agriculture and animal husbandry to reduce resource losses and achieve the island's requisite AGD goals.
HTML全文
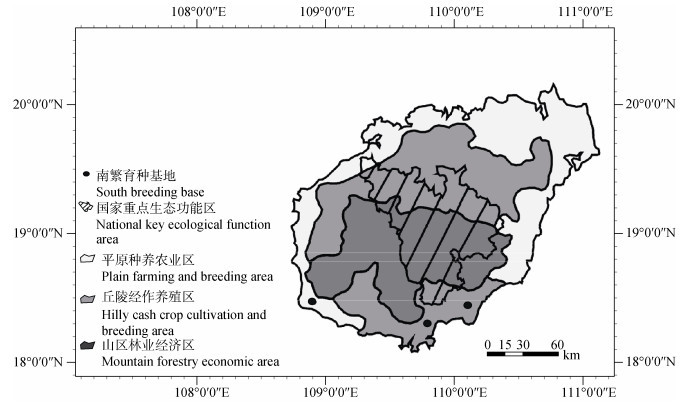
图1海南岛功能分区示意图
Figure1.Schematic diagram of functional division in Hainan Island
 下载: 全尺寸图片幻灯片
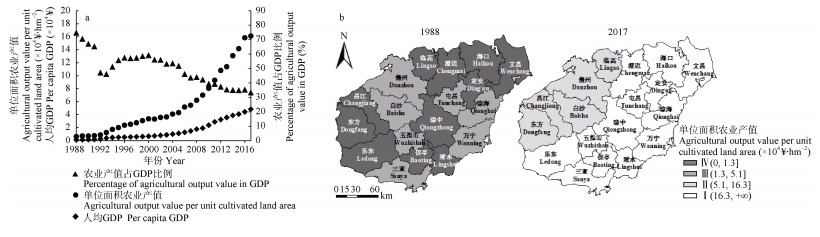
图21988—2017年海南岛经济增长指标时空变化特征(a:经济增长指标时间变化趋势; b: 1988年和2017年单位面积农业产值空间差异)
Figure2.Spatial and temporal characteristics of economy growth indicators in Hainan Island in 1988-2017 (a: temporal characteristics of economy growth indicators; b: spatial characteristics of agricultural output value per unit cultivated land area in 1988 and 2017)
下载: 全尺寸图片幻灯片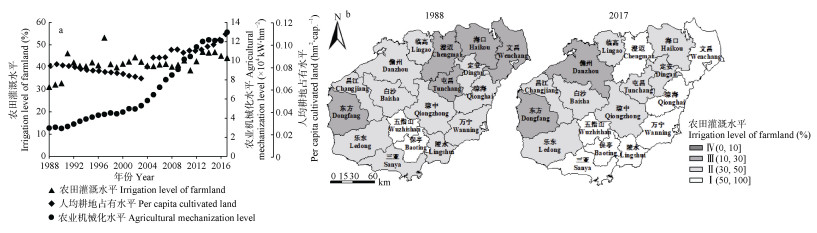
图31988—2017年海南岛社会发展指标时空变化特征(a:社会发展指标时间变化趋势; b: 1988年和2017年农业灌溉水平空间差异)
Figure3.Spatial and temporal characteristics of social development indicators in Hainan Island in 1988-2017 (a: temporal characteristics of social development indicators; b: spatial characteristics of irrigation level of farmland in 1988 and 2017)
下载: 全尺寸图片幻灯片
图41988—2017年海南岛资源投入指标时空变化特征(a、c:资源利用指标时间变化趋势; b: 1988年和2017年氮素使用强度空间差异; d: 1988年和2017年磷素使用强度空间差异)
Figure4.Spatial and temporal characteristics of resource input indicators in Hainan Island in 1988-2017 (a, c: temporal characteristics of resource utilization indicators; b: spatial characteristics of nitrogen use intensity in 1988 and 2017; d: spatial characteristics of phosphorus use intensity in 1988 and 2017)
下载: 全尺寸图片幻灯片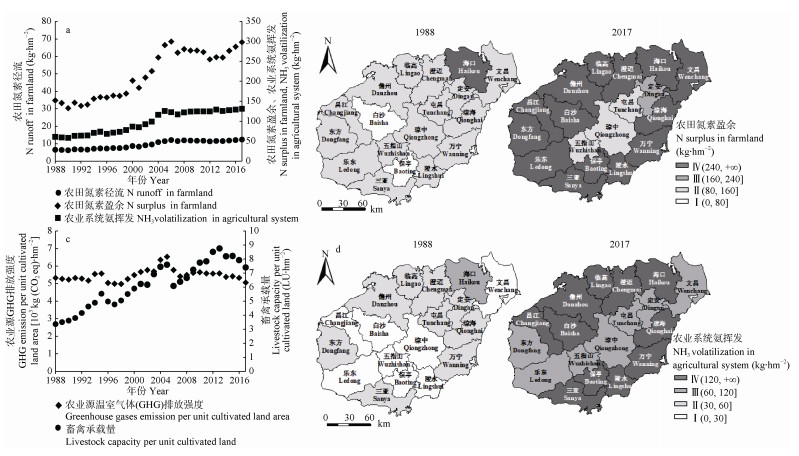
图51988—2017年海南岛生态环境指标时空变化特征(a、c:生态环境指标时间变化趋势; b: 1988年和2017年农田氮素盈余量空间差异; d: 1988年和2017年农业系统氨挥发空间差异)
Figure5.Spatial and temporal characteristics of ecological environment indicators in Hainan Island in 1988-2017 (a, c: temporal characteristics of ecological environment indicators; b: spatial characteristics of N surplus in farmland in1988 and 2017; d: spatial characteristics of NH3 volatilization in agricultural system in 1988 and 2017)
下载: 全尺寸图片幻灯片
图61988—2017年海南岛农业生产指标时空变化特征(a、c:农业生产指标时间变化趋势; b: 2017年单位面积蔬菜产量和水果产量空间差异; d: 1988年和2017年单位动物蛋白产量空间差异)
Figure6.Spatial and temporal characteristics of agricultural productivity indicators in Hainan Island in 1988-2017 (a, c: temporal characteristics of agricultural productivity indicators; b: spatial characteristics of vegetables and fruits yields in 2017; d: spatial characteristics of protein production per livestock unit in 1988 and 2017)
下载: 全尺寸图片幻灯片
图71988—2017年海南岛农业绿色发展指标间的关系(a:单位面积农业产值与播种面积占比之间的关系; b:单位面积农业产值与畜禽承载量之间的关系; c:资源投入及生态环境与播种面积占比之间的关系; d:资源投入及生态环境与畜禽承载量之间的关系)
Figure7.Relationships between agricultural green development indicators of Hainan Island in 1988-2017 (a: relationship between agricultural output value per unit cultivated land area and proportion of planting areas; b: relationship between agricultural output value per unit cultivated land area and livestock capacity per unit cultivated land area; c: relationship between proportion of planting areas and resource inputs or ecological environment; d: relationship between livestock capacity per unit cultivated land area and resources inputs or ecological environment)
下载: 全尺寸图片幻灯片表11988年和2017年海南岛农业绿色发展指标变化
Table1.Changes of agricultural green development indicators of Hainan Island from 1988 to 2017
| 指标类别 Category | 指标 Indicator | 1988 | 2017 | |||
| 值Value | 等级Grade | 值Value | 等级Grade | |||
| 经济增长 Economy growth | 单位面积农业产值 Agricultural output value per unit cultivated land (×104 ¥·hm-2) | 0.6 | Ⅳ | 16.1 | Ⅱ | |
| 人均GDP Per capita GDP (×104 ¥·cap.–1) | 0.1 | Ⅳ | 4.8 | Ⅱ | ||
| 农业产值占GDP比例Percentage of agricultural output value in GDP (%) | 74.8 | Ⅰ | 33.4 | Ⅱ | ||
| 社会发展 Social development | 人均耕地占有水平Per capita cultivated land (hm2·cap.-1) | 0.08 | Ⅳ | 0.11 | Ⅳ | |
| 农田灌溉水平Irrigation level of farmland (%) | 31.1 | Ⅱ | 44.1 | Ⅱ | ||
| 农业机械化水平Agricultural mechanization level (×104 kW·hm-2·a-1) | 3.0 | Ⅲ | 13.0 | Ⅰ | ||
| 资源投入 Resources inputs | 氮素使用强度N use intensity (kg·hm-2) | 217.0 | Ⅱ | 411.7 | Ⅳ | |
| 磷素使用强度P use intensity (kg·hm-2) | 13.9 | Ⅰ | 66.2 | Ⅳ | ||
| 农药使用强度Pesticides use intensity (kg·hm-2) | 8.0 | Ⅳ | 41.9 | Ⅳ | ||
| 农膜使用强度Agricultural film use intensity (kg·hm-2) | 0 | Ⅰ | 34.7 | Ⅳ | ||
| 生态环境 Ecological environment | 农田氮素盈余N surplus in farmland (kg·hm-2) | 152.1 | Ⅱ | 297.9 | Ⅳ | |
| 农田氮素径流N runoff in farmland (kg·hm-2) | 6.5 | Ⅰ | 12.4 | Ⅲ | ||
| 农业系统氨挥发NH3 volatilization in agricultural system (kg·hm-2) | 61.0 | Ⅲ | 131.4 | Ⅳ | ||
| 农业源温室气体排放强度 Greenhouse gases emission intensity per unit cultivated land (kg·hm-2) | 5 327.3 | Ⅳ | 5 061.3 | Ⅳ | ||
| 畜禽承载量Livestock capacity per unit cultivated land (LU·hm-2) | 3.4 | Ⅱ | 7.4 | Ⅳ | ||
| 农业生产 Agricultural production | 农田系统氮素利用效率N use efficiency in crop production (%) | 15.9 | Ⅳ | 20.0 | Ⅳ | |
| 畜牧系统氮素利用效率N use efficiency in animal production (%) | 4.0 | Ⅳ | 8.3 | Ⅳ | ||
| 单位动物蛋白产量Protein production per livestock unit (kg·LU-1) | 11.0 | Ⅳ | 20.6 | Ⅲ | ||
| 蔬菜单产水平Vegetable yield (t·hm-2) | 10.0 | Ⅳ | 22.9 | Ⅲ | ||
| 水果单产水平Fruit yield (t·hm-2) | 9.7 | Ⅳ | 20.5 | Ⅲ | ||
下载: 导出CSV参考文献
| [1] | MA L, ZHANG W F, MA W Q, et al. An analysis of developments and challenges in nutrient management in China[J]. Journal of Environmental Quality, 2013, 42(4):951-961 http://www.wanfangdata.com.cn/details/detail.do?_type=perio&id=858b3d53457130ed0e790b26f60f0be2 |
| [2] | GUO J H, LIU X J, ZHANG Y, et al. Significant acidification in major Chinese croplands[J]. Science, 2010, 327(5968):1008-1010 http://www.wanfangdata.com.cn/details/detail.do?_type=perio&id=d1f9ce8d6034e5b3e025f9721521f533 |
| [3] | GIORDANO J C P, BRUSH M J, ANDERSON I C. Quantifying annual nitrogen loads to Virginia's coastal lagoons:Sources and water quality response[J]. Estuaries and Coasts, 2011, 34(2):297-309 doi: 10.1007/s12237-010-9345-7 |
| [4] | ZHOU J Y, GU B J, SCHLESINGER W H, et al. Significant accumulation of nitrate in Chinese semi-humid croplands[J]. Scientific Reports, 2016, 6:25088 http://www.ncbi.nlm.nih.gov/pubmed/27114032 |
| [5] | ZHENG H, WANG L J, PENG W J, et al. Realizing the values of natural capital for inclusive, sustainable development:Informing China's new ecological development strategy[J]. Proceedings of the National Academy of Sciences of the United States of America, 2019, 116(17):8623-8628 http://www.ncbi.nlm.nih.gov/pubmed/30952787 |
| [6] | MA L, BAI Z H, MA W Q, et al. Exploring future food provision scenarios for China[J]. Environmental Science & Technology, 2019, 53(3):1385-1393 http://www.wanfangdata.com.cn/details/detail.do?_type=perio&id=8656ced5954ed21fd98d2d80e127dc36 |
| [7] | 韩长赋.大力推进农业绿色发展[J].农村实用技术, 2018, (3):12-13 http://www.wanfangdata.com.cn/details/detail.do?_type=perio&id=ncsyjs201803004 HAN C F. Vigorously promote green development of agriculture[J]. Applicable Technologies for Rural Areas, 2018, (3):12-13 http://www.wanfangdata.com.cn/details/detail.do?_type=perio&id=ncsyjs201803004 |
| [8] | 李谷成.中国农业的绿色生产率革命:1978-2008年[J].经济学, 2014, 13(2):537-558 http://www.cnki.com.cn/Article/CJFDTotal-JJXU201402006.htm LI G C. The green productivity revolution of agriculture in China from 1978 to 2008[J]. China Economic Quarterly, 2014, 13(2):537-558 http://www.cnki.com.cn/Article/CJFDTotal-JJXU201402006.htm |
| [9] | 金书秦, 牛坤玉, 韩冬梅.农业绿色发展路径及其"十四五"取向[J].改革, 2020, 33(2):30-39 http://www.wanfangdata.com.cn/details/detail.do?_type=perio&id=gaig202002004 JIN S Q, NIU K Y, HAN D M. The path of agricultural green development and its orientation in the 14th five-year plan period[J]. Reform, 2020, 33(2):30-39 http://www.wanfangdata.com.cn/details/detail.do?_type=perio&id=gaig202002004 |
| [10] | SHEN J B, ZHU Q C, JIAO X Q, et al. Agriculture green development:A model for China and the world[J]. Frontiers of Agricultural Science and Engineering, 2020, 7(1):5-13 http://www.wanfangdata.com.cn/details/detail.do?_type=perio&id=10.1177/0888325489003003005 |
| [11] | PéTRY F. Sustainability Issues in Agricultural and Rural Development Policies:Vol. 2:Traineer's-Kit[M]. Roma:FAO, 1995 |
| [12] | 高薇, 汪岚, 栾胜基.欧盟农业环境足迹指数法述评[J].生态经济, 2015, 31(9):176-180 http://www.wanfangdata.com.cn/details/detail.do?_type=perio&id=665783959 GAO W, WANG L, LUAN S J. Review of the EU agri-environmental footprint index method[J]. Ecological Economy, 2015, 31(9):176-180 http://www.wanfangdata.com.cn/details/detail.do?_type=perio&id=665783959 |
| [13] | 魏琦, 张斌, 金书秦.中国农业绿色发展指数构建及区域比较研究[J].农业经济问题, 2018, (11):11-20 http://www.wanfangdata.com.cn/details/detail.do?_type=perio&id=nyjjwt201811002 WEI Q, ZHANG B, JIN S Q. A study on construction and regional comparison of agricultural green development index in China[J]. Issues in Agricultural Economy, 2018, (11):11-20 http://www.wanfangdata.com.cn/details/detail.do?_type=perio&id=nyjjwt201811002 |
| [14] | 袁久和.我国农村绿色发展水平与影响因素的实证分析[J].山西农业大学学报:社会科学版, 2019, 18(6):46-53 http://www.wanfangdata.com.cn/details/detail.do?_type=perio&id=sxnydxxb-shkx201906008 YUAN J H. Empirical analysis of green development level and influencing factors in rural areas of China[J]. Journal of Shanxi Agricultural University:Social Science Edition, 2019, 18(6):46-53 http://www.wanfangdata.com.cn/details/detail.do?_type=perio&id=sxnydxxb-shkx201906008 |
| [15] | 杨世琦.基于欧氏距离的农业可持续发展评价理论构建与实例验证[J].生态学报, 2017, 37(11):3840-3848 http://www.wanfangdata.com.cn/details/detail.do?_type=perio&id=stxb201711026 YANG S Q. A case study of a novel sustainable agricultural development evaluation method based on Euclidean distance theory[J]. Acta Ecologica Sinica, 2017, 37(11):3840-3848 http://www.wanfangdata.com.cn/details/detail.do?_type=perio&id=stxb201711026 |
| [16] | LIU Y F, SUN D S, WANG H J, et al. An evaluation of China's agricultural green production:1978-2017[J]. Journal of Cleaner Production, 2020, 243:118483 https://www.sciencedirect.com/science/article/abs/pii/S0959652619333530 |
| [17] | 新华社.中共中央国务院关于支持海南全面深化改革开放的指导意见[EB/OL].北京: 新华社, (2018-04-14). http://www.gov.cn/zhengce/2018-04/14/content_5282456.htm Xinhua News. Guiding opinions of the CPC Central Committee and the State Council on supporting Hainan's comprehensive deepening reform and opening-up[EB/OL]. Beijing: Xinhua News, (2018-04-14). http://www.gov.cn/zhengce/2018-04/14/content_5282456.htm |
| [18] | 张建杰, 崔石磊, 马林, 等.中国农业绿色发展指标体系的构建与例证[J].中国生态农业学报(中英文), 2020, DOI: 10.13930/j.cnki.cjea.200069 ZHANG J J, CUI S L, MA L, et al. Construction of a green development index system for agriculture in China and examples[J]. Chinese Journal of Eco-Agriculture, 2020, DOI: 10.13930/j.cnki.cjea.200069 |
| [19] | 海南省统计局, 国家统计局海南调查总队.海南统计年鉴[M].北京:中国统计出版社, 2018 Hainan Provincial Bureau of Statistics, Hainan Survey Team of National Bureau of Statistics. Hainan Statistical Yearbook 2018[M]. Beijing:China Statistics Press, 2018 |
| [20] | MA L, MA W Q, VELTHOF G F, et al. Modeling nutrient flows in the food chain of China[J]. Journal of Environmental Quality, 2010, 39(4):1279-1289 http://www.wanfangdata.com.cn/details/detail.do?_type=perio&id=c6f1ff96561c98178eb17e3a1642596b |
| [21] | 刘晓利.我国"农田-畜牧-营养-环境"体系氮素养分循环与平衡[D].保定: 河北农业大学, 2005 http://cdmd.cnki.com.cn/Article/CDMD-11920-2005104444.htm LIU X L. Nitrogen cycling and balance in "agriculture-livestock-nutrition-environment" system in China[D]. Baoding: Hebei Agricultural University, 2005 http://cdmd.cnki.com.cn/Article/CDMD-11920-2005104444.htm |
| [22] | 阮云泽, 张茂星, 陈鹏, 等.热带人工橡胶林地砖红壤中氨挥发规律的研究[J].土壤, 2014, 46(3):466-469 http://www.wanfangdata.com.cn/details/detail.do?_type=perio&id=tr201403013 RUAN Y Z, ZHANG M X, CHEN P, et al. Characterization of ammonia volatilization from latosol soils in rubber plantation in tropical region[J]. Soils, 2014, 46(3):466-469 http://www.wanfangdata.com.cn/details/detail.do?_type=perio&id=tr201403013 |
| [23] | 海南省农业农村厅.关于加大支持儋州市推进畜禽养殖粪污资源化利用的建议[EB/OL]. (2018-04-09). http://www.hainan.gov.cn/rdjydata-6527.html Hainan Provincial Department of Agriculture. Suggestions on strengthening the support of Danzhou to promote the utilization of manure from livestock and poultry[EB/OL]. (2018-04-09). http://www.hainan.gov.cn/rdjydata-6527.html |
| [24] | 海南省农业厅.《海南省"十三五"秸秆综合利用实施方案》的公告[EB/OL]. (2017-12-19). https://www.nongjitong.com/news/2017/426707.html Hainan Provincial Department of Agriculture. Implementation plan of comprehensive utilization of straw in the "Thirteenth Five-Year Plan" in Hainan Province[EB/OL]. (2017-12-19). https://www.nongjitong.com/news/2017/426707.html |
| [25] | 国家发展和改革委员会价格司.全国农产品成本收益资料汇编2018[M].北京:中国统计出版社, 2018 National Development and Reform Commission of the People' Repbulic of China. Compilation of National Agricultural Product Cost-Benefit Data[M]. Beijing:China Statistics Press, 2018 |
| [26] | 冀宏杰, 张认连, 武淑霞, 等.太湖流域农田肥料投入与养分平衡状况分析[J].中国土壤与肥料, 2008, (5):70-75 http://www.wanfangdata.com.cn/details/detail.do?_type=perio&id=trfl200805016 JI H J, ZHANG R L, WU S X, et al. Analysis of fertilizer input and nutrient balance of farmland in Taihu watershed[J]. Soil and Fertilizer Sciences in China, 2008, (5):70-75 http://www.wanfangdata.com.cn/details/detail.do?_type=perio&id=trfl200805016 |
| [27] | YAN Z J, LIU P P, LI Y H, et al. Phosphorus in China's intensive vegetable production systems:Overfertilization, soil enrichment, and environmental implications[J]. Journal of Environmental Quality, 2013, 42(4):982-989 http://www.ncbi.nlm.nih.gov/pubmed/24216350 |
| [28] | 武良, 张卫峰, 陈新平, 等.中国农田氮肥投入和生产效率[J].中国土壤与肥料, 2016, (4):76-83 http://www.wanfangdata.com.cn/details/detail.do?_type=perio&id=trfl201604013 WU L, ZHANG W F, CHEN X P, et al. Nitrogen fertilizer input and nitrogen use efficiency in Chinese farmland[J]. Soil and Fertilizer Sciences in China, 2016, (4):76-83 http://www.wanfangdata.com.cn/details/detail.do?_type=perio&id=trfl201604013 |
| [29] | 朱兆良.中国土壤氮素研究[J].土壤学报, 2008, 45(5):778-783 http://www.wanfangdata.com.cn/details/detail.do?_type=perio&id=trxb200805003 ZHU Z L. Research on soil nitrogen in China[J]. Acta Pedologica Sinica, 2008, 45(5):778-783 http://www.wanfangdata.com.cn/details/detail.do?_type=perio&id=trxb200805003 |
| [30] | 丁尚, 郭浩浩, 程鸣宇, 等.海南农牧生产体系氮素养分流动时空变化特征[J].中国生态农业学报(中英文), 2019, 27(2):246-256 http://www.ecoagri.ac.cn/zgstny/ch/reader/view_abstract.aspx?file_no=2019-0212&flag=1 DING S, GUO H H, CHENG M Y, et al. Spatial and temporal characteristics of nitrogen flows in farming and animal production system in Hainan Province[J]. Chinese Journal of Eco-Agriculture, 2019, 27(2):246-256 http://www.ecoagri.ac.cn/zgstny/ch/reader/view_abstract.aspx?file_no=2019-0212&flag=1 |
| [31] | OENEMA O, KROS H, DE VRIES W. Approaches and uncertainties in nutrient budgets:Implications for nutrient management and environmental policies[J]. European Journal of Agronomy, 2003, 20(1/2):3-16 https://www.sciencedirect.com/science/article/abs/pii/S1161030103000674?cc=y&via=ihub |
| [32] | 邓万刚.海南岛土壤酸度数据库的建立及土壤酸度变异研究[D].儋州: 华南热带农业大学, 2005 http://cdmd.cnki.com.cn/Article/CDMD-10565-2005092735.htm DENG W G. Foundation of soil acidity database and study on variation of soil acidity in Hainan island[D]. Danzhou: South China University of Tropical Agriculture, 2005 http://cdmd.cnki.com.cn/Article/CDMD-10565-2005092735.htm |
| [33] | 赵青云, 王辉, 庄辉发, 等.海南香草兰园土壤酸化现状及酸化原因分析[J].热带农业科技, 2014, 37(1):12-13 http://www.wanfangdata.com.cn/details/detail.do?_type=perio&id=ynrzkj201401004 ZHAO Q Y, WANG H, ZHUANG H F, et al. Investigation and analysis of the soil acidification of vanilla orchard in Hainan[J]. Tropical Agricultural Science & Technology, 2014, 37(1):12-13 http://www.wanfangdata.com.cn/details/detail.do?_type=perio&id=ynrzkj201401004 |
| [34] | 梁伟红, 罗微, 刘燕群, 等.海南冬季瓜菜产业风险及可持续发展对策研究[J].江苏农业科学, 2013, 41(10):431-433 http://www.wanfangdata.com.cn/details/detail.do?_type=perio&id=jsnykx201310154 LIANG W H, LUO W, LIU Y Q, et al. Study on risks and sustainable development countermeasures of melon-vegetable industry in Hainan Province[J]. Jiangsu Agricultural Sciences, 2013, 41(10):431-433 http://www.wanfangdata.com.cn/details/detail.do?_type=perio&id=jsnykx201310154 |
| [35] | 中华人民共和国国家统计局.中国统计年鉴[M].北京:中国统计出版社, 2019 National Bureau of Statistics of the People's Republic of China. China Statistical Yearbook[M]. Beijing:China Statistics Press, 2019 |
| [36] | BAI Z H, MA L, QIN W, et al. Changes in pig production in China and their effects on nitrogen and phosphorus use and losses[J]. Environmental Science & Technology, 2014, 48(21):12742-12749 http://www.wanfangdata.com.cn/details/detail.do?_type=perio&id=b0f80fbc205e799f36f400a119f71b23 |
| [37] | 马怡斐, 柏兆海, 马林, 等.栾城城郊型农牧系统养分流动与环境排放时空特征[J].中国农业科学, 2018, 51(3):493-506 http://www.wanfangdata.com.cn/details/detail.do?_type=perio&id=zgnykx201803009 MA Y F, BAI Z H, MA L, et al. Temporal and spatial changes of nutrient flows and losses in the Peri-Urban crop-livestock system in Luancheng[J]. Scientia Agricultura Sinica, 2018, 51(3):493-506 http://www.wanfangdata.com.cn/details/detail.do?_type=perio&id=zgnykx201803009 |
