李建琴2,,
1.福建省农业科学院农业经济与科技信息研究所 福州 350003
2.浙江大学经济学院 杭州 310027
基金项目: 福建省属公益类科研院所基本科研专项2020R1101
详细信息
作者简介:杨军, 主要研究方向为生态农业产业经济。E-mail:756165940@qq.com
通讯作者:李建琴, 主要研究方向为农业产业经济。E-mail:zjhzljq@126.com
中图分类号:F323.2计量
文章访问数:195
HTML全文浏览量:5
PDF下载量:150
被引次数:0
出版历程
收稿日期:2019-12-11
录用日期:2020-03-25
刊出日期:2020-08-01
Research on the relationship between agricultural economic growth, agricul-tural structure, and agricultural non-point source pollution in Fujian Province
YANG Jun1,,LI Jianqin2,,
1. Institute of Agricultural Economy and Sci-technological Information, Fujian Academy of Agricultural Sciences, Fuzhou 350003, China
2. School of Economics, Zhejiang University, Hangzhou 310027, China
Funds: the Public Welfare Foundation of Fujian Province2020R1101
More Information
Corresponding author:LI Jianqin, E-mail: zjhzljq@126.com
摘要
HTML全文
图
参考文献
相关文章
施引文献
资源附件
访问统计
摘要
摘要:农业面源污染已经成为影响社会经济可持续发展的突出问题,而农业结构被认为在其中发挥了重要的调节作用。本研究在根据曲劳(Truog)的养分平衡法理论测算了农业面源污染的主要来源——过剩氮总量的基础上,运用基于VECM模型的脉冲响应函数和方差分解方法,考察了福建省1998—2017年农业经济增长、农业面源污染、农业结构之间的关系。研究结果表明:1)农业经济增长、农业面源污染、农业结构之间存在长期均衡关系。2)格兰杰检验结果表明:农业面源污染与农业经济增长互为格兰杰原因;农业结构分别是面源污染和农业经济增长的格兰杰原因,农业经济增长是农业结构的格兰杰原因。3)方差分解结果显示:农业经济增长与农业结构对农业面源污染的冲击影响很小,对农业面源污染的预测方差贡献分别仅有4.31%和4.02%。但农业面源污染对农业经济增长的冲击影响较大,向前推进10年,其预测方差中来自农业面源污染的方差贡献达47.02%。为此,福建省应在继续保持对农业面源污染严格治理力度的基础上,重视绿色化农业技术和模式的开发应用,加强农业基础设施建设,制订更加明确精准的绿色农业导向性政策,加强绿色消费观念的引导和培养。
关键词:面源污染/
经济增长/
农业结构/
VECM模型/
脉冲响应分析
Abstract:Agricultural structure is considered to play an important role in regulating the dual pressures of economic growth and non-point source pollution from agricultural development. The total amount of surplus nitrogen, which is the main source of agricultural non-point source pollution, was calculated according to Truog's nutrient balance theory. The impulse response function and variance decomposition methods, based on the vector error correction model (VECM), were used to investigate and explain the relationship among agricultural economic growth, agricultural non-point source pollution, and agricultural structure in Fujian Province from 1998 to 2017. The research results showed that: 1) there was a relationship of long-term equilibrium among agricultural economic growth, agricultural non-point source pollution, and agricultural structure. 2) The Granger causality test showed that: agricultural non-point source pollution and economic growth were Granger causes for each other; agricultural structure was the Granger cause of non-point source pollution and agricultural economic growth; and agricultural economic growth was the Granger cause of agricultural structure. 3) The results of variance decomposition showed that there was little impact of agricultural economic growth and agricultural structure on agricultural non-point source pollution. The variance contribution of the impact of agricultural economic growth and agricultural structure on agricultural economic growth was 4.31% and 4.02%, respectively. The agricultural non-point source pollution had a great effect on agricultural economic growth. In the next 10 years, the variance contribution from agricultural non-point source pollution would reach 47.02%. 4) In the light of these findings, potential policy suggestions include: continuing to rectify agricultural non-point source pollution; encouraging the development and application of green agricultural technology and methods; increasing the role of the construction of agricultural infrastructure and farmer organization, introducing more detailed and guided financial policies to support agriculture; and strengthening the awareness on green consumption.
Key words:Non-point source pollution/
Economic growth/
Agricultural structure/
VECM model/
Impulse response analysis
HTML全文
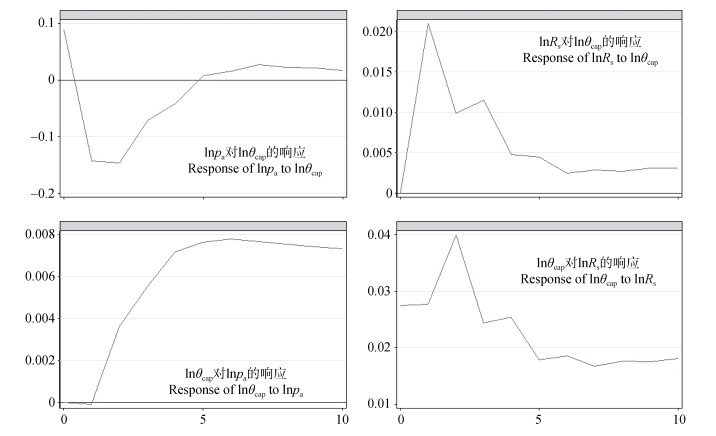
图1农业实际增加值(1npa)、人均过剩氮($1n{\theta _{cap}}$)和畜牧业产值比(lnRs)之间的正交化响应脉冲图
Figure1.Orthogonalization response pulse diagram between agricultural real added value (1npa), excess nitrogen per capita$(1{\rm{n}}{\theta _{{\rm{cap}}}})$ and animal husbandry structure (lnRs)
 下载: 全尺寸图片幻灯片
表11998—2017年福建省VAR模型指标基本情况
Table1.Basic information of VAR model indicators of Fujian Province from 1998 to 2017
| 年份 Year | 人均过剩氮量 Excess nitrogen per capita (×104 t) | 畜牧业产值比 Animal husbandry structure (%) | 农业实际增加值 Agricultural real added value (×108¥) |
| 1998 | 8.083 | 18.20 | 610.100 |
| 1999 | 8.492 | 17.60 | 627.183 |
| 2000 | 8.532 | 17.60 | 642.235 |
| 2001 | 14.422 | 17.90 | 660.218 |
| 2002 | 14.865 | 18.10 | 679.364 |
| 2003 | 15.399 | 18.30 | 696.348 |
| 2004 | 15.210 | 19.90 | 740.218 |
| 2005 | 15.534 | 17.70 | 778.709 |
| 2006 | 15.815 | 21.80 | 817.645 |
| 2007 | 15.091 | 17.90 | 847.898 |
| 2008 | 14.878 | 19.30 | 894.532 |
| 2009 | 14.839 | 16.30 | 932.103 |
| 2010 | 14.779 | 14.60 | 972.183 |
| 2011 | 14.665 | 15.50 | 1 013.987 |
| 2012 | 15.161 | 14.10 | 1 059.616 |
| 2013 | 15.252 | 13.80 | 1 102.001 |
| 2014 | 15.380 | 13.10 | 1 148.285 |
| 2015 | 15.960 | 13.60 | 1 194.216 |
| 2016 | 16.421 | 14.50 | 1 236.014 |
| 2017 | 19.049 | 16.90 | 1 286.690 |
下载: 导出CSV表2农业实际增加值(1npa)、人均过剩氮($1n{\theta _{cap}}$)和畜牧业产值比(1nRs)的单位根检验结果
Table2.Unit root tests of agricultural real added value (1npa), excess nitrogen per capita ($1{\rm{n}}{\theta _{{\rm{cap}}}}$) and animal husbandry structure (lnRs)
| 检验方法 Test method | 变量 Variable | 检验值 Test value | 1%临界值 1% critical value | 5%临界值 5% critical value | 数据性质 Data property |
| DF单位根检验 Unit root test of DF | $\Delta 1{\rm{n}}{p_{\rm{a}}}$ | -3.864*** | -3.750 | -3.000 | 平稳时间序列Stationary time series |
| $\Delta 1{\rm{n}}{\theta _{{\rm{cap}}}}$ | -4.023*** | -3.750 | -3.000 | 平稳时间序列Stationary time series | |
| $\Delta 1{\rm{n}}{R_{\rm{s}}}$ | -6.226*** | -3.750 | -3.000 | 平稳时间序列Stationary time series | |
| PP单位根检验 Unit root test of PP | $\Delta 1{\rm{n}}{p_{\rm{a}}}$ | -3.809*** | -3.750 | -3.000 | 平稳时间序列Stationary time series |
| $\Delta 1{\rm{n}}{\theta _{{\rm{cap}}}}$ | -4.030*** | -3.750 | -3.000 | 平稳时间序列Stationary time series | |
| $\Delta 1{\rm{n}}{R_{\rm{s}}}$ | -5.970*** | -3.750 | -3.000 | 平稳时间序列Stationary time series | |
| Δ表示变量的一阶差分; ***表示在P < 0.001水平显著。Δ means the first difference of the variable. *** denotes significance at P < 0.001 level. | |||||
下载: 导出CSV表3农业实际增加值(1npa)、人均过剩氮($1n{\theta _{cap}}$)和畜牧业产值比(1nRs)关系的协整关系检验
Table3.Cointegration test on the relationship between agricultural real added value (1npa), excess nitrogen per capita $(1{\rm{n}}{\theta _{{\rm{cap}}}})$ and animal husbandry structure (lnRs)
| 协整关系数 Number of cointegration relationship | 特征值 Characteristic value | 迹统计量 Trace statistics | 5%临界值 5% critical value | 最大值 Maximum value | 5%临界值 5% critical value |
| 无No | 42.917 5 | 34.55 | 28.186 9 | 23.78 | |
| ≥1 | 0.791 1 | 14.730 7* | 18.17 | 12.776 7 | 16.87 |
| ≥2 | 0.508 3 | 1.954 0 | 3.74 | 1.954 0 | 3.74 |
| *表示在P < 5%水平显著。* denote significance at P < 5% level. | |||||
下载: 导出CSV表4农业实际增加值(1npa)、人均过剩氮($1n{\theta _{cap}}$)和畜牧业产值比(1nRs)关系的VAR模型滞后期数选择
Table4.Selection of VAR lag periods on the relationship between agricultural real added value (1npa), excess nitrogen per capita ($1{\rm{n}}{\theta _{{\rm{cap}}}}$) and animal husbandry structure (lnRs)
| 滞后期(年) Lag period (a) | 赤池信息准则 AIC | 汉南-昆信息准则HQIC | 施瓦茨信息准则SBIC |
| 0 | -11.807 9 | -11.809 4 | -11.666 3 |
| 1 | -11.652 0 | -11.658 1 | -11.085 6 |
| 2 | -11.688 8 | -11.699 4 | -10.697 5 |
| 3 | -13.780 0* | -13.795 1* | -12.363 9* |
| *表示在P < 5%水平显著。* denotes significance at P < 5% level. | |||
下载: 导出CSV表5农业实际增加值(1npa)、人均过剩氮($1n{\theta _{cap}}$)和畜牧业产值比(lnRs)的关系的Granger因果性检验结果
Table5.Granger causality test results on the relationship between agricultural real added value (1npa), excess nitrogen per capita ($1{\rm{n}}{\theta _{{\rm{cap}}}}$) and animal husbandry structure (lnRs)
| 原假设 Original hypothesis | 滞后阶数 Lagging order (a) | F | P |
| 1npa是$1{\rm{n}}{\theta _{{\rm{cap}}}}$的格兰杰原因 1npa is the Granger cause of $1{\rm{n}}{\theta _{{\rm{cap}}}}$ | 3 | 26.297 | 0.000 |
| lnRs是$1{\rm{n}}{\theta _{{\rm{cap}}}}$的格兰杰原因 lnRs is the Granger cause of $1{\rm{n}}{\theta _{{\rm{cap}}}}$ | 3 | 13.227 | 0.004 |
| $1{\rm{n}}{\theta _{{\rm{cap}}}}$是1npa的格兰杰原因 $1{\rm{n}}{\theta _{{\rm{cap}}}}$is the Granger cause of 1npa | 3 | 100.760 | 0.000 |
| lnRs是1npa的格兰杰原因 lnRs is the Granger cause of 1npa | 3 | 11.424 | 0.010 |
| 1npa是lnRs的格兰杰原因 1npa is the Granger cause of lnRs | 3 | 2.944 | 0.055 |
| $1{\rm{n}}{\theta _{{\rm{cap}}}}$不是lnRs的格兰杰原因 $1{\rm{n}}{\theta _{{\rm{cap}}}}$isn’t the Granger cause of lnRs | 3 | 7.591 | 0.400 |
下载: 导出CSV表6农业实际增加值(1npa)和人均过剩氮$(1n{\theta _{cap}})$为响应变量的方差分解结果
Table6.Variance decomposition on the response of agricultural real added value (1npa) and excess nitrogen per capita ($1{\rm{n}}{\theta _{{\rm{cap}}}}$)
| 时期Period (a) | $1{\rm{n}}{\theta _{{\rm{cap}}}}$作为响应变量$1{\rm{n}}{\theta _{{\rm{cap}}}}$as response variable | 1npa作为响应变量1npa as response variable | |||
| $1{\rm{n}}{\theta _{{\rm{cap}}}}$ | 1npa | lnRs | $1{\rm{n}}{\theta _{{\rm{cap}}}}$ | ||
| 0 | 0 | 0 | 0 | ||
| 1 | 1 | 0 | 0 | 0.006 849 | |
| 2 | 0.949 316 | 0.023 176 | 0.027 508 | 0.005 864 | |
| 3 | 0.931 383 | 0.038 523 | 0.030 094 | 0.088 530 | |
| 4 | 0.922 067 | 0.041 405 | 0.036 528 | 0.182 309 | |
| 5 | 0.919 970 | 0.042 387 | 0.037 642 | 0.277 181 | |
| 6 | 0.918 933 | 0.042 375 | 0.038 691 | 0.346 184 | |
| 7 | 0.918 505 | 0.042 496 | 0.038 999 | 0.395 473 | |
| 8 | 0.917 768 | 0.042 823 | 0.039 409 | 0.429 128 | |
| 9 | 0.917 227 | 0.043 014 | 0.039 759 | 0.452 885 | |
| 10 | 0.916 635 | 0.043 149 | 0.040 217 | 0.470 189 | |
| lnRs:畜牧业产值比。lnRs: animal husbandry structure. | |||||
下载: 导出CSV参考文献
| [1] | 李秀芬, 朱金兆, 顾晓君, 等.农业面源污染现状与防治进展[J].中国人口·资源与环境, 2010, 20(4):81-84 doi: 10.3969/j.issn.1002-2104.2010.04.014 LI X F, ZHU J Z, GU X J, et al. Current situation and control of agricultural non-point source pollution[J]. China Population, Resources and Environment, 2010, 20(4):81-84 doi: 10.3969/j.issn.1002-2104.2010.04.014 |
| [2] | 陈锡文.环境问题与中国农村发展[J].管理世界, 2002, (1):5-8 http://www.wanfangdata.com.cn/details/detail.do?_type=perio&id=glsj200201002 CHEN X W. Environment and China's rural development[J]. Management World, 2002, (1):5-8 http://www.wanfangdata.com.cn/details/detail.do?_type=perio&id=glsj200201002 |
| [3] | 闵继胜, 孔祥智.我国农业面源污染问题的研究进展[J].华中农业大学学报:社会科学版, 2016, (2):59-66 http://www.cnki.com.cn/Article/CJFDTotal-HZND201602010.htm MIN J S, KONG X Z. Research development of agricultural non-point source pollution in China[J]. Journal of Huazhong Agricultural University:Social Sciences Edition, 2016, (2):59-66 http://www.cnki.com.cn/Article/CJFDTotal-HZND201602010.htm |
| [4] | 文传浩, 张丹, 铁燕.农业面源污染环境效应及其对新农村建设耦合影响分析[J].贵州社会科学, 2008, (4):91-96 doi: 10.3969/j.issn.1002-6924.2008.04.018 WEN C H, ZHANG D, TIE Y. Environmental effects of agricultural non-point source pollution and its coupling impact on new rural construction[J]. Guizhou Social Sciences, 2008, (4):91-96 doi: 10.3969/j.issn.1002-6924.2008.04.018 |
| [5] | 曾悦, 洪华生, 曹文志, 等.九龙江流域养猪场氮磷流失特征研究[J].农业工程学报, 2005, 21(2):116-120 doi: 10.3321/j.issn:1002-6819.2005.02.025 ZENG Y, HONG H S, CAO W Z, et al. Characteristics of nitrogen and phosphorus losses from swine production systems in Jiulong River watershed[J]. Transactions of the CSAE, 2005, 21(2):116-120 doi: 10.3321/j.issn:1002-6819.2005.02.025 |
| [6] | 张锋, 胡浩, 张晖.江苏省农业面源污染与经济增长关系的实证[J].中国人口·资源与环境, 2010, 20(8):80-85 doi: 10.3969/j.issn.1002-2104.2010.08.015 ZHANG F, HU H, ZHANG H. The positive analysis on the relationship between agriculture non-point source pollution and economic growth of Jiangsu Province[J]. China Population, Resources and Environment, 2010, 20(8):80-85 doi: 10.3969/j.issn.1002-2104.2010.08.015 |
| [7] | 钟茂初.环境库兹涅茨曲线的虚幻性及其对可持续发展的现实影响[J].中国人口·资源与环境, 2005, 15(5):1-6 doi: 10.3969/j.issn.1002-2104.2005.05.001 ZHONG M C. The unreality of environmental Kuznets curves and its impact to sustainable development[J]. China Population, Resources and Environment, 2005, 15(5):1-6 doi: 10.3969/j.issn.1002-2104.2005.05.001 |
| [8] | 蒋萍, 余厚强. EKC拐点类型、形成过程及影响因素[J].财经问题研究, 2010, (6):3-9 doi: 10.3969/j.issn.1000-176X.2010.06.001 JIANG P, YU H Q. The categories, formation process and impact factors of EKC inflection points[J]. Research on Financial and Economic Issues, 2010, (6):3-9 doi: 10.3969/j.issn.1000-176X.2010.06.001 |
| [9] | 刘海英, 何彬.经济增长中环境污染路径的不确定性分析——兼论环境库兹涅茨曲线(EKC)存在的必要条件[J].工业技术经济, 2009, 28(7):77-79 doi: 10.3969/j.issn.1004-910X.2009.07.021 LIU H Y, HE B. Uncertainty analysis of non-point source pollution path in economic growth[J]. Industrial Technology & Economy, 2009, 28(7):77-79 doi: 10.3969/j.issn.1004-910X.2009.07.021 |
| [10] | 彭文斌, 田银华.湖南环境污染与经济增长的实证研究——基于VAR模型的脉冲响应分析[J].湘潭大学学报:哲学社会科学版, 2011, 35(1):31-35 http://www.wanfangdata.com.cn/details/detail.do?_type=perio&id=xtdxshkxxb201101007 PENG W B, TIAN Y H. Empirical research on environmental pollution and economic growth in Hunan Province-Based on impulse response function of VAR model[J] Journal of Xiangtan University:Philosophy and Social Sciences, 2011, 35(1):31-35 http://www.wanfangdata.com.cn/details/detail.do?_type=perio&id=xtdxshkxxb201101007 |
| [11] | 江心英, 赵爽.江苏省经济增长、产业结构与碳排放关系的实证研究——基于VAR模型和脉冲响应分析[J].南京财经大学学报, 2018, (2):16-24 http://www.wanfangdata.com.cn/details/detail.do?_type=perio&id=njjjxyxb201802003 JIANG X Y, ZHAO S. An empirical study on the relationship between economic growth, industrial structure and carbon emissions in Jiangsu Province[J]. Journal of Nanjing University of Finance and Economics, 2018, (2):16-24 http://www.wanfangdata.com.cn/details/detail.do?_type=perio&id=njjjxyxb201802003 |
| [12] | 张晖, 胡浩.农业面源污染的环境库兹涅茨曲线验证——基于江苏省时序数据的分析[J].中国农村经济, 2009, (4):48-53 http://www.wanfangdata.com.cn/details/detail.do?_type=perio&id=zgncjj200904007 ZHANG H, HU H. A verification of environmental Kuznets curve for agricultural non-point source pollution-An analysis with time series data from Jiangsu Province[J]. Chinese Rural Economy, 2009, (4):48-53 http://www.wanfangdata.com.cn/details/detail.do?_type=perio&id=zgncjj200904007 |
| [13] | 梁流涛.农村生态环境时空特征及其演变规律研究[D].南京: 南京农业大学, 2009: 75-78 http://cdmd.cnki.com.cn/article/cdmd-10307-2010173822.htm LIANG L T. Study on the temporal and spatial evolution of rural ecological environment[D]. Nanjing: Nanjing Agricultural University, 2009: 75-78 http://cdmd.cnki.com.cn/article/cdmd-10307-2010173822.htm |
| [14] | 葛继红, 周曙东.农业面源污染的经济影响因素分析——基于1978~2009年的江苏省数据[J].中国农村经济, 2011, (5):72-81 http://www.cnki.com.cn/Article/CJFDTotal-ZNJJ201105009.htm GE J H, ZHOU S D. Analysis of the economic influence factors of agricultural non-point source pollution[J]. Chinese Rural Economy, 2011, (5):72-81 http://www.cnki.com.cn/Article/CJFDTotal-ZNJJ201105009.htm |
| [15] | 陈敏鹏, 陈吉宁, 赖斯芸.中国农业和农村污染的清单分析与空间特征识别[J].中国环境科学, 2006, 26(6):751-755 doi: 10.3321/j.issn:1000-6923.2006.06.025 CHEN M P, CHEN J N, LAI S Y. Inventory analysis and spatial distribution of Chinese agricultural and rural pollution[J]. China Environmental Science, 2006, 26(6):751-755 doi: 10.3321/j.issn:1000-6923.2006.06.025 |
| [16] | 刘烨, 刘玮晶, 赵言文.江苏省农业过剩氮与农村居民消费关系拟合分析[J].水土保持通报, 2012, 32(5):82-86 http://www.wanfangdata.com.cn/details/detail.do?_type=perio&id=stbctb201205017 LIU Y, LIU W J, ZHAO Y W. Fitting analysis of relation of agricultural excessive nitrogen to rural resident consumption in Jiangsu Province[J]. Bulletin of Soil and Water Conservation, 2012, 32(5):82-86 http://www.wanfangdata.com.cn/details/detail.do?_type=perio&id=stbctb201205017 |
| [17] | 赖斯芸, 杜鹏飞, 陈吉宁.基于单元分析的非点源污染调查评估方法[J].清华大学学报:自然科学版, 2004, 44(9):1184-1187 http://www.wanfangdata.com.cn/details/detail.do?_type=perio&id=qhdxxb200409009 LAI S Y, DU P F, CHEN J N. Evaluation of non-point source pollution based on unit analysis[J]. Journal of Tsinghua University:Science and Technology, 2004, 44(9):1184-1187 http://www.wanfangdata.com.cn/details/detail.do?_type=perio&id=qhdxxb200409009 |
| [18] | Sims C A. Macroeconomics and reality[J]. Econometrica, 1980, 48(1):1-48 |
| [19] | 陈强.高级计量经济学及Stata应用[M].第2版.北京:高等教育出版社, 2014:12 CHEN Q. Advanced Econometrics and STATA Application[M]. 2nd ed. Beijing:Higher Education Press, 2014:12 |
| [20] | 焦闪闪, 张黎明, 蒋威, 等.基于1:5万土壤数据库的福建省耕地全氮储量动态变化研究[J].土壤学报, 2016, 53(5):1107-1119 http://www.cnki.com.cn/Article/CJFDTotal-TRXB201605003.htm JIAO S S, ZHANG L M, JIANG W, et al. Analysis of dynamics of deposit of total nitrogen in farmland of Fujian Province based on 1:50000 soil database[J]. Acta Pedologica Sinica, 2016, 53(5):1107-1119 http://www.cnki.com.cn/Article/CJFDTotal-TRXB201605003.htm |
