钟涨宝2,,,
田文文2
1.华中农业大学经济管理学院 武汉 430070
2.华中农业大学农村社会建设与管理研究中心 武汉 430070
基金项目: 中央高校基本科研业务费专项资金项目2662017PY023
国家自然科学基金青年项目71803145
详细信息
作者简介:丘雯文, 主要研究方向为农村改革与区域发展。E-mail:qy_wenwen@163.com
通讯作者:钟涨宝, 主要研究方向为农村改革与区域发展。E-mail:zzbemail@mail.hzau.edu.cn
中图分类号:F307.2计量
文章访问数:505
HTML全文浏览量:5
PDF下载量:1359
被引次数:0
出版历程
收稿日期:2019-09-12
录用日期:2019-12-12
刊出日期:2020-05-01
Spatio-temporal patterns and impact factors of green economic growth of agriculture in the Yangtze River Economic Belt
QIU Wenwen1, 2,,ZHONG Zhangbao2,,,
TIAN Wenwen2
1. College of Economics & Management, Huazhong Agricultural University, Wuhan 430070, China
2. Research Center for Rural Social Construction and Management, Huazhong Agricultural University, Wuhan 430070, China
Funds: the Fundamental Research Funds for the Central Universities of China2662017PY023
the National Natural Science Foundation of China71803145
More Information
Corresponding author:ZHONG Zhangbao, E-mail:zzbemail@mail.hzau.edu.cn
摘要
HTML全文
图
参考文献
相关文章
施引文献
资源附件
访问统计
摘要
摘要:加快发展方式转变,促进农业绿色增长是缓解农业污染、提高农业效率的重要举措。长江经济带是我国重要的农业生产区域和产粮基地,为科学分析长江经济带农业绿色经济增长水平及其影响因素,本文采用能值方法定量研究了2003—2017年长江经济带农业绿色生产总值。在此基础上,利用空间计量经济模型分析其时空格局与影响因素。结果表明:1)2003—2017年长江经济带农业绿色生产总值总体稳定上升,且增幅小于农业传统生产总值,农业绿色生产总值占农业传统生产总值的比重呈下降趋势。2)长江经济带农业绿色生产总值的区域差异明显,其空间格局仍未改变传统经济增长东部高、西部低的空间分布特征。3)长江经济带农业绿色增长在全局上具有显著的空间集聚特征,但这种集聚效应呈逐步减弱趋势。4)经济发展水平、科技创新能力、基础设施投资、劳动力素质和农业政策五大因素对本地区农业绿色增长产生正向影响;科技创新能力、基础设施投资对周边地区农业绿色增长产生积极作用。总体上看,长江经济带农业绿色生产总值稳定上升,且呈现“东部高、西部低”的空间分布特征;经济发展水平、科技创新能力等5大因素综合驱动该时期农业绿色增长的时空变化。
关键词:农业绿色增长/
能值分析法/
农业绿色生产总值/
空间计量模型/
长江经济带
Abstract:Accelerating the transformation of development mode and promoting the growth of green agriculture are important measures to reduce agricultural pollution and improve agricultural efficiency. The Yangtze River Economic Belt is an important agricultural production area and grain production base in China. In order to analyze the level and influential factors of agricultural green growth in the Yangtze River Economic Belt, agricultural green production was estimated from 2003 to 2017, and its spatio-temporal pattern and influencing factors were analyzed by using spatial econometric analysis methods. There were four main results. Firstly, agricultural green production value of the Yangtze River Economic Belt displayed a generally increasing trend, and the rate of increase was lower than the traditional agricultural production value. The proportion of agricultural green production value to the traditional agricultural production value displayed a downward trend. Secondly, a significant regional difference of agricultural green production value was evident in the Yangtze River Economic Belt. However, a similar pattern of traditional production value was evident, which descended from east to west. Thirdly, significant spatial cluster characteristics were observed in agricultural green growth of the Yangtze River Economic Belt. The cluster effect gradually weakened. Fourthly, the level of economic development, scientific and technological innovation, infrastructure investment, labor quality, and agricultural policy positively affected green economic growth of agriculture in the local region. Scientific and infrastructure investment positively influenced green growth of agriculture in neighboring regions. In general, agricultural green production in the Yangtze River Economic Belt displayed a steady upward trend in temporal characteristics and a downward trend from east to west in the spatial pattern. The dynamic evolution of spatio-temporal patterns of agricultural green economic development in Yangtze River Economic Belt were driven by combined effects of the impact factors.
Key words:Agricultural green economic growth/
Emergy analysis/
Agricultural green production value/
Spatial econometric model/
Yangtze River Economic Belt
HTML全文
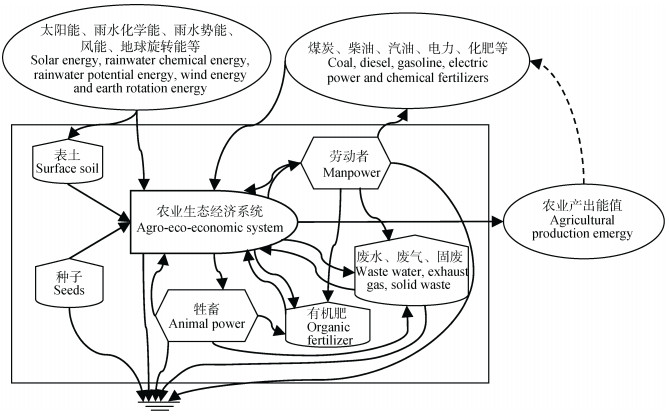
图1长江经济带农业生态经济系统能值流动示意图
Figure1.Emergy flow of agricultural eco-economic system in the Yangtze River Economic Belt
 下载: 全尺寸图片幻灯片
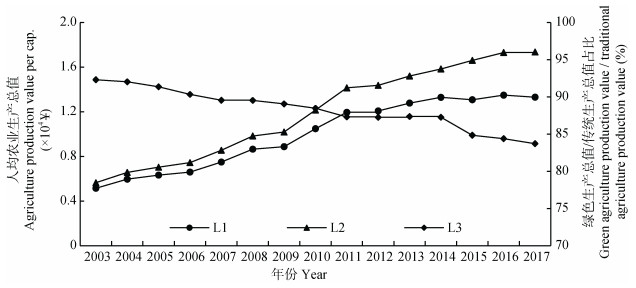
图22003—2017年长江经济带农业绿色生产总值与农业传统生产总值变化趋势
L1:人均农业绿色生产总值; L2:人均农业传统生产总值; L3:农业绿色产值占农业传统产值比重。L1: agriculture green production value per capita; L2: agriculture tradition production value per capita; L3: green agriculture production value / traditional agriculture production value.
Figure2.Trends of agricultural green production value and agricultural traditional production value in the Yangtze River Economic Belt from 2003 to 2017
下载: 全尺寸图片幻灯片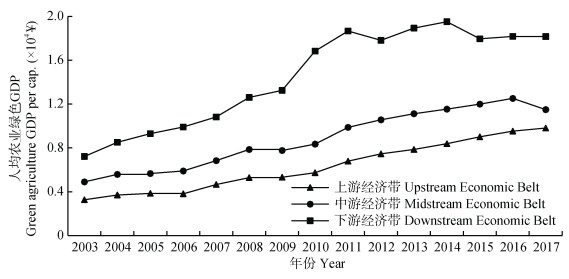
图32003—2017年长江经济带各区域农业绿色生产总值变化趋势
Figure3.Trends of agricultural green production value in various regions of the Yangtze River Economic Belt from 2003 to 2017
下载: 全尺寸图片幻灯片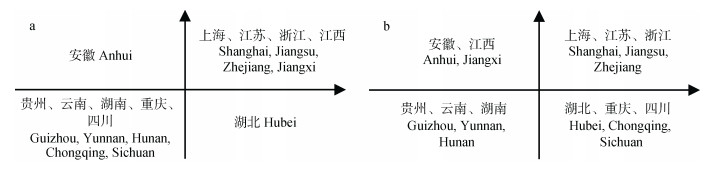
图42003年(a)和2017年(b)长江经济带农业绿色生产总值的Moran散点图
Figure4.Moran scatter plots of agricultural green production value in the Yangtze River Economic Belt in 2003 (a) and 2017 (b)
下载: 全尺寸图片幻灯片表1长江经济带农业生态经济系统能值分析指标
Table1.Emergy indexes of agricultural eco-economic system in the Yangtze River Economic Belt
| 项目Item | 指标Index | 核算方法Expression |
| 可更新环境资源 Renewable resource emergy | 太阳能、雨水化学能、雨水势能、风能、地球旋转能等能值输入 Emergy input of solar energy, rainwater chemical energy, rainwater potential energy, wind energy and earth rotation energy | 蓝盛芳等[16]; Ulgiati等[20] Lan S F, et al[16]; Ulgiati, et al [20] |
| 不可更新自然资源 Non-renewable resource emergy | 表土层净损耗能值 Net emergy loss value of surface soil layer | 蓝盛芳等[16]; Ulgiati等[20] Lan S F, et al[16]; Ulgiat, et al[20] |
| 不可更新工业辅助能 Non-renewable industrial supplementary emergy | 煤炭、柴油、汽油、电力、化肥等能值输入 Emergy input of coal, diesel, gasoline, electric power and chemical fertilizers | 工业辅助产品消耗量×能值折算系数×能值转换率[21] Consumption of industrial auxiliaries × energy conversion coefficient × solar emergy conversion rate[21] |
| 可更新有机能 Renewable organic emergy | 种子、有机肥、饲料、畜力、人力等能值输入 Emergy input of seed, organic fertilizer, feed, animal power, and manpower | 可更新产品消耗量×能值折算系数×能值转换率[21] Renewable product consumption × energy conversion coefficient × solar emergy conversion rate[21] |
| 可更新资源产品 Agricultural production emergy | 种植业、林业、畜牧业、渔业产品等能值产出 Emergy output of various crop, forestry, animal husbandry and fishery products | 产品生产量×能值折算系数×能值转换率[21] Agricultural production × energy conversion coefficient × solar emergy conversion rate[21] |
| 废弃物 Environmental emergy loss (waste stream) | 废水、废气、固体废弃物等能值输出 Emergy output of waste water, exhaust gas, solid waste | 废弃物排放量×能值折算系数×能值转换率, 废弃物排放采用清单分析法进行计算[22] Agricultural pollution emissions × energy conversion coefficient × solar emergy conversion rate. Waste pollution was calculated by inventory analysis[22] |
下载: 导出CSV表22003—2017年长江经济带农业绿色生产总值的全局空间自相关
Table2.Total spatial autocorrelation of agricultural green production value in the Yangtze River Economic Belt from 2003 to 2017
| 年份Year | Moran’s I | SD(I) | Z | P |
| 2003 | 0.433 | 0.181 | 2.978 | 0.002 |
| 2004 | 0.435 | 0.183 | 2.927 | 0.001 |
| 2005 | 0.426 | 0.169 | 3.040 | 0.001 |
| 2006 | 0.412 | 0.171 | 2.555 | 0.007 |
| 2007 | 0.330 | 0.174 | 2.447 | 0.007 |
| 2008 | 0.317 | 0.168 | 2.443 | 0.006 |
| 2009 | 0.403 | 0.175 | 2.882 | 0.003 |
| 2010 | 0.426 | 0.165 | 3.184 | 0.001 |
| 2011 | 0.395 | 0.172 | 2.932 | 0.003 |
| 2012 | 0.424 | 0.171 | 2.930 | 0.003 |
| 2013 | 0.474 | 0.189 | 3.039 | 0.002 |
| 2014 | 0.487 | 0.187 | 3.137 | 0.001 |
| 2015 | 0.499 | 0.191 | 3.131 | 0.006 |
| 2016 | 0.443 | 0.197 | 2.782 | 0.011 |
| 2017 | 0.399 | 0.204 | 2.428 | 0.011 |
下载: 导出CSV表3长江经济带农业绿色生产总值空间计量模型估计结果
Table3.Spatial econometric results of agricultural green production value in the Yangtze River Economic Belt
| 变量 Variables | 回归系数 Coefficient | Z值 Z value |
| PGDP | 0.408*** | 3.31 |
| CRE | 0.366* | 1.77 |
| INV | 0.086*** | 3.23 |
| PIR | 0.255* | 1.95 |
| DIS | 0.051 | 0.95 |
| AP | 0.163* | 1.80 |
| ρ | -0.807*** | -3.60 |
| R2 | 0.324 | |
| LM-error | 37.324*** | |
| Wald-lag | 23.92** | |
| LR-lag | 16.78** | |
| W×PGDP | 0.552 | 0.77 |
| W×CRE | 0.791* | 1.78 |
| W×INV | 0.226* | 1.82 |
| W×PIR | 0.531 | 1.62 |
| W×DIS | 0.198 | 0.01 |
| W×AP | 0.006 | 1.50 |
| Sigma2 | 8.694*** | 8.99 |
| LogL | 465.670 | |
| LM-lag | 38.473*** | |
| Wald-error | 21.13** | |
| LR-error | 15.42** | |
| PGDP:经济发展水平; CRE:农业科技创新能力; INV:农村基础设施投资; PIR:劳动力素质; DIS:抗灾能力; AP:农业政策; W:空间滞后项; ρ:滞后项系数; R2:决定系数; LogL:似然比; LM-error:拉格朗日乘子误差; LM-lag:拉格朗日乘子滞后; LR-error:似然比误差; LR-lag:似然比滞后; Wald-error: Wald误差; Wald-lag: Wald滞后。***、**和*分别表示1%、5%和10%水平显著。PGDP: economic development level; CRE: scientific and technological innovation ability; INV: agricultural infrastructure investment; PIR: quality of labor force; DIS: disaster resistance capacity; AP: agricultural policy; W: spatial lag term; ρ: parameter of spatial lag term; R2: coefficient of determination; LogL: log likelihood; LM-error: Lagrange multiplier error; LM-lag: Lagrange multiplier lag; LR-error: likelihood ratio-error; LR-lag: likelihood ratio-lag; Wald-error: Wald error test; Wald-lag: Wald lag test. ***, ** and * respectively represent the significance level test by 1%, 5% and 10%. | ||
下载: 导出CSV表4长江经济带农业绿色生产总值各影响因素的直接效应、间接效应和总效应检验结果
Table4.Direct effect, indirect effect and total effect of each influencing factor of agricultural green production value in the Yangtze River Economic Belt
| 变量 Variables | 总效应 Total effect | 直接效应 Direct effect | 间接效应 Indirect effect | ||||
| 效应 Effect | Z值 Z value | 效应 Effect | Z值 Z value | ||||
| PGDP | 1.056*** | 0.472*** | 3.28 | 0.584 | 0.97 | ||
| CRE | 1.008** | 0.213* | 1.94 | 0.795** | 2.08 | ||
| INV | 0.664** | 0.024** | 2.25 | 0.639* | 1.84 | ||
| PIR | 0.468* | 0.228** | 2.11 | 0.240 | 1.37 | ||
| DIS | 0.191 | 0.025 | 0.77 | 0.166 | 0.22 | ||
| AP | 0.188** | 0.156** | 1.96 | 0.032 | 0.35 | ||
| PGDP:经济发展水平; CRE:农业科技创新能力; INV:农村基础设施投资; PIR:劳动力素质; DIS:抗灾能力; AP:农业政策。***、**和*分别表示1%、5%和10%水平显著。PGDP: economic development level; CRE: scientific and technological innovation ability; INV: agricultural infrastructure investment; PIR: quality of labor force; DIS: disaster resistance capacity; AP: agricultural policy. ***, ** and * respectively represent the significance level test by 1%, 5% and 10%. | |||||||
下载: 导出CSV参考文献
| [1] | 黄季焜.中国农业的过去和未来[J].管理世界, 2004, (3):95-104 http://d.old.wanfangdata.com.cn/Periodical/szzyjsxyxb200301005 HUANG J K. The past and future of China's agriculture[J]. Management World, 2004, (3):95-104 http://d.old.wanfangdata.com.cn/Periodical/szzyjsxyxb200301005 |
| [2] | 盛来运, 付凌晖.转型期农业发展对经济增长的影响[J].中国农村经济, 2014, (1):4-12 http://d.old.wanfangdata.com.cn/Periodical/cjj201821011 SHENG L Y, FU L H. The impact of agricultural development on economic growth during the transition period[J]. Chinese Rural Economy, 2014, (1):4-12 http://d.old.wanfangdata.com.cn/Periodical/cjj201821011 |
| [3] | 李谷成.中国农业的绿色生产率革命:1978—2008年[J].经济学(季刊), 2014, 13(2):537-558 http://d.old.wanfangdata.com.cn/Periodical/jjx201401006 LI G C. The green productivity revolution of agriculture in China from 1978 to 2008[J]. China Economic Quarterly, 2014, 13(2):537-558 http://d.old.wanfangdata.com.cn/Periodical/jjx201401006 |
| [4] | 吴传清, 董旭.环境约束下长江经济带全要素能源效率研究[J].中国软科学, 2016, (3):73-83 http://www.wanfangdata.com.cn/details/detail.do?_type=perio&id=zgrkx201603007 WU C Q, DONG X. Analysis on influencing factors of total factor energy efficiency in the Yangtze River Economic Belt under environmental constraints[J]. China Soft Science, 2016, (3):73-83 http://www.wanfangdata.com.cn/details/detail.do?_type=perio&id=zgrkx201603007 |
| [5] | 陈源泉, 高旺盛.基于农业生态服务价值的农业绿色GDP核算——以安塞县为例[J].生态学报, 2007, 27(1):250-259 http://www.wanfangdata.com.cn/details/detail.do?_type=perio&id=stxb200701030 CHEN Y Q, GAO W S. Green accounting for agriculture production based on the value of agroecosystem services:A case study of Ansai County[J]. Acta Ecologica Sinica, 2007, 27(1):250-259 http://www.wanfangdata.com.cn/details/detail.do?_type=perio&id=stxb200701030 |
| [6] | 陈梦根.绿色GDP理论基础与核算思路探讨[J].中国人口·资源与环境, 2005, 15(1):3-7 http://d.old.wanfangdata.com.cn/Periodical/zgrkzyyhj200501003 CHEN M G. A gross economic indicator under sustainable development:Green GDP[J]. China Population, Resources and Environment, 2005, 15(1):3-7 http://d.old.wanfangdata.com.cn/Periodical/zgrkzyyhj200501003 |
| [7] | 李兆亮, 罗小锋, 张俊飚, 等.基于能值的中国农业绿色经济增长与空间收敛[J].中国人口·资源与环境, 2016, 26(11):150-159 http://d.old.wanfangdata.com.cn/Periodical/zgrkzyyhj201611019 LI Z L, LUO X F, ZHANG J B, et al. Green economy growth of agriculture and its spatial convergence in China based on energy analytic approach[J]. China Population, Resources and Environment, 2016, 26(11):150-159 http://d.old.wanfangdata.com.cn/Periodical/zgrkzyyhj201611019 |
| [8] | NORDHAUS W D, TOBIN J. Economic research: retrospect and prospect[M]. Economic Growth. Cambridge: NBER, 1972: 1-80 |
| [9] | DALY H E, COBB J B JR. For the Common Good:Redirecting the Economy toward Community, the Environment, and a Sustainable Future[M]. Boston:Beacon Press, 1989:401-455 |
| [10] | PALM V, LARSSON M. Economic instruments and the environmental accounts[J]. Ecological Economics, 2007, 61(4):684-692 http://cn.bing.com/academic/profile?id=95cc950e676c9f9b827d3b413f7f46e0&encoded=0&v=paper_preview&mkt=zh-cn |
| [11] | 王立彦.建立社会核算与国民经济核算的联系[J].经济科学, 1992, 14(5):6-12 http://www.cnki.com.cn/Article/CJFDTotal-JJKX199205001.htm WANG L Y. Establishing links between social accounting and national economic accounting[J]. Economic Science, 1992, 14(5):6-12 http://www.cnki.com.cn/Article/CJFDTotal-JJKX199205001.htm |
| [12] | 雷明.中国环境经济综合核算[J].中国软科学, 1999, (11):95-101 http://d.old.wanfangdata.com.cn/Periodical/xtgcllysj200011001 LEI M. Environment and economy synthesis accounts in China[J]. China Soft Science, 1999, (11):95-101 http://d.old.wanfangdata.com.cn/Periodical/xtgcllysj200011001 |
| [13] | 程莹莹, 张开华.农业绿色GDP测算方法初探和实证[J].中国科技论坛, 2013, (9):128-132 http://d.old.wanfangdata.com.cn/Periodical/zgkjlt201309021 CHENG Y Y, ZHANG K H. The abecedarian discussion and empirical analysis about green agricultural accounting[J]. Forum on Science and Technology in China, 2013, (9):128-132 http://d.old.wanfangdata.com.cn/Periodical/zgkjlt201309021 |
| [14] | 李裕瑞, 杨乾龙, 曹智.长江经济带农业发展的现状特征与模式转型[J].地理科学进展, 2015, 34(11):1458-1469 http://d.old.wanfangdata.com.cn/Periodical/dlkxjz201511013 LI Y R, YANG Q L, CAO Z. Current status and pattern transformation of agricultural development in the Yangtze River Economic Belt[J]. Progress in Geography, 2015, 34(11):1458-1469 http://d.old.wanfangdata.com.cn/Periodical/dlkxjz201511013 |
| [15] | 王维, 张涛, 王晓伟, 等.长江经济带城市生态承载力时空格局研究[J].长江流域资源与环境, 2017, 26(12):1963-1971 http://d.old.wanfangdata.com.cn/Periodical/cjlyzyyhj201712004 WANG W, ZHANG T, WANG X W, et al. Spatial and temporal pattern of urban ecological carrying capacity in Yangtze River Economic Zone[J]. Resources and Environment in the Yangtze Basin, 2017, 26(12):1963-1971 http://d.old.wanfangdata.com.cn/Periodical/cjlyzyyhj201712004 |
| [16] | 蓝盛芳, 钦佩.生态系统的能值分析[J].应用生态学报, 2001, 12(1):129-131 http://d.old.wanfangdata.com.cn/Periodical/yystxb200101030 LAN S F, QIN P. Emergy analysis of ecosystems[J]. Chinese Journal of Applied Ecology, 2001, 12(1):129-131 http://d.old.wanfangdata.com.cn/Periodical/yystxb200101030 |
| [17] | ODUM H T. Environmental Accounting:Emergy and Environmental Decision Making[M]. New York:John Wiley & Soon, 1996:163-168 |
| [18] | 《农业技术经济手册》编委会.农业技术经济手册[M].北京:农业出版社, 1983' Handbook of Agricultural Technology Economic' Editorial Board. Hand Book of Agricultural Technology Economic[M]. Beijing:Agriculture Press, 1983 |
| [19] | 陈阜.农业生态学[M].北京:中国农业大学出版社, 2004 CHEN F. Agricultural Ecology[M]. Beijing:China Agricultural University Press, 2004 |
| [20] | ULGIATI S, ODUM H T, BASTIANONI S. Emergy use, environmental loading and sustainability an emergy analysis of Italy[J]. Ecological Modelling, 1994, 73(3/4):215-268 http://cn.bing.com/academic/profile?id=f55646c6b83eb131120f5e1c68376206&encoded=0&v=paper_preview&mkt=zh-cn |
| [21] | 姚成胜, 黄琳, 吕晞, 等.基于能值理论的中国耕地利用集约度时空变化分析[J].农业工程学报, 2014, 30(8):1-12 http://d.old.wanfangdata.com.cn/Periodical/nygcxb201408001 YAO C S, HUANG L, LYU X, et al. Temporal and spatial change of cultivated land use intensity in China based on emergy theory[J]. Transactions of the Chinese Society of Agricultural Engineering, 2014, 30(8):1-12 http://d.old.wanfangdata.com.cn/Periodical/nygcxb201408001 |
| [22] | 丘雯文, 钟涨宝, 李兆亮, 等.中国农业面源污染排放格局的时空特征[J].中国农业资源与区划, 2019, 40(1):26-34 http://d.old.wanfangdata.com.cn/Periodical/zgnyzyyqh201901004 QIU W W, ZHONG Z B, LI Z L, et al. Spatial-temporal variations of agricultural non-point source pollution in China[J]. Chinese Journal of Agricultural Resources and Regional Planning, 2019, 40(1):26-34 http://d.old.wanfangdata.com.cn/Periodical/zgnyzyyqh201901004 |
| [23] | ANSELIN L. Spatial Econometrics:Methods and Models[M]. Dordrecht, Netherlands:Springer, 1988 |
| [24] | PARENT O, LESAGE J P. Using the variance structure of the conditional autoregressive spatial specification to model knowledge spillovers[J]. Journal of Applied Econometrics, 2008, 23(2):235-256 http://www.wanfangdata.com.cn/details/detail.do?_type=perio&id=10.1002/jae.981 |
| [25] | LESAGE J P, SHENG Y X. A spatial econometric panel data examination of endogenous versus exogenous interaction in Chinese province-level patenting[J]. Journal of Geographical Systems, 2014, 16(3):233-262 http://www.wanfangdata.com.cn/details/detail.do?_type=perio&id=d3d37a29425982f229f6c53ebb8c3294 |
| [26] | LESAGE J P, CASHELL B A. A comparison of vector autoregressive forecasting performance:Spatial versus non-spatial Bayesian priors[J]. The Annals of Regional Science, 2015, 54(2):533-560 http://cn.bing.com/academic/profile?id=e0712f518c1400c9ec83cea7310dcc3f&encoded=0&v=paper_preview&mkt=zh-cn |
| [27] | MUSVOTO C, NORTJE K. The socio-economic context of green economy implementation in the agriculture sector[M]//MUSVOTO C, NORTJE K, NAHMAN A, et al. Green Economy Implementation in the Agriculture Sector. Cham: Springer, 2018: 13-39 |
| [28] | SHEN Z Y, BALE?ENTIS T, CHEN X L, et al. Green growth and structural change in Chinese agricultural sector during 1997-2014[J]. China Economic Review, 2018, 51:83-96 http://www.wanfangdata.com.cn/details/detail.do?_type=perio&id=4b5d6358651b84d40460d7c2d4e37581 |
| [29] | 张可, 汪东芳.经济集聚与环境污染的交互影响及空间溢出[J].中国工业经济, 2014, (6):70-82 http://d.old.wanfangdata.com.cn/Periodical/gdjj201614183 ZHANG K, WANG D F. The interaction and spatial spillover between agglomeration and pollution[J]. China Industrial Economics, 2014, (6):70-82 http://d.old.wanfangdata.com.cn/Periodical/gdjj201614183 |
| [30] | 黄季焜, 胡瑞法.中国农业科研投资:效益、利益分配及政策含义[J].中国软科学, 2000, (9):21-24 http://d.old.wanfangdata.com.cn/Periodical/zgkjlt200906024 HUANG J K, HU R F. China's agricultural research investment:Return, welfare distribution and policy implications[J]. China Soft Science, 2000, (9):21-24 http://d.old.wanfangdata.com.cn/Periodical/zgkjlt200906024 |
| [31] | 陆铭, 向宽虎.地理与服务业——内需是否会使城市体系分散化?[J].经济学(季刊), 2012, 11(3):1079-1096 http://cpfd.cnki.com.cn/Article/CPFDTOTAL-BDGF201204002014.htm LU M, XIANG K H. Geography and service:Does domestic demand disperse China's urban system?[J]. China Economic Quarterly, 2012, 11(3):1079-1096 http://cpfd.cnki.com.cn/Article/CPFDTOTAL-BDGF201204002014.htm |
| [32] | 刘修岩.空间效率与区域平衡:对中国省级层面集聚效应的检验[J].世界经济, 2014, 37(1):55-80 http://d.old.wanfangdata.com.cn/Periodical/yncmxyxb201602004 LIU X Y. Spatial efficiency and regional balance:An examination of the agglomeration effect at the provincial level in China[J]. The Journal of World Economy, 2014, 37(1):55-80 http://d.old.wanfangdata.com.cn/Periodical/yncmxyxb201602004 |
| [33] | 黄炎忠, 罗小锋, 李兆亮.我国农业绿色生产水平的时空差异及影响因素[J].中国农业大学学报, 2017, 22(9):183-190 http://d.old.wanfangdata.com.cn/Periodical/zgnydxxb201709022 HUANG Y Z, LUO X F, LI Z L. Analysis on spatial-temporal differences and influence factors of agricultural green production level in China[J]. Journal of China Agricultural University, 2017, 22(9):183-190 http://d.old.wanfangdata.com.cn/Periodical/zgnydxxb201709022 |
| [34] | ZIVIN J G, NEIDELL M. The impact of pollution on worker productivity[J]. American Economic Review, 2012, 102(7):3652-3673 http://cn.bing.com/academic/profile?id=2c65a41527445e3bb5277e4f035cad1c&encoded=0&v=paper_preview&mkt=zh-cn |
| [35] | RECHA C W, MUKOPI M N, OTIENO J O. Socio-economic determinants of adoption of rainwater harvesting and conservation techniques in semi-arid Tharaka sub-county, Kenya[J]. Land Degradation & Development, 2015, 26(7):765-773 http://www.wanfangdata.com.cn/details/detail.do?_type=perio&id=27c101b9ff9c2b43bbda23854f3e314f |
| [36] | 陈飞, 范庆泉, 高铁梅.农业政策、粮食产量与粮食生产调整能力[J].经济研究, 2010, 45(11):101-114 http://www.wanfangdata.com.cn/details/detail.do?_type=perio&id=jjyj201011008 CHEN F, FAN Q Q, GAO T M. Agricultural policies, food production and food production-adjustment ability[J]. Economic Research Journal, 2010, 45(11):101-114 http://www.wanfangdata.com.cn/details/detail.do?_type=perio&id=jjyj201011008 |
| [37] | 胡川, 韦院英, 胡威.农业政策、技术创新与农业碳排放的关系研究[J].农业经济问题, 2018, (9):66-75 http://www.wanfangdata.com.cn/details/detail.do?_type=perio&id=nyjjwt201809007 HU C, WEI Y Y, HU W. Research on the relationship between agricultural policy, technological innovation and agricultural carbon emissions[J]. Issues in Agricultural Economy, 2018, (9):66-75 http://www.wanfangdata.com.cn/details/detail.do?_type=perio&id=nyjjwt201809007 |
| [38] | 刘永强, 龙花楼.长江中游经济带土地利用转型时空格局及其生态服务功能影响[J].经济地理, 2017, 37(11):161-170 http://d.old.wanfangdata.com.cn/Periodical/jjdl201711020 LIU Y Q, LONG H L. Study on the spatio-temporal patterns of land use transition and its impact on ecological service function of the middle of Yangtze River Economic Belt[J]. Economic Geography, 2017, 37(11):161-170 http://d.old.wanfangdata.com.cn/Periodical/jjdl201711020 |
| [39] | 闫逢柱, 苏李, 乔娟.产业集聚发展与环境污染关系的考察——来自中国制造业的证据[J].科学学研究, 2011, 29(1):79-83 http://www.wanfangdata.com.cn/details/detail.do?_type=perio&id=kxxyj201101013 YAN F Z, SU L, QIAO J. The exploration of the relationship between the industrial agglomeration's developments and the environmental pollution — the evidence from the manufacturing in China[J]. Studies in Science of Science, 2011, 29(1):79-83 http://www.wanfangdata.com.cn/details/detail.do?_type=perio&id=kxxyj201101013 |
