苏时鹏1,
余文梦2,
孙小霞1,,
1.福建农林大学农村区域竞争力研究中心 福州 350002
2.中国人民大学环境学院 北京 100872
基金项目: 教育部人文社科项目15YJCZH153
国家自然科学基金项目71273051
福建省社科规划重大项目FJ2017Z003
详细信息
作者简介:雷俊华, 主要研究方向为自然资源与环境管理。E-mail:junhuaray@163.com
通讯作者:孙小霞, 主要研究方向为农业生态管理。E-mail:joesxiaox@163.com
中图分类号:S19计量
文章访问数:264
HTML全文浏览量:3
PDF下载量:211
被引次数:0
出版历程
收稿日期:2019-12-29
录用日期:2020-03-25
刊出日期:2020-07-01
Temporal and spatial pattern evolution and grouping prediction of non-point source pollution of chemical fertilizers in China
LEI Junhua1,,SU Shipeng1,
YU Wenmeng2,
SUN Xiaoxia1,,
1. Research Center for Rural Regional Competitiveness, Fujian Agriculture and Forestry University, Fuzhou 350002, China
2. School of Environment & Natural Resources, Renmin University of China, Beijing 100872, China
Funds: the Humanities and Social Science Project of the Ministry of Education of China15YJCZH153
the National Natural Science Foundation of China71273051
the Social Science Planning Major Project of Fujian ProvinceFJ2017Z003
More Information
Corresponding author:SUN Xiaoxia, E-mail: joesxiaox@163.com
摘要
HTML全文
图
参考文献
相关文章
施引文献
资源附件
访问统计
摘要
摘要:减少化肥面源污染的同时保持农业产值持续增长是实现农业产业生态化和农业高质量发展的必然要求。中国各省均制定并实施了化肥零增长行动计划,但进展和成效并不一致,并可能相互影响。论文运用化肥流失系数法对中国1997—2018年31个省(市、自治区)化肥面源污染排放强度进行核算,再运用空间自相关和热点分析对其进行时空格局演变分析,揭示化肥面源污染的时空演变规律,探讨区域间的相互影响。根据时空格局特征将全国分为热点区、冷点区和非热(冷)点区,在考虑相邻省份间空间异质性和相关性的条件下,分组模拟和预测化肥面源污染排放强度与人均农业产值间的环境库兹涅茨曲线(EKC)时间路径。结果表明:1)化肥面源污染排放强度省际差异较大,表现为空间正自相关,呈集聚模式。热点分析显示,化肥面源污染时空格局相对稳定,热点区主要集中在中南部,长江中下游地区尤其显著,黄淮海地区近年热点程度下降较明显;冷点区主要集中在西部地区和黑龙江。2)基于时空格局分组的环境库兹涅茨曲线(EKC)趋势模拟表明,各组均存在显著的非线性EKC关系但趋势和拐点差异明显,热点区为“倒U型”,冷点区和非热(冷)点区为“倒N型”,多数省份正处于曲线上升阶段且距拐点较远。3)产业结构的调整和转移促使区域间存在化肥面源污染空间溢出效应,要从整体上把握区域间的协同治理。根据研究结果,提出热点区应研发推广适用施肥设备,提高化肥利用率;冷点区应保护性耕作,增施有机肥;非热(冷)点区应合理调整农业产业结构,注重种养循环。区域间则应当通过生态补偿、排污权交易等方式实现协同治理。
关键词:化肥面源污染/
时空格局演变/
空间相关性/
环境库兹涅茨曲线(EKC)/
分组预测
Abstract:Reducing pollution caused by chemical fertilizers while continuously increasing the output value of agriculture at the same time is an inevitable requirement to improve high quality development of agriculture. Actions aimed at achieving zero growth in chemical fertilizer use have been formulated and implemented in provinces across China. However, inconsistencies in progress and effectiveness among provinces may affect each other. The fertilizer loss coefficient method was used to calculate the emission intensity of non-point source pollution in 31 provinces across the Chinese mainland from 1997 to 2018. Spatial autocorrelation and hotspot analysis methods, based on the calculated emission intensity, were used to reveal the emission intensity temporal and spatial characteristics, and to analyze the interaction effect on neighboring provinces. According to these characteristics, the country was grouped into three regions: a hot spot region, a cold spot region, and a non-hot (cold) spot region. Then, the Environmental Kuznets Curve (EKC) trend between the non-point source pollution emission intensity of fertilizers and the per capita agricultural output value in each group was simulated and predicted under spatial heterogeneity and spatial correlation conditions. The results showed that the emission intensity varied considerably among provinces across the country. The emission intensity was spatially positively autocorrelated across the country with a cluster mode. A hot spot analysis showed that the spatiotemporal pattern for non-point source pollution caused by fertilizers was relatively stable. The hot spot region was mainly concentrated in the central and southern parts of China, especially in the middle and lower reaches of the Yangtze River. However, in recent years, the number of hotspots in the Huanghuaihai region had significantly decreased. The cold spot region was mainly concentrated in the western region and Heilongjiang Province. The EKC trend simulation, based on temporal and spatial pattern feature grouping, showed that there was a significant nonlinear EKC relationship between agricultural economic growth and chemical fertilizer non-point source pollution in each group. However, the trend and the inflection point of each curve were clearly different. The hot spot region appeared as an "inverted U-type" curve, but both the cold spot region and the non-hot (cold) spot region had "inverted N-type" curves. Most provinces in each region were in the ascending phase of the curves. Industrial structure adjustment and industrial transfer promoted the spatial spillover effect of fertilizer derived non-point source pollution among the regions. Therefore, coordinated governance among regions needs to be introduced. Based on the above results, we propose that there should be corresponding policy implications, and that suitable fertilization equipment should be developed and promoted to increase fertilizer utilization in the hot spot region. Conservation farming should be applied and the use of organic fertilizer promoted in the cold spot region. The non-hot (cold) spot region should reasonably adjust the structure of its agricultural industry and focus on the crop-livestock and poultry farming cycle. Ecological compensation and emissions trading should be implemented to achieve collaborative governance.
Key words:Fertilizer non-point source pollution/
Spatio-temporal pattern evolution/
Spatial correlation/
Environmental Kuznets Curve (EKC)/
Group prediction
HTML全文
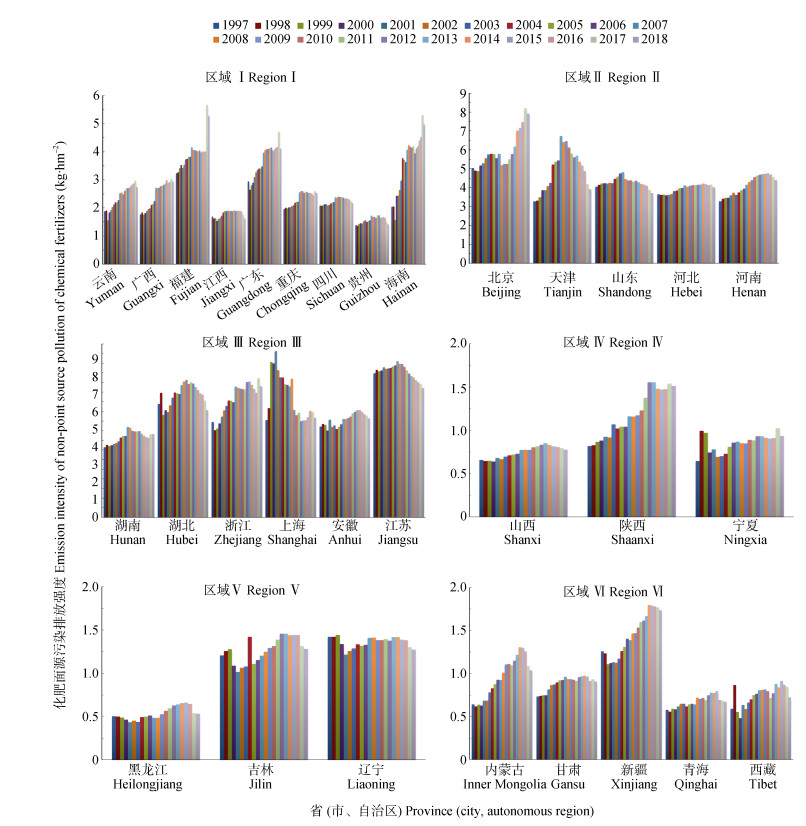
图11997—2018年各分区化肥面源污染排放强度
Figure1.Emission intensities of non-point source pollution of chemical fertilizers in different regions from 1997 to 2018
 下载: 全尺寸图片幻灯片
表1中国31省(市、自治区)化肥流失情况分区表
Table1.Fertilizer loss rate in different regions of China
| 区域类别 Regional category | 省(市、自治区) Province (city, autonomous region) | 流失系数(η) Loss coefficient (%) | ||||
| 总氮 Total N | 总磷 Total P | 硝态氮 ${\rm{NO}}_{\rm{3}}^ - {\rm{ - N}}$ | 氨态氮 ${\rm{NH}}_{\rm{4}}^ + {\rm{ - N}}$ | 可溶性总磷 Dissolved total phosphorus | ||
| Ⅰ | 云南、广西、福建、江西、广东、重庆、四川、贵州、海南 Yunnan, Guangxi, Fujian, Jiangxi, Guangdong, Chongqing, Sichuan, Guizhou, Hainan | 0.868 | 0.497 | 0.239 | 0.149 | 0.086 |
| Ⅱ | 北京、天津、山东、河北、河南Beijing, Tianjin, Shandong, Hebei, Henan | 1.173 | 0.199 | 0.489 | 0.122 | 0.041 |
| Ⅲ | 湖南、湖北、浙江、上海、安徽、江苏 Hunan, Hubei, Zhejiang, Shanghai, Anhui, Jiangsu | 1.536 | 0.410 | 0.867 | 0.147 | 0.147 |
| Ⅳ | 山西、陕西、宁夏Shanxi, Shaanxi, Ningxia | 0.293 | 0.215 | 0.05 | 0.041 | 0.039 |
| Ⅴ | 黑龙江、吉林、辽宁Heilongjiang, Jilin, Liaoning | 0.422 | 0.096 | 0.133 | 0.054 | 0.012 |
| Ⅵ | 内蒙古、甘肃、新疆、青海、西藏 Inner Mongolia, Gansu, Xinjiang, Qinghai, Tibet | 0.511 | 0.108 | 0.184 | 0.025 | 0 |
下载: 导出CSV表21997—2018年各省(市、自治区)化肥面源污染排放强度Global Moran’s I值
Table2.Global Moran's I values of chemical fertilizer non-point source pollution emission intensity in various provinces (citiesmunicipalities, autonomous regions) from 1997 to 2018
| 年份 Year | Moran’s I | Z得分 Z score | P值 P value |
| 1997 | 0.396 | 5.551 | 0.000 |
| 1998 | 0.385 | 5.421 | 0.000 |
| 1999 | 0.417 | 5.884 | 0.000 |
| 2000 | 0.404 | 5.688 | 0.000 |
| 2001 | 0.411 | 5.805 | 0.000 |
| 2002 | 0.409 | 5.717 | 0.000 |
| 2003 | 0.406 | 5.659 | 0.000 |
| 2004 | 0.395 | 5.498 | 0.000 |
| 2005 | 0.404 | 5.607 | 0.000 |
| 2006 | 0.407 | 5.643 | 0.000 |
| 2007 | 0.386 | 5.361 | 0.000 |
| 2008 | 0.378 | 5.266 | 0.000 |
| 2009 | 0.364 | 5.081 | 0.000 |
| 2010 | 0.368 | 5.133 | 0.000 |
| 2011 | 0.373 | 5.194 | 0.000 |
| 2012 | 0.371 | 5.161 | 0.000 |
| 2013 | 0.374 | 5.193 | 0.000 |
| 2014 | 0.368 | 5.120 | 0.000 |
| 2015 | 0.364 | 5.070 | 0.000 |
| 2016 | 0.357 | 4.988 | 0.000 |
| 2017 | 0.307 | 4.352 | 0.000 |
| 2018 | 0.310 | 4.400 | 0.000 |
下载: 导出CSV表31997—2018年各省(市、自治区)化肥面源污染排放强度空间格局分布
Table3.Spatial pattern of chemical fertilizer non-point source pollution emission intensity in different provinces (cities, autonomous regions) from 1997 to 2018
| 省(市、自治区) Province (city, autonomous region) | 热(冷)点置信度Hot (cold) point confident coefficient (%) | |||||
| 1997 | 2003 | 2007 | 2009 | 2014 | 2018 | |
| 上海Shanghai | 99 | 99 | 99 | 99 | 99 | 99 |
| 江苏Jiangsu | 99 | 99 | 99 | 99 | 99 | 99 |
| 浙江Zhejiang | 99 | 99 | 99 | 99 | 99 | 99 |
| 安徽Anhui | 99 | 99 | 99 | 99 | 99 | 99 |
| 福建Fujian | 99 | 99 | 99 | 99 | 99 | 99 |
| 江西Jiangxi | 99 | 99 | 99 | 95 | 95 | 95 |
| 河南Henan | 99 | 99 | 99 | 99 | 99 | 95 |
| 湖北Hubei | 99 | 99 | 99 | 99 | 99 | 99 |
| 湖南Hunan | 95 | 95 | 95 | 95 | 95 | 95 |
| 山东Shandong | 95 | 95 | 90 | 90 | 90 | 0 |
| 北京Beijing | 90 | 90 | 0 | 0 | 0 | 0 |
| 天津Tianjin | 90 | 90 | 0 | 0 | 0 | 0 |
| 河北Hebei | 90 | 90 | 0 | 0 | 0 | 0 |
| 广东Guangdong | 0 | 0 | 0 | 90 | 0 | 90 |
| 西藏Tibet | -90 | -90 | -90 | -90 | -90 | -90 |
| 甘肃Gansu | -95 | -95 | -95 | -95 | -99 | -95 |
| 青海Qinghai | -95 | -95 | -95 | -95 | -95 | -95 |
| 黑龙江Heilongjiang | 0 | -90 | -90 | -90 | -90 | -90 |
| 山西Shanxi | 0 | 0 | 0 | 0 | 0 | 0 |
| 内蒙古Inner Mongolia | 0 | 0 | 0 | 0 | 0 | 0 |
| 辽宁Liaoning | 0 | 0 | 0 | 0 | 0 | 0 |
| 吉林Jilin | 0 | 0 | 0 | 0 | 0 | 0 |
| 广西Guangxi | 0 | 0 | 0 | 0 | 0 | 0 |
| 海南Hainan | 0 | 0 | 0 | 0 | 0 | 0 |
| 重庆Chongqing | 0 | 0 | 0 | 0 | 0 | 0 |
| 四川Sichuan | 0 | 0 | 0 | 0 | 0 | 0 |
| 贵州Guizhou | 0 | 0 | 0 | 0 | 0 | 0 |
| 云南Yunnan | 0 | 0 | 0 | 0 | 0 | 0 |
| 陕西Shaanxi | 0 | 0 | 0 | 0 | 0 | 0 |
| 宁夏Ningxia | 0 | 0 | 0 | 0 | 0 | 0 |
| 新疆Xinjiang | 0 | 0 | 0 | 0 | 0 | 0 |
| 90%、95%、99%分别表示在10%、5%、1%水平热点显著; -90%、-95%、-99%分别表示在10%、5%、1%水平冷点显著; 0表示不显著, 既不是热点也不是冷点。90%, 95%, 99% mean significant hot point at 10%, 5%, 1% levels, respectively. -90%, -95%, -99% mean significant cold point at 10%, 5%, 1% levels, respectively. 0 means that the result was not significant, neither hot point nor cold point. | ||||||
下载: 导出CSV表4化肥面源污染排放强度热点分析的分组结果
Table4.Grouping results of hot spot analysis of chemical fertilizer non-point source pollution emission intensity
| 类别Category | 省(市、自治区) Province (city, autonomous region) |
| 热点区Hot spot region | 安徽、湖北、江苏、山东、上海、浙江、河南、福建、江西、湖南 Anhui, Hubei, Jiangsu, Shandong, Shanghai, Zhejiang, Henan, Fujian, Jiangxi, Hunan |
| 冷点区Cold spot region | 黑龙江、甘肃、青海、西藏Heilongjiang, Gansu, Qinghai, Tibet |
| 非热(冷)点区 Non-hot (cold) spot region | 广西、云南、内蒙古、吉林、贵州、宁夏、新疆、广东、陕西、海南、山西、辽宁、河北、天津、北京、四川、重庆Guangxi, Yunnan, Inner Mongolia, Jilin, Guizhou, Ningxia, Xinjiang, Guangdong, Shaanxi, Hainan, Shanxi, Liaoning, Hebei, Tianjin, Beijing, Sichuan, Chongqing |
下载: 导出CSV表5化肥面源污染排放强度不同热点区域的面板单位根(LLC)检验结果
Table5.Results of panel unit root test (LLC test) of different hotspot regions of fertilizer non-point source pollution emission intensity
| 组别 Category | 变量 Variable | 原始序列 Original sequence | 一阶差分序列 First differencing sequence |
| 热点区 Hot spot region | lnI | -0.248(0.402) | -7.689***(0.000) |
| lnG | 1.209(0.887) | -10.995***(0.000) | |
| lnP | -0.805(0.211) | -4.825***(0.000) | |
| lnM | 0.361(0.641) | -10.483***(0.000) | |
| lnA | -1.590*(0.056) | -7.590***(0.000) | |
| lnS | -3.509***(0.000) | -6.321***(0.000) | |
| lnR | -1.110(0.134) | -10.744***(0.000) | |
| lnN | -1.078(0.141) | -8.095***(0.000) | |
| lnU | -1.329*(0.092) | -9.190***(0.000) | |
| 冷点区 Cold spot region | lnI | -3.240***(0.001) | -5.671***(0.000) |
| lnG | 0.605(0.728) | -3.143***(0.001) | |
| lnP | 0.450(0.674) | -6.853***(0.000) | |
| lnM | 0.146(0.558) | -2.131**(0.017) | |
| lnA | -0.583(0.280) | -2.457***(0.007) | |
| lnS | 0.107(0.543) | -2.801***(0.003) | |
| lnR | -1.467*(0.071) | -2.437***(0.007) | |
| lnN | 0.040(0.516) | -5.727***(0.000) | |
| lnU | -2.208**(0.014) | -4.647***(0.000) | |
| 非热(冷)点区 Non-hot (cold) spot region | lnI | -4.248***(0.000) | -12.038***(0.000) |
| lnG | 0.992(0.839) | -8.996***(0.000) | |
| lnP | -1.609*(0.054) | -8.982***(0.000) | |
| lnM | 0.627(0.735) | -7.044***(0.000) | |
| lnA | -2.115**(0.017) | -7.789***(0.000) | |
| lnS | -0.137(0.446) | -9.307***(0.000) | |
| lnR | -5.548***(0.000) | -11.541***(0.000) | |
| lnN | 0.834(0.798) | -8.691***(0.000) | |
| lnU | -3.251***(0.000) | -11.208***(0.000) | |
| lnI:化肥面源污染排放强度; lnG:人均农业产值; lnP:作物种植结构; lnM:农业机械投入强度; lnA:农业产业结构; lnS:产业结构; lnR:农村居民收入结构; lnN:农村居民人均纯收入; lnU:城乡居民收入比。各变量均进行对数化处理。*、**和***分别表示在10%、5%和1%水平显著; 括号内数据为P值, 括号前为调整后的t值。lnI: fertilizer non-point source pollution emission intensity; lnG: per capita gross agricultural product; lnP: crop planting structure; lnM: agricultural machinery input intensity; lnA: agricultural industry structure; lnS: industrial structure; lnR: income structure of rural residents; lnN: per capita net income of rural residents; lnU: income ratio of urban and rural residents. Each variable is logarithmic. *, ** and *** mean significant effects of the variables at 10%, 5% and 1% levels, respectively. Data in parentheses are P values, data before parentheses are the adjusted t values. | |||
下载: 导出CSV表6化肥面源污染排放强度不同热点区域的协整检验结果
Table6.Results of panel cointegration test of different hotspot regions of fertilizer non-point source pollution emission intensity
| 组别Category | 曲线形式Curve form | ADF t统计值ADF t statistic | P值P value |
| 热点区 Hot spot region | 三次曲线Cubic curve | -2.732*** | 0.003 |
| 二次曲线Quadratic curve | -2.818*** | 0.002 | |
| 冷点区 Cold spot region | 三次曲线Cubic curve | -3.528*** | 0.000 |
| 二次曲线Quadratic curve | -3.472*** | 0.000 | |
| 非热(冷)点区 Non-hot (cold) spot region | 三次曲线Cubic curve | -2.342*** | 0.009 |
| 二次曲线Quadratic curve | -2.070** | 0.019 | |
| **和***分别表示在5%和1%水平显著。** and *** mean significant effects of the variables at 5% and 1% levels, respectively. | |||
下载: 导出CSV表7各组组间异方差、组内自相关、组间同期相关检验结果
Table7.Results of test for groupwise heteroskedasticity, autocorrelation within panel and contemporaneous correlation in each regions
| 热点区 Hot spot region | 冷点区 Cold spot region | 非热(冷)点区 Non-hot (cold) spot region | ||||||||||||||
| 二次曲线 Quadratic curve | 三次曲线 Cubic curve | 二次曲线 Quadratic curve | 三次曲线 Cubic curve | 二次曲线 Quadratic curve | 三次曲线 Cubic curve | |||||||||||
| 组间异方差检验 Modified Wald test for groupwise heteroscedasticity | chi2(10)=217.54*** Prob > chi2=0.000 | chi2(10)=233.50*** Prob > chi2=0.000 | chi2(4)=48.88*** Prob > chi2=0.000 | chi2(4)=68.38*** Prob > chi2=0.000 | chi2(17)=697.51*** Prob > chi2=0.000 | chi2(17)=300.80*** Prob > chi2=0.000 | ||||||||||
| 原假设 Null hypothesis | 模型不存在组间异方差 No groupwise heteroscedasticity | |||||||||||||||
| 检验结果 Result | 拒绝原假设, 存在组间异方差 Rejecting the null hypothesis, exist groupwise heteroscedasticity | 拒绝原假设, 存在组间异方差 Rejecting the null hypothesis, exist groupwise heteroscedasticity | 拒绝原假设, 存在组间异方差 Rejecting the null hypothesis, exist groupwise heteroscedasticity | |||||||||||||
| 组内自相关检验 Wooldridge test for autocorrelation | F(1, 9)=36.901*** Prob > F=0.000 | F(1, 9)=37.795*** Prob > F=0.000 | F(1, 3)=2.784 Prob > F=0.194 | F(1, 3)= 2.808 Prob > F=0.192 | F(1, 16)= 32.101*** Prob > F=0.000 | F(1, 16)=32.906*** Prob > F=0.000 | ||||||||||
| 原假设 Null hypothesis | 模型不存在一阶自相关 No first-order autocorrelation | |||||||||||||||
| 检验结果 Result | 拒绝原假设, 存在组内自相关 Rejecting the null hypothesis, exist autocorrelation | 接受原假设, 不存在组内自相关 Accept the null hypothesis, does not exist autocorrelation | 拒绝原假设, 存在组内自相关 Rejecting the null hypothesis, exist autocorrelation | |||||||||||||
| 组间同期相关检验 Breusch-Pagan LM test of independence | chi2(45)= 123.289*** Pr=0.000 | chi2(45)= 122.229*** Pr=0.000 | chi2(6)=14.939** Pr=0.021 | chi2(6)=11.633* Pr=0.071 | chi2(136)=639.163*** Pr=0.000 | chi2(136)=610.403*** Pr=0.000 | ||||||||||
| 原假设 Null hypothesis | 模型不存在组间同期相关 No contemporaneous correlation between groups | |||||||||||||||
| 检验结果 Result | 拒绝原假设, 存在组间同期相关 Rejecting the null hypothesis, exist correlation between the groups | 拒绝原假设, 存在组间同期相关 Rejecting the null hypothesis, exist correlation between the groups | 拒绝原假设, 存在组间同期相关 Rejecting the null hypothesis, exist correlation between the groups | |||||||||||||
| *、**和***分别表示在10%、5%和1%水平显著。*, ** and *** mean significant effects of the variables at 10%, 5% and 1% levels, respectively. | ||||||||||||||||
下载: 导出CSV表8化肥面源污染EKC分组拟合结果
Table8.EKC group fitting results of chemical fertilizer non-point source pollution
| 变量 Variable | 热点区Hot spot region | 冷点区Cold spot region | 非热(冷)点区 Non-hot (cold) spot region | |||||||
| 三次曲线 Cubic curve | 二次曲线 Quadratic curve | 三次曲线 Cubic curve | 二次曲线 Quadratic curve | 三次曲线 Cubic curve | 二次曲线 Quadratic curve | |||||
| lnG | 3.681(0.344) | 1.632***(0.000) | -10.198*(0.077) | 0.984**(0.049) | -3.810**(0.023) | 0.037(0.778) | ||||
| (lnG)2 | -0.354(0.463) | -0.094***(0.000) | 1.363*(0.063) | -0.063**(0.038) | 0.469**(0.027) | -0.007(0.405) | ||||
| (lnG)3 | 0.011(0.581) | — | -0.060*(0.053) | — | -0.019** (0.028) | — | ||||
| lnP | -0.378***(0.000) | -0.367***(0.000) | -0.397** (0.017) | -0.423**(0.013) | 0.039***(0.001) | 0.040***(0.000) | ||||
| lnM | 0.102***(0.000) | 0.102***(0.000) | 0.251***(0.000) | 0.257***(0.000) | 0.200***(0.000) | 0.195***(0.000) | ||||
| lnA | -0.175**(0.013) | -0.178**(0.011) | 0.376**(0.048) | 0.418**(0.029) | -0.084***(0.000) | -0.090***(0.000) | ||||
| lnR | 0.082*** (0.008) | 0.077**(0.012) | 0.182***(0.003) | 0.163***(0.007) | 0.157***(0.000) | 0.154***(0.000) | ||||
| lnN | 0.274*** (0.001) | 0.276***(0.000) | 0.060 (0.673) | 0.007(0.959) | 0.343***(0.000) | 0.364***(0.000) | ||||
| lnU | 0.088(0.192) | 0.094(0.160) | 0.055(0.626) | 0.055(0.634) | 0.019(0.541) | 0.019(0.487) | ||||
| lnS | 0.004(0.901) | 0.003(0.930) | 0.271***(0.009) | 0.226**(0.025) | -0.039***(0.000) | -0.047***(0.000) | ||||
| C | 45.059***(0.000) | 54.566***(0.000) | 24.973*(0.092) | -3.929**(0.029) | 49.502***(0.000) | 48.870***(0.000) | ||||
| 曲线形状 Curve form | 不显著 Not significant | 倒U型 Inverted U-type | 倒N型 Inverted N-type | — | 倒N型 Inverted N-type | 不显著 Not significant | ||||
| 拐点值 Inflection point value | — | 8.681 | 6.747/8.397 | — | 7.307/9.149 | — | ||||
| 拐点处人均农业产值(G) Per capita gross agricultural product in inflection point G (¥) | — | 5 889.933 | 851.500/4 433.746 | — | 1 490.698/ 9 405.031 | — | ||||
| *、**和***分别表示在10%、5%和1%水平显著; 括号内数据为P值, 括号前为调整后的t值; “/”前为第1个拐点对应的值, “/”后为第2个拐点对应的值。*, ** and *** mean significant effects of the variables at 10%, 5% and 1% levels, respectively. Data in parentheses are P values, data before parentheses are the adjusted t values. Date before “/” are the values of the first inflection point, date after “/” are the values of the second inflection point. | ||||||||||
下载: 导出CSV表9部分省份(市、自治区)化肥面源污染跨过下一拐点的时间预测
Table9.Time forecast for some provinces (cities, autonomous regions) cross the next inflection point of non-source pollution of fertilizers
| 组别 Category | 曲线形状 Curve form | 省(市、自治区) Province (city, autonomous region) | 跨过第1个拐点年份 Year when crossed the first inflection point | 人均农业总产值的年均增长率 Average annual growth rate of per capita gross agricultural product (%) | 下一拐点出现年份 Year of the next inflection point |
| 热点区 Hot spot region | 倒U型 Inverted U-type | 安徽Anhui | 未跨过Not cross | 6.410 | 2022 |
| 上海Shanghai | 未跨过Not cross | 1.720 | 2064 | ||
| 湖南Hunan | 未跨过Not cross | 6.779 | 2022 | ||
| 江西Jiangxi | 未跨过Not cross | 6.182 | 2024 | ||
| 浙江Zhejiang | 未跨过Not cross | 6.383 | 2022 | ||
| 冷点区 Cold spot region | 倒N型 Inverted N-type | 青海Qinghai | 1997年前Before1997 | 4.488 | 2034 |
| 西藏Tibet | 1997年前Before1997 | 3.957 | 2036 | ||
| 非热(冷)点区 Non-hot (cold) spot region | 倒N型 Inverted N-type | 北京Beijing | 1997年前Before1997 | 1.195 | 2123 |
| 广东Guangdong | 1997年前Before1997 | 6.839 | 2026 | ||
| 广西Guangxi | 1997年前Before1997 | 7.762 | 2025 | ||
| 贵州Guizhou | 2010 | 6.904 | 2032 | ||
| 河北Hebei | 1997年前Before1997 | 6.912 | 2024 | ||
| 吉林Jilin | 1997年前Before1997 | 6.845 | 2021 | ||
| 辽宁Liaoning | 1997年前Before1997 | 8.126 | 2019 | ||
| 内蒙古 Inner Mongolia | 1997年前Before1997 | 6.544 | 2021 | ||
| 宁夏Ningxia | 2012 | 7.340 | 2025 | ||
| 山西Shanxi | 2008 | 5.647 | 2040 | ||
| 陕西Shaanxi | 2003 | 8.571 | 2023 | ||
| 四川Sichuan | 2006 | 6.007 | 2033 | ||
| 天津Tianjin | 1997年前Before1997 | 4.059 | 2034 | ||
| 云南Yunnan | 2005 | 6.861 | 2029 | ||
| 新疆Xinjiang | 2006 | 8.536 | 2025 |
下载: 导出CSV参考文献
| [1] | 朱宁, 曹博, 秦富.基于化肥削减潜力及碳减排的小麦生产效率[J].中国环境科学, 2018, 38(2):784-791 http://d.old.wanfangdata.com.cn/Periodical/zghjkx201802044 ZHU N, CAO B, QIN F. Research of wheat production efficiency based on fertilizer reduction potential and carbon emission reduction[J]. China Environmental Science, 2018, 38(2):784-791 http://d.old.wanfangdata.com.cn/Periodical/zghjkx201802044 |
| [2] | 万宝瑞.新形势下我国农业发展战略思考[J].农业经济问题, 2017, 38(1):4-8 http://www.wanfangdata.com.cn/details/detail.do?_type=perio&id=nyjjwt201701001 WAN B R. Thoughts on China's agricultural development strategy under the new situation[J]. Issues in Agricultural Economy, 2017, 38(1):4-8 http://www.wanfangdata.com.cn/details/detail.do?_type=perio&id=nyjjwt201701001 |
| [3] | 金书秦, 沈贵银.中国农业面源污染的困境摆脱与绿色转型[J].改革, 2013, (5):79-87 http://www.wanfangdata.com.cn/details/detail.do?_type=perio&id=gaig201305011 JIN S Q, SHEN G Y. To get rid of the predicament and green transformation of agricultural nonpoint source (NPS) pollution[J]. Reform, 2013, (5):79-87 http://www.wanfangdata.com.cn/details/detail.do?_type=perio&id=gaig201305011 |
| [4] | 仇焕广, 栾昊, 李瑾, 等.风险规避对农户化肥过量施用行为的影响[J].中国农村经济, 2014, (3):85-96 http://www.wanfangdata.com.cn/details/detail.do?_type=perio&id=zgncjj201403009 QIU H G, LUAN H, LI J, et al. Impact of risk aversion on farmers' excessive fertilizer application behavior[J]. Chinese Rural Economy, 2014, (3):85-96 http://www.wanfangdata.com.cn/details/detail.do?_type=perio&id=zgncjj201403009 |
| [5] | 栾江, 仇焕广, 井月, 等.我国化肥施用量持续增长的原因分解及趋势预测[J].自然资源学报, 2013, 28(11):1869-1878 http://www.wanfangdata.com.cn/details/detail.do?_type=perio&id=zrzyxb201311004 LUAN J, QIU H G, JING Y, et al. Decomposition of factors contributed to the increase of China's chemical fertilizer use and projections for future fertilizer use in China[J]. Journal of Natural Resources, 2013, 28(11):1869-1878 http://www.wanfangdata.com.cn/details/detail.do?_type=perio&id=zrzyxb201311004 |
| [6] | 徐卫涛, 张俊飚, 李树明, 等.循环农业中的农户减量化投入行为分析——基于晋、鲁、鄂三省的化肥投入调查[J].资源科学, 2010, 32(12):2407-2412 http://www.wanfangdata.com.cn/details/detail.do?_type=perio&id=zykx201012023 XU W T, ZHANG J B, LI S M, et al. Behavioral analysis of reducing investments for farming families in circular agriculture:A case study on Shanxi, Shandong, and Hubei Provinces based on the investigation of chemical fertilizer input[J]. Resources Science, 2010, 32(12):2407-2412 http://www.wanfangdata.com.cn/details/detail.do?_type=perio&id=zykx201012023 |
| [7] | GROSSMAN G M, KRUEGER A B. Environmental Impacts of a North American Free Trade Agreement[R]. Cambridge, MA: National Bureau of Economic Research, 1991 |
| [8] | ANTLE J M, HEIDEBRINK G. Environment and development:Theory and international evidence[J]. Economic Development and Cultural Change, 1995, 43(3):603-625 http://d.old.wanfangdata.com.cn/Periodical/cjyj201604005 |
| [9] | MCCONNELL K E. Income and the demand for environmental quality[J]. Environment and Development Economics, 1997, 2(4):383-399 doi: 10.1017-S1355770X9700020X/ |
| [10] | 孙大元, 杨祁云, 张景欣, 等.广东省农业面源污染与农业经济发展的关系[J].中国人口?资源与环境, 2016, 26(S1):102-105 http://www.cnki.com.cn/Article/CJFDTotal-ZGRZ2016S1024.htm SUN D Y, YANG Q Y, ZHANG J X, et al. Positive analysis on the relationship between agriculture non-point source pollution and economic growth of Guangdong Province[J]. China Population, Resources and Environment, 2016, 26(S1):102-105 http://www.cnki.com.cn/Article/CJFDTotal-ZGRZ2016S1024.htm |
| [11] | 张平淡, 袁赛.决胜全面小康视野的农民收入结构与农业面源污染治理[J].改革, 2017, (9):98-107 http://www.wanfangdata.com.cn/details/detail.do?_type=perio&id=673592633 ZHANG P D, YUAN S. Farmers' income structure and agricultural non-point source pollution control from the perspective of determining the victory overall well-off society[J]. Reform, 2017, (9):98-107 http://www.wanfangdata.com.cn/details/detail.do?_type=perio&id=673592633 |
| [12] | 揭昌亮, 王金龙, 庞一楠.中国农业增长与化肥面源污染:环境库兹涅茨曲线存在吗?[J].农村经济, 2018, (11):110-117 http://www.cnki.com.cn/Article/CJFDTotal-NCJJ201811018.htm JIE C L, WANG J L, PANG Y N. China's agricultural growth and fertilizer non-point source pollution:Does the environmental Kuznets curve exist?[J]. Rural Economy, 2018, (11):110-117 http://www.cnki.com.cn/Article/CJFDTotal-NCJJ201811018.htm |
| [13] | 沈能, 张斌.农业增长能改善环境生产率吗?——有条件"环境库兹涅茨曲线"的实证检验[J].中国农村经济, 2015, (7):17-30 http://www.cnki.com.cn/Article/CJFDTotal-ZNJJ201507004.htm SHEN N, ZHANG B. Can agricultural growth improve environmental productivity?-An empirical test of conditional "environmental Kuznets curve"[J]. Chinese Rural Economy, 2015, (7):17-30 http://www.cnki.com.cn/Article/CJFDTotal-ZNJJ201507004.htm |
| [14] | ALDY J E. Per capita carbon dioxide emissions:Convergence or divergence?[J]. Environmental and Resource Economics, 2006, 33(4):533-555 http://d.old.wanfangdata.com.cn/NSTLQK/NSTL_QKJJ0210068238/ |
| [15] | WAGNER M. The carbon Kuznets curve:A cloudy picture emitted by bad econometrics?[J]. Resource and Energy Economics, 2008, 30(3):388-408 |
| [16] | 刘扬, 陈劭锋, 张云芳.中国农业EKC研究:以化肥为例[J].中国农学通报, 2009, 25(16):263-267 http://d.old.wanfangdata.com.cn/Periodical/zgnxtb200916058 LIU Y, CHEN S F, ZHANG Y F. Study on Chinese agricultural EKC:Evidence from fertilizer[J]. Chinese Agricultural Science Bulletin, 2009, 25(16):263-267 http://d.old.wanfangdata.com.cn/Periodical/zgnxtb200916058 |
| [17] | 杜江, 刘渝.中国农业增长与化学品投入的库兹涅茨假说及验证[J].世界经济文汇, 2009, (3):96-108 http://d.old.wanfangdata.com.cn/Periodical/sjjjwh200903008 DU J, LIU Y. Hypothesis and verification of the Kuznets curve relationship between agricultural growth and chemical inputs in China[J]. World Economic Papers, 2009, (3):96-108 http://d.old.wanfangdata.com.cn/Periodical/sjjjwh200903008 |
| [18] | 吴玉鸣, 田斌.省域环境库兹涅茨曲线的扩展及其决定因素——空间计量经济学模型实证[J].地理研究, 2012, 31(4):627-640 http://www.wanfangdata.com.cn/details/detail.do?_type=perio&id=dlyj201204006 WU Y M, TIAN B. The extension of regional Environmental Kuznets Curve and its determinants:An empirical research based on spatial econometrics model[J]. Geographical Research, 2012, 31(4):627-640 http://www.wanfangdata.com.cn/details/detail.do?_type=perio&id=dlyj201204006 |
| [19] | 陈勇, 冯永忠, 杨改河.农业非点源污染源的环境库兹涅茨曲线实证研究——基于陕西省农业投入和废弃物排放的研究[J].干旱地区农业研究, 2010, 28(3):191-198 http://www.wanfangdata.com.cn/details/detail.do?_type=perio&id=ghdqnyyj201003035 CHEN Y, FENG Y Z, YANG G H. Empirical study on Environmental Kuznets Curve of non-point source pollution-A case study of agricultural input and agricultural waste's output in Shaanxi Province[J]. Agricultural Research in the Arid Areas, 2010, 28(3):191-198 http://www.wanfangdata.com.cn/details/detail.do?_type=perio&id=ghdqnyyj201003035 |
| [20] | 陈勇, 李首成, 税伟, 等.基于EKC模型的西南地区农业生态系统碳足迹研究[J].农业技术经济, 2013, (2):120-128 http://d.old.wanfangdata.com.cn/Periodical/nyjsjj201302015 CHEN Y, LI S C, SHUI W, et al. Study on carbon footprint of agro-ecosystem in Southwest China based on EKC model[J]. Journal of Agrotechnical Economics, 2013, (2):120-128 http://d.old.wanfangdata.com.cn/Periodical/nyjsjj201302015 |
| [21] | 石文香, 陈盛伟.中国化肥面源污染排放驱动因素分解与EKC检验[J].干旱区资源与环境, 2019, 33(5):1-7 http://d.old.wanfangdata.com.cn/Periodical/ghqzyyhj201905001 SHI W X, CHEN S W. The drivers of fertilizer non-point source pollution in China and the environmental Kuznets curve characteristics[J]. Journal of Arid Land Resources and Environment, 2019, 33(5):1-7 http://d.old.wanfangdata.com.cn/Periodical/ghqzyyhj201905001 |
| [22] | 侯孟阳, 姚顺波.异质性条件下化肥面源污染排放的EKC再检验——基于面板门槛模型的分组[J].农业技术经济, 2019, (4):104-118 http://www.wanfangdata.com.cn/details/detail.do?_type=perio&id=nyjsjj201904009 HOU M Y, YAO S B. EKC retest of fertilizer non-point source pollution emission under heterogeneous conditions-Grouping based on panel threshold model[J]. Journal of Agrotechnical Economics, 2019, (4):104-118 http://www.wanfangdata.com.cn/details/detail.do?_type=perio&id=nyjsjj201904009 |
| [23] | 田素妍, 郑微微, 周力.中国低碳养殖的环境库兹涅茨曲线特征及其成因分析[J].资源科学, 2012, 34(3):481-493 http://d.old.wanfangdata.com.cn/Periodical/zykx201203012 TIAN S Y, ZHENG W W, ZHOU L. Characteristics of environmental Kuznets curve for the low carbon breeding in China and its causes[J]. Resources Science, 2012, 34(3):481-493 http://d.old.wanfangdata.com.cn/Periodical/zykx201203012 |
| [24] | 张陈俊, 章恒全, 陈其勇, 等.用水量与经济增长关系的实证研究[J].资源科学, 2015, 37(11):2228-2239 http://d.old.wanfangdata.com.cn/Periodical/zykx201511014 ZHANG C J, ZHANG H Q, CHEN Q Y, et al. Empirical research on the relationship between water use and economic growth[J]. Resources Science, 2015, 37(11):2228-2239 http://d.old.wanfangdata.com.cn/Periodical/zykx201511014 |
| [25] | 张月, 潘柏林, 李锦彬, 等.基于库兹涅茨曲线的中国工业用水与经济增长关系研究[J].资源科学, 2017, 39(6):1117-1126 http://d.old.wanfangdata.com.cn/Periodical/zykx201706011 ZHANG Y, PAN B L, LI J B, et al. The relationship analysis between Chinese industrial water use and economic growth based on the Kuznets Curve[J]. Resources Science, 2017, 39(6):1117-1126 http://d.old.wanfangdata.com.cn/Periodical/zykx201706011 |
| [26] | 金书秦, 沈贵银, 魏珣, 等.论农业面源污染的产生和应对[J].农业经济问题, 2013, 34(11):97-102 http://d.old.wanfangdata.com.cn/Periodical/nyjjwt201311015 JIN S Q, SHEN G Y, WEI X, et al. On the emergence and response of agricultural non-point source pollution[J]. Issues in Agricultural Economy, 2013, 34(11):97-102 http://d.old.wanfangdata.com.cn/Periodical/nyjjwt201311015 |
| [27] | 史常亮, 李赟, 朱俊峰.劳动力转移、化肥过度使用与面源污染[J].中国农业大学学报, 2016, 21(5):169-180 http://d.old.wanfangdata.com.cn/Periodical/zgnydxxb201605022 SHI C L, LI Y, ZHU J F. Rural labor transfer, excessive fertilizer use and agricultural non-point source pollution[J]. Journal of China Agricultural University, 2016, 21(5):169-180 http://d.old.wanfangdata.com.cn/Periodical/zgnydxxb201605022 |
| [28] | 赖斯芸, 杜鹏飞, 陈吉宁.基于单元分析的非点源污染调查评估方法[J].清华大学学报:自然科学版, 2004, 44(9):1184-1187 http://d.old.wanfangdata.com.cn/Periodical/qhdxxb200409009 LAI S Y, DU P F, CHEN J N. Evaluation of non-point source pollution based on unit analysis[J]. Journal of Tsinghua University:Science and Technology, 2004, 44(9):1184-1187 http://d.old.wanfangdata.com.cn/Periodical/qhdxxb200409009 |
| [29] | 陈敏鹏, 陈吉宁, 赖斯芸.中国农业和农村污染的清单分析与空间特征识别[J].中国环境科学, 2006, 26(6):751-755 http://d.old.wanfangdata.com.cn/Periodical/zghjkx200606025 CHEN M P, CHEN J N, LAI S Y. Inventory analysis and spatial distribution of Chinese agricultural and rural pollution[J]. China Environmental Science, 2006, 26(6):751-755 http://d.old.wanfangdata.com.cn/Periodical/zghjkx200606025 |
| [30] | 赖斯芸.非点源污染调查评估方法及其应用研究[D].北京: 清华大学, 2004 LAI S Y. Study on non-point sources pollution investigation and evaluation method and its application[D]. Beijing: Tsinghua University, 2004 |
| [31] | 郑田甜, 赵筱青, 卢飞飞, 等.云南星云湖流域种植业面源污染驱动力分析[J].生态与农村环境学报, 2019, 35(6):730-737 http://www.wanfangdata.com.cn/details/detail.do?_type=perio&id=pre_687a34af-c6a1-4234-8232-c789ed8b1f39 ZHENG T T, ZHAO X Q, LU F F, et al. Analysis on the driving force of farming non-point source pollution in the Xingyun Lake Basin of Yunnan Province[J]. Journal of Ecology and Rural Environment, 2019, 35(6):730-737 http://www.wanfangdata.com.cn/details/detail.do?_type=perio&id=pre_687a34af-c6a1-4234-8232-c789ed8b1f39 |
| [32] | 陆文聪, 刘聪.化肥污染对粮食作物生产的环境惩罚效应[J].中国环境科学, 2017, 37(5):1988-1994 http://d.old.wanfangdata.com.cn/Periodical/zghjkx201705048 LU W C, LIU C. The "environmental punishment" effect of fertilizer pollution in grain crop production[J]. China Environmental Science, 2017, 37(5):1988-1994 http://d.old.wanfangdata.com.cn/Periodical/zghjkx201705048 |
| [33] | 张立新, 朱道林, 杜挺, 等.基于DEA模型的城市建设用地利用效率时空格局演变及驱动因素[J].资源科学, 2017, 39(3):418-429 http://d.old.wanfangdata.com.cn/Periodical/zykx201703004 ZHANG L X, ZHU D L, DU T, et al. Spatiotemporal pattern evolvement and driving factors of urban construction land use efficiency using data envelopment analysis[J]. Resources Science, 2017, 39(3):418-429 http://d.old.wanfangdata.com.cn/Periodical/zykx201703004 |
| [34] | 余文梦, 孙小霞, 苏时鹏.省域农用地猪粪负荷强度时空演变分析[J].中国生态农业学报(中英文), 2019, 27(3):494-506 http://www.ecoagri.ac.cn/zgstny/ch/reader/view_abstract.aspx?file_no=2019-0316&flag=1 YU W M, SUN X X, SU S P. Temporal and spatial changes in pig manure load in agricultural lands in China[J]. Chinese Journal of Eco-Agriculture, 2019, 27(3):494-506 http://www.ecoagri.ac.cn/zgstny/ch/reader/view_abstract.aspx?file_no=2019-0316&flag=1 |
| [35] | SHAFIK N, BANDYOPADHYAY S. WPS 904 Economic growth and environmental quality: Time series and cross- country evidence[R]. Washington, DC: The World Bank, 1992 |
| [36] | BOYCE J K. Inequality as a cause of environmental degradation[J]. Ecological Economics, 1994, 11(3):169-178 doi: 10.1016-0921-8009(94)90198-8/ |
| [37] | 姚东恒, 裴久渤, 汪景宽.东北典型黑土区耕地质量时空变化研究[J].中国生态农业学报(中英文), 2020, 28(1):104-114 http://www.ecoagri.ac.cn/zgstny/ch/reader/view_abstract.aspx?file_no=2020-0112&flag=1 YAO D H, PEI J B, WANG J K. Temporal-spatial changes in cultivated land quality in a black soil region of Northeast China[J]. Chinese Journal of Eco-Agriculture, 2020, 28(1):104-114 http://www.ecoagri.ac.cn/zgstny/ch/reader/view_abstract.aspx?file_no=2020-0112&flag=1 |
| [38] | 金书秦, 邢晓旭.农业面源污染的趋势研判、政策评述和对策建议[J].中国农业科学, 2018, 51(3):593-600 http://d.old.wanfangdata.com.cn/Periodical/zgnykx201803016 JIN S Q, XING X X. Trend analysis, policy evaluation, and recommendations of agricultural non-point source pollution[J]. Scientia Agricultura Sinica, 2018, 51(3):593-600 http://d.old.wanfangdata.com.cn/Periodical/zgnykx201803016 |
| [39] | 刘钦普.中国化肥面源污染环境风险时空变化[J].农业环境科学学报, 2017, 36(7):1247-1253 http://d.old.wanfangdata.com.cn/Periodical/nyhjbh201707005 LIU Q P. Spatio-temporal changes of fertilization environmental risk of China[J]. Journal of Agro-Environment Science, 2017, 36(7):1247-1253 http://d.old.wanfangdata.com.cn/Periodical/nyhjbh201707005 |
| [40] | 田若蘅, 黄成毅, 邓良基, 等.四川省化肥面源污染环境风险评估及趋势模拟[J].中国生态农业学报, 2018, 26(11):1739-1751 http://d.old.wanfangdata.com.cn/Periodical/stnyyj201811015 TIAN R H, HUANG C Y, DENG L J, et al. Environmental risk assessment and trend simulation of non-point source pollution of chemical fertilization in Sichuan Province, China[J]. Chinese Journal of Eco-Agriculture, 2018, 26(11):1739-1751 http://d.old.wanfangdata.com.cn/Periodical/stnyyj201811015 |
| [41] | 孙攀, 吴玉鸣, 鲍曙明, 等.经济增长与雾霾污染治理:空间环境库兹涅茨曲线检验[J].南方经济, 2019, 38(12):100-117 http://d.old.wanfangdata.com.cn/Periodical/nfjj201912007 SUN P, WU Y M, BAO S M, et al. A study on economic growth and smog pollution:Testing spatial environmental Kuznets curve hypothesis in China[J]. South China Journal of Economics, 2019, 38(12):100-117 http://d.old.wanfangdata.com.cn/Periodical/nfjj201912007 |
| [42] | WYCKOFF A W, ROOP J M. The embodiment of carbon in imports of manufactured products:Implications for international agreements on greenhouse gas emissions[J]. Energy Policy, 1994, 22(3):187-194 |
| [43] | SURI V, CHAPMAN D. Economic growth, trade and energy:Implications for the environmental Kuznets curve[J]. Ecological Economics, 1998, 25(2):195-208 doi: 10.1016-S0921-8009(97)00180-8/ |
| [44] | GAWANDE K, BERRENS R P, BOHARA A K. A consumption-based theory of the environmental Kuznets curve[J]. Ecological Economics, 2001, 37(1):101-112 |
| [45] | STERN D I, COMMON M S, BARBIER E B. Economic growth and environmental degradation:The environmental Kuznets curve and sustainable development[J]. World Development, 1996, 24(7):1151-1160 http://d.old.wanfangdata.com.cn/Periodical/dyyjykf200904026 |
| [46] | 郑保利, 梁流涛, 李明明. 1998-2016年中国地级以上城市PM2.5污染时空格局[J].中国环境科学, 2019, 39(5):1909-1919 http://d.old.wanfangdata.com.cn/Periodical/zghjkx201905014 ZHENG B L, LIANG L T, LI M M. Analysis of temporal and spatial patterns of PM2.5 in prefecture-level cities of China from 1998 to 2016[J]. China Environmental Science, 2019, 39(5):1909-1919 http://d.old.wanfangdata.com.cn/Periodical/zghjkx201905014 |
| [47] | J?NICKE M, BINDER M, M?NCH H. 'Dirty Industries':Patterns of change in industrial countries[J]. Environmental and Resource Economics, 1997, 9(4):467-491 |
| [48] | 崔鑫生, 韩萌, 方志.动态演进的倒"U"型环境库兹涅茨曲线[J].中国人口·资源与环境, 2019, 29(9):74-82 http://www.wanfangdata.com.cn/details/detail.do?_type=perio&id=zgrkzyyhj201909008 CUI X S, HAN M, FANG Z. Inverted 'U'-shape of EKC with dynamic evolution trend[J]. China Population, Resources and Environment, 2019, 29(9):74-82 http://www.wanfangdata.com.cn/details/detail.do?_type=perio&id=zgrkzyyhj201909008 |
