许钰莎1
1.四川省农业科学院农业信息与农村经济研究所 成都 610066
2.四川省农业科学院农村发展研究中心 成都 610066
基金项目: 国家自然科学基金项目71603178
四川省财政创新能力提升工程专项资金项目2016QNJJ-006
成都市软科学研究项目2017-RK00-00024-ZF
详细信息
作者简介:熊鹰, 研究方向为农业经济与生态经济。E-mail:54540677@qq.com
中图分类号:F224;F323计量
文章访问数:711
HTML全文浏览量:5
PDF下载量:677
被引次数:0
出版历程
收稿日期:2018-09-18
录用日期:2018-12-26
刊出日期:2019-07-01
Measurements and influencing factors of the efficiency of environmental-ly-friendly agricultural production in Sichuan Province based on SE-DEA and spatial panel STIRPAT models
XIONG Ying1, 2,,,XU Yusha1
1. Agricultural Information and Rural Economy Institute, Sichuan Academy of Agricultural Sciences, Chengdu 610066, China
2. Center for Rural Development Research, Sichuan Academy of Agricultural Sciences, Chengdu 610066, China
Funds: the National Natural Science Foundation of China71603178
the Specialized Research Fund for Financial Innovation Capacity Improvement of Sichuan Province2016QNJJ-006
the Soft Science Research Project of Chengdu2017-RK00-00024-ZF
More Information
Corresponding author:XIONG Ying, E-mail: 54540677@qq.com
摘要
HTML全文
图
参考文献
相关文章
施引文献
资源附件
访问统计
摘要
摘要:环境友好型农业顺应了当前农业绿色发展的迫切需要,但现有针对环境友好型农业的研究缺乏从生产效率提升角度展开分析。四川是我国的农业大省,针对四川省环境友好型农业生产效率及其影响因素进行定量分析,可为四川省环境友好型农业发展提供科学依据,丰富基于生产效率视角下的环境友好型农业研究。本文基于2006-2016年四川省21个市州面板数据,运用超效率DEA方法对四川省环境友好型农业生产效率进行测算,并基于STIRPAT理论模型,构建环境友好型农业生产效率影响因素分析的理论模型,采用空间杜宾模型进行实证分析。结果表明:2006-2016年四川省环境友好型农业生产效率保持先降后升的态势,自2006年的0.708降至2009年的0.667,而后逐渐升高到2016年的0.805;四川省环境友好型农业生产效率11年间的均值为0.705,总体水平较低且各地区存在显著差异,雅安市和阿坝州环境友好型农业生产效率均值最高(0.981),广元市最低(0.458);泸州市、绵阳市、乐山市、宜宾市、广安市、巴中市、南充市、眉山市和广元市的效率均值都低于0.6,导致这些地区生产效率较低的原因是化肥、农药和农膜使用等过量的投入,未来具有较大的提升空间。农业劳动生产率、粮食播种面积占农作物总播种面积比重对环境友好型农业生产效率具有显著的直接效应,影响系数分别为0.158和0.506,其中粮食所占比重的影响最大。人口密度、粮食播种面积占农作物总播种面积比重对环境友好型农业生产效率具有显著的间接效应,影响系数分别为0.988和1.366。邻近地区人口密度在地区间具有溢出效应,从而对本地区有限的农业资源形成竞争,导致间接效应为负;邻近地区种植结构的变化同向影响着本地区种植结构的调整,导致种植结构的间接效应为负。鉴于四川省各地区环境友好型农业生产效率不仅存在显著差异,而且地区间具有空间溢出效应,因此四川省各地区在进行环境友好型农业发展政策的制定时,既需要关注地区内部因素的直接影响,也需要考虑地区间影响因素的相互作用。
关键词:环境友好型农业/
农业生产效率/
超效率DEA模型/
STIRPAT模型/
空间杜宾模型
Abstract:Environmentally-friendly agriculture complies with the current urgent need for green agricultural development. However, the existing research into environmentally-friendly agriculture lacks analysis on productivity improvement. Sichuan is a major agricultural province of China. A quantitative analysis on the efficiency of Sichuan's environmentally-friendly agricultural production and its influencing factors may provide a scientific basis for the development of environmentally-friendly agriculture in Sichuan. This will also enrich the knowledge about environmentally-friendly agriculture from the perspective of production efficiency. Based on panel data from 21 regions in Sichuan Province from 2006 to 2016, Super-Efficiency Data Envelopment Analysis (SE-DEA) models were applied to measure the production efficiency of environmentally-friendly agriculture. A theoretical model for the factors influencing the production efficiency of environmentally-friendly agriculture was established and a Spatial Durbin Model (SDM) was used for empirical analysis based on the STIRPAT theoretical model. The results showed that the production efficiency of environmentally-friendly agriculture in Sichuan Province first decreased and then increased between 2006 and 2016. It decreased from 0.708 in 2006 to 0.667 in 2009, then gradually increasing to 0.805 in 2016. The average efficiency of environmentally-friendly agricultural production in Sichuan during these 11 years was 0.705. The overall level was low and significant differences existed in each region. The highest average production efficiency in Ya'an and Aba reached 0.981, while the minimum in Guangyuan was 0.458. Meanwhile, the average production efficiency, in areas such as Luzhou, Mianyang, Leshan, Yibin, Guang'an, Bazhong, Nanchong, Meishan, and Guangyuan, was lower than 0.6, which was caused by the excessive input of chemical fertilizers, pesticides, and agricultural films. The agricultural labor and proportion of grain-sown area in the total crop area had significant direct effects on the production efficiency of environmentally-friendly agriculture. The coefficients for these two factors were 0.158 and 0.506, respectively. The population density and proportion of grain-sown area in the total crop area had significant indirect effects on the production efficiency of environmentally-friendly agriculture. The coefficients for these factors were 0.988 and 1.366, respectively. Additionally, the population density in neighboring regions had spillover effects among regions, which created competition for the limited agricultural resources in this region, resulting in negative indirect effects. The changes of planting structures in neighboring regions affected the adjustment of the planting structure in this region, resulting in negative indirect effects. Because that there were not only significant differences in the production efficiency of environmentally-friendly agriculture in each region of Sichuan, but also spatial spillover effects among the regions, the direct effects of regional internal factors and interactive effects of the factors among the regions should be considered during the formulation of environmentally-friendly agricultural development policies in various regions of Sichuan Province.
Key words:Environment-friendly agriculture/
Agricultural production efficiency/
Super-Efficiency Data Envelopment Analysis (SE-DEA) model/
STIRPAT model/
Spatial Durbin Model (SDM)
HTML全文
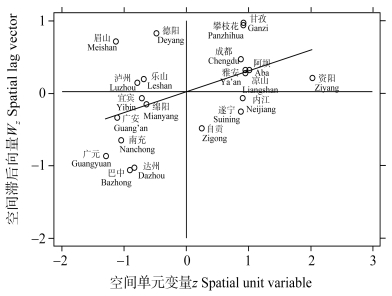
图12016年四川省21个市州环境友好型农业生产效率的Moran’I散点图
Figure1.Moran'I scatterplot of environmentally-friendly agricultural production efficiency in 21 regions of Sichuan Province in 2016
 下载: 全尺寸图片幻灯片
表1四川省空间面板计量模型各变量的统计性描述
Table1.Statistical description of each variable in spatial panel econometric model of Sichuan Province
| 变量 Variable | 均值 Mean | 标准差 Standard deviation | 最小值 Minimum | 最大值 Maximum |
| 环境友好型农业生产效率(E) Environment-friendly agricultural production efficiency | 0.705 | 0.192 | 0.429 | 1.256 |
| 人口密度(D) Population density (persons?km-2) | 380.841 | 268.291 | 6.100 | 1 209.000 |
| 城镇化率(U) Urbanization rate (%) | 39.130 | 10.519 | 17.900 | 71.470 |
| 人均GDP (P) Per capita GDP (104 ) | 1.956 | 1.170 | 0.471 | 7.322 |
| 农业劳动生产率(L) Agricultural labor productivity ( ?capita-1) | 13 942.988 | 6 802.637 | 2 823.529 | 43 069.123 |
| 粮食播种面积占农作物总播种面积比重(S) Proportion of grain-sown area in the total crop sown area (%) | 68.458 | 6.526 | 52.413 | 90.044 |
下载: 导出CSV表22006—2016年四川省21个市州环境友好型农业生产效率评价结果
Table2.Environmentally-friendly agricultural production efficiencies in 21 regions of Sichuan Province from 2006 to 2016
| 地区Region | 2006 | 2007 | 2008 | 2009 | 2010 | 2011 | 2012 | 2013 | 2014 | 2015 | 2016 | 均值Mean |
| 成都市Chengdu | 0.676 | 0.720 | 0.754 | 0.772 | 0.813 | 0.827 | 0.864 | 0.881 | 0.914 | 1.076 | 1.000 | 0.845 |
| 自贡市Zigong | 1.005 | 0.788 | 0.757 | 0.758 | 0.749 | 0.749 | 0.758 | 0.758 | 0.758 | 0.779 | 0.859 | 0.792 |
| 攀枝花市Panzhihua | 1.017 | 1.005 | 1.001 | 0.885 | 0.905 | 0.902 | 0.914 | 0.908 | 0.920 | 1.023 | 1.009 | 0.954 |
| 泸州市Luzhou | 0.605 | 0.615 | 0.616 | 0.591 | 0.597 | 0.574 | 0.576 | 0.573 | 0.583 | 0.604 | 0.628 | 0.596 |
| 德阳市Deyang | 0.604 | 0.616 | 0.583 | 0.573 | 0.571 | 0.572 | 0.589 | 0.611 | 0.630 | 0.661 | 0.696 | 0.610 |
| 绵阳市Mianyang | 0.572 | 0.581 | 0.547 | 0.550 | 0.551 | 0.551 | 0.563 | 0.578 | 0.600 | 0.639 | 0.662 | 0.581 |
| 广元市Guangyuan | 0.462 | 0.441 | 0.433 | 0.435 | 0.442 | 0.429 | 0.451 | 0.455 | 0.470 | 0.502 | 0.516 | 0.458 |
| 遂宁市Suining | 0.728 | 0.737 | 0.749 | 0.738 | 0.761 | 0.784 | 0.836 | 0.916 | 1.003 | 0.924 | 1.000 | 0.834 |
| 内江市Neijiang | 0.589 | 0.609 | 0.644 | 0.616 | 0.625 | 0.701 | 0.720 | 0.694 | 0.742 | 0.853 | 1.007 | 0.709 |
| 乐山市Leshan | 0.533 | 0.539 | 0.546 | 0.538 | 0.550 | 0.550 | 0.556 | 0.598 | 0.623 | 0.633 | 0.652 | 0.574 |
| 南充市Nanchong | 0.442 | 0.461 | 0.490 | 0.490 | 0.543 | 0.526 | 0.532 | 0.539 | 0.551 | 0.560 | 0.570 | 0.519 |
| 眉山市Meishan | 0.445 | 0.451 | 0.451 | 0.446 | 0.454 | 0.453 | 0.465 | 0.477 | 0.496 | 0.522 | 0.551 | 0.474 |
| 宜宾市Yibin | 0.532 | 0.539 | 0.541 | 0.534 | 0.549 | 0.552 | 0.574 | 0.581 | 0.606 | 0.633 | 0.645 | 0.572 |
| 广安市Guang’an | 0.574 | 0.588 | 0.587 | 0.560 | 0.541 | 0.523 | 0.527 | 0.525 | 0.534 | 0.550 | 0.556 | 0.551 |
| 达州市Dazhou | 0.606 | 0.606 | 0.602 | 0.598 | 0.609 | 0.612 | 0.612 | 0.597 | 0.604 | 0.608 | 0.618 | 0.607 |
| 雅安市Ya’an | 0.850 | 1.017 | 0.961 | 0.946 | 1.002 | 1.001 | 1.005 | 1.003 | 0.986 | 1.001 | 1.017 | 0.981 |
| 巴中市Bazhong | 0.511 | 0.514 | 0.517 | 0.527 | 0.526 | 0.535 | 0.536 | 0.549 | 0.564 | 0.593 | 0.602 | 0.543 |
| 资阳市Ziyang | 1.001 | 0.991 | 1.013 | 1.005 | 0.955 | 0.891 | 0.852 | 0.788 | 0.796 | 0.831 | 1.256 | 0.943 |
| 阿坝州Aba | 1.072 | 1.004 | 1.023 | 1.000 | 0.922 | 0.914 | 0.906 | 0.940 | 0.972 | 1.002 | 1.031 | 0.981 |
| 甘孜州Ganzi | 1.025 | 1.007 | 1.003 | 0.874 | 0.852 | 0.888 | 1.003 | 1.003 | 0.967 | 0.958 | 1.010 | 0.963 |
| 凉山州Liangshan | 1.024 | 0.851 | 0.631 | 0.571 | 0.570 | 0.571 | 0.565 | 0.618 | 0.649 | 0.792 | 1.016 | 0.714 |
| 全省均值Provincial mean | 0.708 | 0.699 | 0.688 | 0.667 | 0.671 | 0.672 | 0.686 | 0.695 | 0.713 | 0.750 | 0.805 | 0.705 |
下载: 导出CSV表32006—2016年四川省21个市州环境友好型农业生产效率年均投入产出优化调整
Table3.Annual input and output after optimization and adjustment of environmentally-friendly agricultural production efficiencies in 21 regions of Sichuan Province from 2006 to 2016
| 地区 Region | 投入Input | 产出Output | ||||||
| 农作物播种面积 Crops sown area (hm2) | 农业机械总动力 Total power of agricultural machinery (×104kW) | 第一产业从业人员 Employed person of primary industry (×104 persons) | 化肥 Chemical fertilizer (×104t) | 农药 Pesticide (t) | 农膜 Agricultural film (t) | 农林牧渔业总产值 (2006年不变价) Gross output value of farming, forestry, animal husbandry and fishery (x108¥) | ||
| 成都市 Chengdu | -141 660.504 | -2.548 | -54.975 | -3.875 | -1 335.424 | -782.513 | 0 | |
| 自贡市 Zigong | -153 563.910 | -6.938 | -26.835 | -8.790 | -1 293.727 | -2 029.994 | 0 | |
| 攀枝花市 Panzhihua | -124 054.130 | -2.944 | -13.809 | -1.665 | -143.179 | -95.030 | 0 | |
| 泸州市 Luzhou | -82 841.626 | -66.740 | -37.532 | -6.056 | -1 584.301 | -1 420.499 | 0 | |
| 德阳市 Deyang | -97 030.694 | -1.193 | -43.339 | -4.599 | -1 538.856 | -1 090.530 | 0 | |
| 绵阳市 Mianyang | -24 546.638 | -36.907 | -18.863 | -2.586 | -843.472 | -1 965.966 | 0 | |
| 广元市 Guangyuan | -136 482.813 | -24.177 | -76.248 | -5.578 | -1 368.685 | -3 902.076 | 0 | |
| 遂宁市 Suining | -211 903.742 | -122.825 | -55.253 | -7.941 | -1 642.391 | -4 743.800 | 0 | |
| 内江市 Neijiang | -551 921.524 | -33.505 | -83.112 | -14.843 | -2 820.389 | -5 072.073 | 0 | |
| 乐山市 Leshan | -143 612.459 | -22.189 | -54.544 | -6.745 | -1 436.380 | -2 606.422 | 0 | |
| 南充市 Nanchong | -176 219.013 | -24.684 | -59.287 | -6.531 | -1 687.538 | -4 075.106 | 0 | |
| 眉山市 Meishan | -187 597.312 | -22.742 | -54.612 | -13.350 | -3 028.436 | -3 899.428 | 0 | |
| 宜宾市 Yibin | -223 314.901 | -86.807 | -61.940 | -8.944 | -2 877.403 | -3 630.691 | 0 | |
| 广安市 Guang’an | -391 208.242 | -7.511 | -96.900 | -10.091 | -1 504.365 | -3 633.702 | 0 | |
| 达州市 Dazhou | -23 185.852 | -43.705 | -19.637 | -2.872 | -533.459 | -127.227 | 0 | |
| 雅安市 Ya’an | -121 585.719 | -1.824 | -32.261 | -6.894 | -900.347 | -245.094 | 0 | |
| 巴中市 Bazhong | -235 578.468 | -34.939 | -66.014 | -8.974 | -910.265 | -3 670.390 | 0 | |
| 资阳市 Ziyang | -304 349.439 | -61.223 | -61.491 | -12.972 | -2 846.507 | -2 634.487 | 0 | |
| 阿坝州Aba | -165 697.002 | -35.053 | -73.644 | -6.565 | -327.539 | -4 989.797 | 0 | |
| 甘孜州 Ganzi | -6 782.882 | -3.769 | -11.935 | -1.157 | -345.453 | -322.362 | 0 | |
| 凉山州 Liangshan | -17 292.334 | -42.275 | -24.846 | -1.021 | -353.613 | -1 431.981 | 0 | |
| 均值Mean | -167 639.486 | -35.595 | -48.908 | -6.764 | -1 396.273 | -2 493.770 | 0 | |
下载: 导出CSV表42006—2016年四川省环境友好型农业生产效率的Moran’s I指数值
Table4.Values of Moran's I index of environmentally- friendly agricultural production efficiencies in Sichuan Province from 2006 to 2016
| 年份Year | 莫兰指数Moran’s I | P值P value |
| 2006 | 0.128* | 0.086 |
| 2007 | 0.230** | 0.015 |
| 2008 | 0.149* | 0.061 |
| 2009 | 0.111 | 0.105 |
| 2010 | 0.093 | 0.134 |
| 2011 | 0.113 | 0.105 |
| 2012 | 0.127* | 0.086 |
| 2013 | 0.158* | 0.054 |
| 2014 | 0.133* | 0.079 |
| 2015 | 0.203** | 0.026 |
| 2016 | 0.195** | 0.030 |
| ***、**和*分别表示在1%、5%和10%的水平下显著。***, ** and * mean significant at 1%, 5% and 10% levels, respectively. | ||
下载: 导出CSV表5四川省21个市州环境友好型农业生产效率空间面板模型选择检验结果
Table5.Spatial panel model selection test results of environmentally-friendly agricultural production efficiency in 21 regions of Sichuan Province
| 待验模型 Tested model | 固定或随机效应的 SDM Fixed or random effects of SDM | SDM是否退化成 SLM Whether SDM changes into SLM | SDM是否退化成 SEM Whether SDM changes into SEM |
| 检验方法Test model | Hausman检验Hausman test | Wald检验Wald test | Wald检验Wald test |
| 检验值Test value | 28.35 | 27.11 | 24.82 |
| P值P value | 0.000 0 | 0.000 1 | 0.000 2 |
下载: 导出CSV表6四川省环境友好型农业生产效率影响因素的空间效应分析
Table6.Analysis on spatial effects of factors influencing environmentally-friendly agricultural production efficiency of Sichuan Province
| 变量 Variable | 总体效应 Total effect | 直接效应 Direct effect | 间接效应 Indirect effect |
| 人口密度Population density (lnD) | -1.051*** (0.006) | -0.063 (0.702) | -0.988*** (0.002) |
| 城镇化率Urbanization rate (lnU) | 0.023 (0.937) | -0.024 (0.858) | 0.047 (0.853) |
| 人均GDP Per capita GDP (lnP) | -0.354* (0.093) | -0.037 (0.709) | -0.317 (0.125) |
| 农业劳动生产率Agricultural labor productivity (lnL) | 0.245*** (0.001) | 0.158*** (0.000) | 0.088 (0.225) |
| 粮食播种面积占农作物总播种面积比重 Proportion of grain-sown area in the total crop sown area (lnS) | 1.872*** (0.000) | 0.506** (0.043) | 1.366*** (0.004) |
| 括号内数据为t检验的P值; ***、**和*分别表示在1%、5%和10%的水平上显著。Data in the bracket are P values of t test. ***, ** and * mean significant at 1%, 5% and 10% levels, respectively. | |||
下载: 导出CSV参考文献
| [1] | 张利国.农户从事环境友好型农业生产行为研究——基于江西省278份农户问卷调查的实证分析[J].农业技术经济, 2011, (6):114-120 http://www.wanfangdata.com.cn/details/detail.do?_type=perio&id=nyjsjj201106016 ZHANG L G. Research on farmers' behavior of environment-friendly agricultural production-An empirical analysis based on 278 questionnaires of farmers in Jiangxi Province[J]. Journal of Agrotechnical Economics, 2011, (6):114-120 http://www.wanfangdata.com.cn/details/detail.do?_type=perio&id=nyjsjj201106016 |
| [2] | 沈宇丹, 杜自强.环境友好型农业技术发展的难点和对策[J].生态经济, 2009, (2):116-120 http://d.old.wanfangdata.com.cn/Periodical/stjj200902026 SHEN Y D, DU Z Q. The constraints of environment-friendly agricultural technology development and its countermeasures[J]. Ecological Economy, 2009, (2):116-120 http://d.old.wanfangdata.com.cn/Periodical/stjj200902026 |
| [3] | PANNELL D J. Public benefits, private benefits, and policy mechanism choice for land-use change for environmental benefits[J]. Land Economics, 2008, 84(2):225-240 doi: 10.3368/le.84.2.225 |
| [4] | MILLOCK K, XABADIA A, ZILBERMAN D. Policy for the adoption of new environmental monitoring technologies to manage stock externalities[J]. Journal of Environmental Economics and Management, 2012, 64(1):102-116 doi: 10.1016/j.jeem.2012.02.004 |
| [5] | 钱小平, 尹昌斌, 方琳娜.日本与欧美农业环境支持政策对中国的启示[J].中国农业资源与区划, 2016, 37(7):35-44 http://d.old.wanfangdata.com.cn/Periodical/zgnyzyyqh201607006 QIAN X P, YIN C B, FANG L N. Inspiration of agricultural environment support policies of Japan, EU and America to China[J]. Chinese Journal of Agricultural Resources and Regional Planning, 2016, 37(7):35-44 http://d.old.wanfangdata.com.cn/Periodical/zgnyzyyqh201607006 |
| [6] | 马健, 韩星焕.日本协同推进环境保全型农业的举措及对我国的启示[J].西北农林科技大学学报:社会科学版, 2017, 17(4):99-105 http://d.old.wanfangdata.com.cn/Periodical/xbnlkjdxxb-sh201704014 MA J, HAN X H. Initiatives and inspiration of Japan with collaboration in promoting environmentally friendly agriculture[J]. Journal of Northwest A&F University:Social Science Edition, 2017, 17(4):99-105 http://d.old.wanfangdata.com.cn/Periodical/xbnlkjdxxb-sh201704014 |
| [7] | 张少兵, 王雅鹏.建设环境友好型现代农业的思考:难点与对策[J].生态经济, 2008, (1):99-101 http://d.old.wanfangdata.com.cn/Periodical/stjj200801023 ZHANG S B, WANG Y P. Thinking on the construction of environment-friendly modern agriculture:Difficulty and countermeasures[J]. Ecological Economy, 2008, (1):99-101 http://d.old.wanfangdata.com.cn/Periodical/stjj200801023 |
| [8] | 向东梅.促进农户采用环境友好技术的制度安排与选择分析[J].重庆大学学报:社会科学版, 2011, 17(1):42-47 http://d.old.wanfangdata.com.cn/Periodical/cqdxxb-shkx201101007 XIANG D M. Analysis on institutional arrangement and choices of how to promote farmers adopting EFT[J]. Journal of Chongqing University:Social Science Edition, 2011, 17(1):42-47 http://d.old.wanfangdata.com.cn/Periodical/cqdxxb-shkx201101007 |
| [9] | 罗小娟, 冯淑怡, PYTRIK R, 等.基于农户生物-经济模型的农业与环境政策响应模拟——以太湖流域为例[J].中国农村经济, 2013, (11):72-85 http://www.cnki.com.cn/Article/CJFDTotal-ZNJJ201311011.htm LUO X J, FENG S Y, PYTRIK R, et al. Simulation of agricultural and environmental policy response based on farmer bioeconomic model-Taking Taihu basin as a case[J]. Chinese Rural Economy, 2013, (11):72-85 http://www.cnki.com.cn/Article/CJFDTotal-ZNJJ201311011.htm |
| [10] | 胡博, 杨颖, 王芊, 等.环境友好型农业生态补偿实践进展[J].中国农业科技导报, 2016, 18(1):7-17 http://www.wanfangdata.com.cn/details/detail.do?_type=perio&id=zgnykjdb201601002 HU B, YANG Y, WANG Q, et al. Progress of eco-compensation practice for environmental friendly agriculture[J]. Journal of Agricultural Science and Technology, 2016, 18(1):7-17 http://www.wanfangdata.com.cn/details/detail.do?_type=perio&id=zgnykjdb201601002 |
| [11] | 褚彩虹, 冯淑怡, 张蔚文.农户采用环境友好型农业技术行为的实证分析——以有机肥与测土配方施肥技术为例[J].中国农村经济, 2012, (3):68-77 http://www.cnki.com.cn/Article/CJFDTotal-ZNJJ201203008.htm CHU C H, FENG S Y, ZHANG W W. Empirical analysis of farmers' adoption of environment-friendly agricultural technical behaviors-A case study of organic fertilizer and soil testing and fertilizer application[J]. Chinese Rural Economy, 2012, (3):68-77 http://www.cnki.com.cn/Article/CJFDTotal-ZNJJ201203008.htm |
| [12] | 储成兵, 李平.农户环境友好型农业生产行为研究——以使用环保农药为例[J].统计与信息论坛, 2013, 28(3):89-93 doi: 10.3969/j.issn.1007-3116.2013.03.015 CHU C B, LI P. Empirical research on farmers' behavior of environment-friendly production:Using environment-friendly pesticides as an example[J]. Statistics & Information Forum, 2013, 28(3):89-93 doi: 10.3969/j.issn.1007-3116.2013.03.015 |
| [13] | 肖新成.农户对农业面源污染认知及其环境友好型生产行为的差异分析——以江西省袁河流域化肥施用为例[J].环境污染与防治, 2015, 37(9):104-109 http://www.wanfangdata.com.cn/details/detail.do?_type=perio&id=hjwryfz201509019 XIAO X C. The differential analysis between farmers' cognition on agricultural non-point source pollution and their environmental friendly production behavior:A case study of fertilizer application in Yuan River basin, Jiangxi[J]. Environmental Pollution & Control, 2015, 37(9):104-109 http://www.wanfangdata.com.cn/details/detail.do?_type=perio&id=hjwryfz201509019 |
| [14] | 梁增芳, 肖新成, 倪九派.三峡库区环境友好型农业生产的意愿研究[J].西南大学学报:自然科学版, 2017, 39(1):150-157 http://d.old.wanfangdata.com.cn/Periodical/xnnydxxb201701023 LIANG Z F, XIAO X C, NI J P. Study on farmers' willingness to practice environment-friendly agriculture in the Three Gorges Reservoir region[J]. Journal of Southwest University:Natural Science Edition, 2017, 39(1):150-157 http://d.old.wanfangdata.com.cn/Periodical/xnnydxxb201701023 |
| [15] | 贺正楚, 翟欢欢.基于DEA三阶段模型的两型农业生产效率——以湖南省为例[J].农业系统科学与综合研究, 2011, 27(4):395-400 doi: 10.3969/j.issn.1001-0068.2011.04.003 HE Z C, ZHAI H H. Data envelopment analysis of three-stage model for production efficiency of two-oriented agriculture -Taking Hunan Province as an example[J]. System Sciences and Comprehensive Studies in Agriculture, 2011, 27(4):395-400 doi: 10.3969/j.issn.1001-0068.2011.04.003 |
| [16] | 刘子飞, 王昌海.有机农业生产效率的三阶段DEA分析——以陕西洋县为例[J].中国人口·资源与环境, 2015, 25(7):105-112 doi: 10.3969/j.issn.1002-2104.2015.07.015 LIU Z F, WANG C H. Organic agricultural production efficiency based on a three-stage DEA model:A case study of Yang County, Shaanxi Province[J]. China Population, Resources and Environment, 2015, 25(7):105-112 doi: 10.3969/j.issn.1002-2104.2015.07.015 |
| [17] | 潘丹, 应瑞瑶.中国农业生态效率评价方法与实证——基于非期望产出的SBM模型分析[J].生态学报, 2013, 33(12):3837-3845 http://www.wanfangdata.com.cn/details/detail.do?_type=perio&id=stxb201312029 PAN D, YING R Y. Agricultural eco-efficiency evaluation in China based on SBM model[J]. Acta Ecologica Sinica, 2013, 33(12):3837-3845 http://www.wanfangdata.com.cn/details/detail.do?_type=perio&id=stxb201312029 |
| [18] | 王宝义, 张卫国.中国农业生态效率测度及时空差异研究[J].中国人口·资源与环境, 2016, 26(6):11-19 doi: 10.3969/j.issn.1002-2104.2016.06.002 WANG B Y, ZHANG W G. A research of agricultural eco-efficiency measure in China and space-time differences[J]. China Population, Resources and Environment, 2016, 26(6):11-19 doi: 10.3969/j.issn.1002-2104.2016.06.002 |
| [19] | 张贇.基于非期望产出SBM模型及面板Tobit模型对中国农业生态效率的实证分析——以陕甘宁青四地区为例[J].海南金融, 2018, (2):17-28 doi: 10.3969/j.issn.1003-9031.2018.02.02 ZHANG Y. Empirical analysis of agricultural eco-efficiency in China based on the undesired output SBM model and panel Tobit model-A case study of four regions in Shaanxi, Gansu, Ningxia and Qinghai[J]. Hainan Finance, 2018, (2):17-28 doi: 10.3969/j.issn.1003-9031.2018.02.02 |
| [20] | CHARNES A, COOPER W W, ROODES E. Measuring the efficiency of decision making units[J]. European Journal of Operational Research, 1978, 2(6):429-444 doi: 10.1016/0377-2217(78)90138-8 |
| [21] | ANDERSEN P, PETERSEN N C. A procedure for ranking efficient units in data envelopment analysis[J]. Management Science, 1993, 39(10):1261-1264 doi: 10.1287/mnsc.39.10.1261 |
| [22] | 贺志亮, 刘成玉.我国农业生产效率及效率影响因素研究——基于三阶段DEA模型的实证分析[J].农村经济, 2015, (6):48-51 doi: 10.3969/j.issn.1007-7103.2015.06.015 HE Z L, LIU C Y. Research on agricultural production efficiency and its influencing factors in China[J]. Rural Economy, 2015, (6):48-51 doi: 10.3969/j.issn.1007-7103.2015.06.015 |
| [23] | EHRLICH P R, HOLDREN J P. Impact of population growth[J]. Science, 1971, 171(3977):1212-1217 doi: 10.1126/science.171.3977.1212 |
| [24] | DIETZ T, ROSA E A. Rethinking the environmental impacts of population, affluence and technology[J]. Human Ecology Review, 1994, 1(2):277-300 https://ostromworkshop.indiana.edu/library/node/21046 |
| [25] | 黄蕊, 王铮, 丁冠群, 等.基于STIRPAT模型的江苏省能源消费碳排放影响因素分析及趋势预测[J].地理研究, 2016, 35(4):781-789 http://d.old.wanfangdata.com.cn/Periodical/dlyj201604015 HUANG R, WANG Z, DING G Q, et al. Trend prediction and analysis of influencing factors of carbon emissions from energy consumption in Jiangsu Province based on STIRPAT model[J]. Geographical Research, 2016, 35(4):781-789 http://d.old.wanfangdata.com.cn/Periodical/dlyj201604015 |
| [26] | 吴义根, 冯开文, 李谷成.人口增长、结构调整与农业面源污染——基于空间面板STIRPAT模型的实证研究[J].农业技术经济, 2017(3):75-87 http://d.old.wanfangdata.com.cn/Conference/8838223 WU Y G, FENG K W, LI G C. Population growth, structural adjustment and agricultural non-point source pollution-An empirical study based on the spatial STIRPAT model[J]. Journal of Agrotechnical Economics, 2017, (3):75-87 http://d.old.wanfangdata.com.cn/Conference/8838223 |
| [27] | 胡雪萍, 方永丽.中国大气污染的影响因素及防治措施研究——基于STIRPAT模型和固定效应面板模型[J].工业技术经济, 2018, 37(2):107-113 doi: 10.3969/j.issn.1004-910X.2018.02.013 HU X P, FANG Y L. Study on influencing factors and preventive measures of atmospheric pollution in China-Based on STIRPAT model and fixed effect panel model[J]. Journal of Industrial Technological Economics, 2018, 37(2):107-113 doi: 10.3969/j.issn.1004-910X.2018.02.013 |
| [28] | COCCIA M. Driving forces of technological change:The relation between population growth and technological innovation:Analysis of the optimal interaction across countries[J]. Technological Forecasting and Social Change, 2014, 82:52-65 doi: 10.1016/j.techfore.2013.06.001 |
| [29] | 陈治国, 李成友, 刘向晖, 等.中国人口密度对创新水平的影响效应研究——基于双向固定效应模型的实证分析[J].石家庄经济学院学报, 2016, 39(6):21-26 http://www.wanfangdata.com.cn/details/detail.do?_type=perio&id=sjzjjxyxb201606004 CHEN Z G, LI C Y, LIU X H, et al. Research on the influential effect of innovation level on population density in China -Based on the two-way fixed effects model[J]. Journal of Shijiazhuang University of Economics, 2016, 39(6):21-26 http://www.wanfangdata.com.cn/details/detail.do?_type=perio&id=sjzjjxyxb201606004 |
