马腾1,,,
郑倩琳1,
刘妍君1,
罗飞2
1.中国地质大学(武汉)环境学院 武汉 430074
2.深圳市环境科学研究院 深圳 518114
基金项目: 国家科技重大专项课题2012ZX07204-003-04
详细信息
作者简介:廖曼, 主要研究方向为土壤和地下水调查污染方面的研究工作。E-mail:kathrinae@163.com
通讯作者:马腾, 主要研究方向为地下水污染防治。E-mail:mateng@cug.edu.cn
中图分类号:X82计量
文章访问数:811
HTML全文浏览量:9
PDF下载量:708
被引次数:0
出版历程
收稿日期:2018-08-12
录用日期:2019-01-05
刊出日期:2019-05-01
Tracing groundwater nitrogen source in Huai River Basin agro-ecosystem
LIAO Man1, 2,,MA Teng1,,,
ZHENG Qianlin1,
LIU Yanjun1,
LUO Fei2
1. School of Environment Studies, China University of Geoscience, Wuhan 430074, China
2. Shenzhen Academy of Environmental Sciences, Shenzhen 518114, China
Funds: the National Science and Technology Major Project of China2012ZX07204-003-04
More Information
Corresponding author:E-mail:mateng@cug.edu.cn
摘要
HTML全文
图
参考文献
相关文章
施引文献
资源附件
访问统计
摘要
摘要:淮河流域地下水体中的氮污染问题一直以来备受关注。为了从源头追溯氮污染物的来源,本文通过清单法收集淮河流域2002—2017年期间35个地级市的农业统计资料,首先构建基于化肥施用氮、人畜粪便返田氮、生物固氮、大气沉降氮、种子带入氮、秸秆带入氮为输入项和作物收获氮、反硝化脱氮、氨挥发脱氮为输出项的氮平衡模型,估算进入淮河流域农业生态系统内的氮盈余量和强度;然后利用氮盈余量与淋滤系数构建氮淋滤模型定量估算氮淋滤到地下水体中的量。研究发现:2002—2017年间淮河流域农业生态系统中氮年均输入量为1 005.01万t·a-1,化肥施用氮是最大的氮输入源,占总输入量的52.76%;淮河流域农业生态系统中氮年均输出量为706.43万t·a-1,作物收获氮在氮输出中所占的比例最大,达87.29%。随着时间的增加,氮盈余量和强度逐步降低。本次从地级市角度计算的氮源强度和其时间变化规律与以往从流域角度计算的氮源强度和其时间变化规律相差不大,保证了结果的准确性。从地区上分析,河南省各地级市的氮源强度最高,山东省和安徽省各地级市的最低。2002—2017年间,淮河流域农业区氮盈余量淋滤进入地下水中的氮污染物总量为26.22万~41.71万t·a-1,淋滤进入到地下水体中的氮污染物平均量为31.41万t·a-1,其中2006年最高。较大的氮淋滤值对水体环境造成了较大的污染负荷。采用SPSS 21.0中用F统计量和皮尔森相关系数(ρ)对地下水中的实际氮污染物浓度与估算值间的氮污染物量进行相关性检验,最终通过显著性检验且相关系数达到0.517,证实了本次模型选择的准确性。本文研究表示,2002—2017年淮河流域农业生态系统中地下水体中氮的来源主要为化肥输入,最主要的输出途径为作物收获,污染最严重年份为2006年,为解决农业面源污染问题提供了重要的前期资料,对地下水中氮污染的防控具有重要的现实意义。
关键词:地下水/
氮输入/
氮输出/
氮平衡模型/
氮淋滤模型
Abstract:Nitrogen pollution in groundwater systems in Huai River Basin has drawn a lot of attention. In order to trace the source of nitrogen pollution in groundwater, 2002-2017 agricultural statistics data for 35 cities in the Huai River Basin agro-ecosystem were collected. A nitrogen balance model was set up based on nitrogen input and output in Huai River Basin, and it was used to calculate nitrogen surplus and intensity in the basin. Nitrogen input included input from fertilizers, humans & animal excreta, atmospheric deposition, biological fixation, seed nitrogen and straw nitrogen. Nitrogen output included crop harvest, denitrification and ammonia volatilization output. Also, combined nitrogen surplus and leaching coefficient, the nitrogen leaching model was built to quantitatively estimate the amount of nitrogen leaching into groundwater bodies from agro-ecosystem in Huai River Basin. The results showed that average nitrogen input in Huai River Basin agro-ecosystem was up to 10 050 100 t·a-1 for the 2002-2017, fertilizer input was the largest source of this amount nitrogen input and it accounted for 52.76%. Average nitrogen output was up to 7 064 300 t·a-1 for the period 2002-2017, crop harvest was the largest amount output of this amount nitrogen and it accounted for 87.29%. Nitrogen surplus and nitrogen source intensity decreased gradually with time for the period from 2002 to 2017. Nitrogen source intensity result was the same with previous studies, which ensured the accuracy of the results. At the regional aspects, the city in Henan Province had the highest nitrogen source intensity, while the cities in Shandong and Anhui Provinces had the lowest nitrogen source intensity. The amount of nitrogen that leached into the groundwater in Huai River Basin agro-ecosystem was 2.622×10⁵-4.171×10⁵ t·a-1, with the highest amount in 2006. The average nitrogen amount in groundwater was 3.141×10⁵ t·a-1 for the period from 2002 to 2017, which caused a large pollution load in the water environment. F statistic and ρ value tests in SPSS 21.0 gave the relationship between the actual nitrate concentration in groundwater and the estimation nitrogen amount leaching into the groundwater. Finally, the estimated and observed values passed significance test, with a correlation coefficient of 0.517, which confirmed the accuracy of the model. Nitrogen input as chemical fertilizer input and nitrogen output as crop harvest were respectively the main input and output factors in the study area. The most serious pollution was in 2006. The study provided important data needed to solve non-point agricultural pollution with important practical implications for the prevention and control of nitrogen pollution in groundwater.
Key words:Groundwater/
Nitrogen input/
Nitrogen output/
Nitrogen balance model/
Nitrogen leaching model
HTML全文
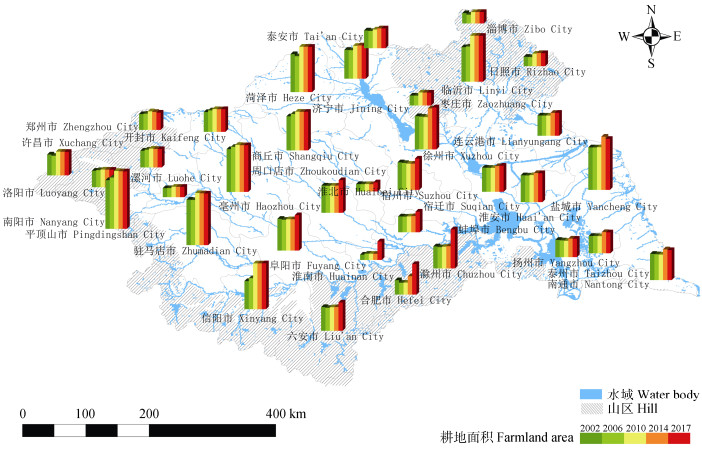
图12002—2017年淮河流域耕地面积变化趋势分布示意图
Figure1.Distribution map of change trend of farmland area in the Huai River Basin from 2002 to 2017
 下载: 全尺寸图片幻灯片
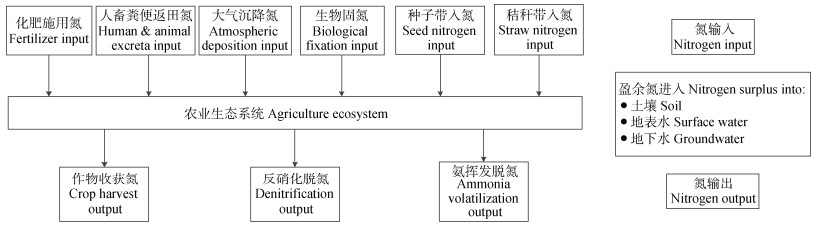
图2农业生态系统氮平衡示意图(改自于OECD, 2001[30])
Figure2.Nitrogen balance description picture of agriculture ecosystem (modified from OECD, 2001)
下载: 全尺寸图片幻灯片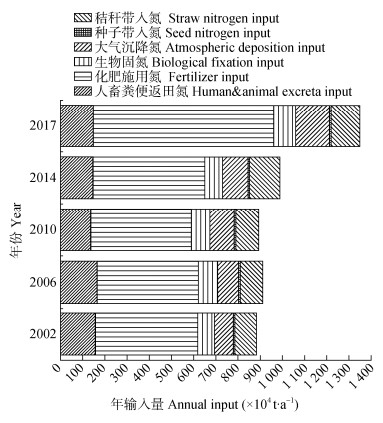
图32002—2017年淮河流域农业生态系统氮输入量的年际变化
Figure3.Annual variation of nitrogen input from different resources of agricultural ecosystem in the Huai River Basin from 2002 to 2017
下载: 全尺寸图片幻灯片
图42002—2017年淮河流域农业生态系统氮输出的年际变化
Figure4.Annual variation of nitrogen output through different ways of agricultural ecosystem in the Huai River Basin from 2002 to 2017
下载: 全尺寸图片幻灯片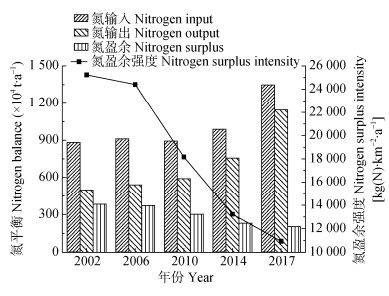
图52002—2017年淮河流域农业生态系统氮平衡与氮盈余强度的年际变化
Figure5.Annual variations of nitrogen balance and nitrogen surplus intensities of agricultural ecosystem in the Huai River Basin from 2002 to 2017
下载: 全尺寸图片幻灯片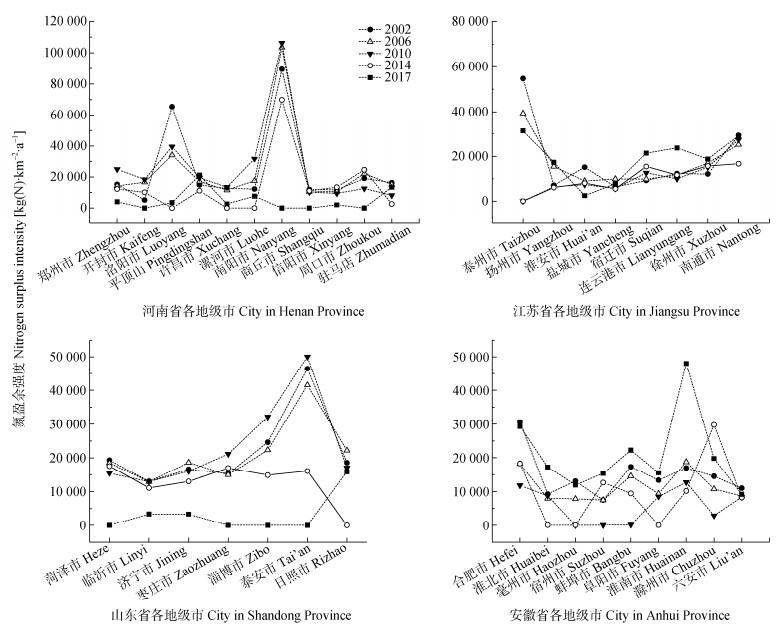
图62002—2017年淮河流域各地级市的农业生态系统氮盈余强度变化
Figure6.Nitrogen surplus intensities of agricultural ecosystems in different cities of Henan, Jiangsu, Shandong and Anhui Provinces in the Huai River Basin from 2002 to 2017
下载: 全尺寸图片幻灯片
图72002—2017年淮河流域农业生态系统淋滤进入地下水中氮污染物年际变化分布图
Figure7.Annual variation of nitrogen leaching into groundwater from agricultural ecosystem in Huai River Basin from 2002 to 2017
下载: 全尺寸图片幻灯片
图8淮河流域各市2014年淋溶进入地下水体的氮量空间分布
Figure8.Spatial distribution of nitrogen leaching into groundwater from agricultural ecosystem in 2014 in the Huai River Basin
下载: 全尺寸图片幻灯片表1人畜禽氮污染系数表[23-32]
Table1.Nitrogen pollution coefficient of feces and urine of human, livestock and poultry[23-32]
| 污染源类型 Pollution source type | 项目 Item | 总氮 Total nitrogen |
| 猪 Pig(kg·head-1) | 屎 Feces | 3.426 |
| 尿 Urine | 2.362 | |
| 牛 Cattle (kg·head-1) | 屎 Feces | 32.978 |
| 尿 Urine | 25.737 | |
| 羊、家禽 Sheep & poultry (kg·head-1) | 屎 Feces | 4.23 |
| 尿 Urine | 0.323 | |
| 人[2] Human(kg·cap.-1) | 粪尿 Feces & urine | 3.06 |
下载: 导出CSV表2不同固氮生物的生物固氮率
Table2.Biological nitrogen fixation rate in the Huai River Basin
| kg·hm-2·a-1 | ||||
| 大豆 Soybean | 花生 Peanut | 水稻 Rice | 微生物 Microbe | |
| 旱地非共生固氮 In dry land | 水田非共生固氮 In paddy fields | |||
| 128.5[35] | 95.6[26] | 45[36] | 15[26, 36] | 30[36] |
下载: 导出CSV表3淮河流域各年大气氮沉降量
Table3.Annual atmospheric nitrogen deposition in the Huai River Basin
| kg·hm-2·a-1 | |||||
| 年份 Year | 2002 | 2006 | 2010 | 2014 | 2017 |
| 氮沉降 Nitrogen deposition | 22.7[38] | 30.9[39] | 42.5[40] | 45.04[41] | 59.83[42] |
下载: 导出CSV表4作物秸秆与种子带入土壤的氮参数表
Table4.Amounts of nitrogen input into soil through straws and seeds of crops
| 作物 Crop | 草谷比 Ratio of straw to seeds | 秸秆含氮量 Straw nitrogen content (kg·t-1) | 籽粒含氮量 Seed nitrogen content (kg·t-1) | 焚烧秸秆含氮量 Nitrogen content of burnt straw (kg·t-1) | 种子投入量 Nitrogen input through seeds (kg·hm-2) | 返田比例 Rate of straw returned to soil | 焚烧比例 Burning rate of straw |
| 水稻 Rice | 0.9 | 8.26 | 14.60 | 2.68 | 69.20 | 0.30 | 0.70 |
| 玉米 Corn | 1.2 | 8.69 | 25.80 | 4.60 | 25.90 | 0.20 | 0.80 |
| 小麦 Wheat | 1.1 | 6.17 | 25.20 | 2.53 | 227.10 | 0.45 | 0.55 |
| 大豆 Soybean | 1.6 | 16.33 | 81.40 | 3.83 | 104.30 | — | 1.00 |
| 油菜 Rapeseed | 1.5 | 8.40 | 43.00 | 5.75 | 2.80 | 0.40 | 0.60 |
| 花生 Peanut | 0.8 | 18.00 | 12.96 | 0.00 | 300.00 | 0.90 | 0.10 |
| 表中数据来源于李书田等[28]、卞建民等[43]和马广文等[35]。The data in the table are derived from Li et al.[28], Bian et al.[43] and Ma et al.[35]. | |||||||
下载: 导出CSV表5农作物的氮摄取量
Table5.Nitrogen uptake of crops
| 作物种类 Crop | 水稻 Rice | 小麦 Wheat | 玉米 Corn | 大豆 Soybean | 花生 Peanut | 油菜 Rapeseed | 烟草 Tobacco | 麻类 Hemp | 水果 Fruit | 蔬菜 Vegetable |
| 氮摄取量 Nitrogen intake (kg·t-1) | 19.1 | 23.2 | 14.3 | 59.2 | 40 | 39.8 | 13 | 13 | 3 | 3.5 |
| 表中数据来源于马广文等[35]和徐昔保等[45]。The data were derived from Ma et al.[35] and Xu et al.[45]. | ||||||||||
下载: 导出CSV表6淮河流域不同地下水淋滤系数所占百分比
Table6.Percentage of groundwater leaching coefficient in cities of the Huai River Basin
| 淋滤系数 Leaching coefficient (%) | 5 | 10 | 15 |
| 所占百分比 Proportion (%) | 8.57 | 85.72 | 5.71 |
下载: 导出CSV表72002—2017 年淮河流域农业生态系统氮收支平衡
Table7.Nitrogen balance of agricultural ecosystem in the Huai River Basin from 2002 to 2017
| 类别 Category | 氮收支项目 Nitrogen input/output item | 变化范围 Range (×104t·a-1) | 年平均值 Annual average (×104t·a-1) | 所占比例 Proportion (%) |
| 氮输入 Nitrogen input | 总数 Sum | 883.16~1 348.75 | 1 005.01 | |
| 人畜粪便返田氮 Human & animal excreta input | 136.00~164.64 | 150.15 | 14.73 | |
| 化肥施用氮 Fertilizer input | 453.56~813.02 | 537.76 | 52.76 | |
| 生物固氮 Biological fixation input | 75.21~99.34 | 85.09 | 8.35 | |
| 大气沉降氮 Atmospheric deposition input | 85.56~152.08 | 111.16 | 10.90 | |
| 种子带入氮 Seed input | 6.50~8.13 | 7.52 | 0.74 | |
| 秸秆带入氮 Straw input | 97.59~135.92 | 113.33 | 11.12 | |
| 氮输出 Nitrogen output | 总数 Sum | 499.62~1 144.83 | 706.43 | |
| 作物收获氮 Crop harvest output | 375.25~874.26 | 539.24 | 87.29 | |
| 反硝化脱氮Denitrification output | 75.06~160.37 | 100.03 | 16.19 | |
| 氨挥发脱氮 Ammonia volatilization output | 49.31~110.20 | 67.16 | 10.87 | |
| 氮盈余 Nitrogen surplus (×104t·a-1) | 203.92~383.54 | 298.58 | ||
| 氮源强度 Nitrogen surplus intensity (kg·km-2·a-1) | 10 938~25 231 | 18 398 | ||
| 淋滤到地下水中的氮量 Nitrogen leaching into groundwater (×104t·a-1) | 26.22~41.71 | 31.41 | ||
下载: 导出CSV参考文献
| [1] | GRUBER N, GALLOWAY J N. An Earth-system perspective of the global nitrogen cycle[J]. Nature, 2008, 451(7176):293-296 doi: 10.1038/nature06592 |
| [2] | HAN P, KUMAR P, ONG B L. Remediation of nutrient-rich waters using the terrestrial plant, Pandanus amaryllifolius Roxb[J]. Journal of Environmental Sciences, 2014, 26(2):404-414 doi: 10.1016/S1001-0742(13)60426-X |
| [3] | 陈新明, 马腾, 蔡鹤生, 等.地下水氮污染的区域性调控策略[J].地质科技情报, 2013, 32(6):130-143 http://www.cnki.com.cn/Article/CJFDTOTAL-DZKQ201306021.htm CHEN X M, MA T, CAI H S, et al. Regional control of groundwater nitrogen contamination[J]. Geological Science and Technology Information, 2013, 32(6):130-143 http://www.cnki.com.cn/Article/CJFDTOTAL-DZKQ201306021.htm |
| [4] | 喻光晔.基于改进DRASTIC方法的淮河流域平原区浅层地下水脆弱性评价研究[D].南京: 南京大学, 2014: 12-35 http://cdmd.cnki.com.cn/Article/CDMD-10284-1016325550.htm YU G Y. Assessment of shallow groundwater vulnerability in Huaihe basin plant area based on improved DRASTIC method[D]. Nanjing: Nanjing University, 2014: 12-35 http://cdmd.cnki.com.cn/Article/CDMD-10284-1016325550.htm |
| [5] | 廖曼, 闫雅妮, 郑倩琳, 等.淮河流域平原区浅层地下水硝酸盐特殊脆弱性评价[J].南京大学学报:自然科学, 2016, 52(1):86-95 http://d.old.wanfangdata.com.cn/Periodical/njdxxb201601009 LIAO M, YAN Y N, ZHENG Q L, et al. Study on specific vulnerability of nitrate in shallow groundwater in Huai River plain area[J]. Journal of Nanjing University:Natural Sciences, 2016, 52(1):86-95 http://d.old.wanfangdata.com.cn/Periodical/njdxxb201601009 |
| [6] | 郑倩琳, 王妍妍, 闫雅妮, 等.淮河流域浅层地下水氮污染阻断优先控制区识别[J].南京大学学报:自然科学, 2016, 52(1):103-114 http://d.old.wanfangdata.com.cn/Periodical/njdxxb201601011 ZHENG Q L, WANG Y Y, YAN Y N, et al. Identification of prior control areas for nitrogen pollution blocking in shallow groundwater in Huai River Basin[J]. Journal of Nanjing University:Natural Sciences, 2016, 52(1):103-114 http://d.old.wanfangdata.com.cn/Periodical/njdxxb201601011 |
| [7] | ZHENG M M, ZHENG H, WU Y X, et al. Changes in nitrogen budget and potential risk to the environment over 20 years (1990-2010) in the agroecosystems of the Haihe Basin, China[J]. Journal of Environmental Sciences, 2015, 28(2):195-202 http://xueshu.baidu.com/usercenter/paper/show?paperid=d381f707052cbc1d005edf9fc0b13e5a&site=xueshu_se&hitarticle=1 |
| [8] | HAYAKAWA A, WOLI K P, SHIMIZU M, et al. Nitrogen budget and relationships with riverine nitrogen exports of a dairy cattle farming catchment in eastern Hokkaido, Japan[J]. Soil Science and Plant Nutrition, 2009, 55(6):800-819 doi: 10.1111/j.1747-0765.2009.00421.x |
| [9] | 赵中华, 邱祖民.桃江流域农业区氮平衡及时空差异性[J].水电能源科学, 2012, 30(5):83-86 doi: 10.3969/j.issn.1000-7709.2012.05.024 ZHAO Z H, QIU Z M. Nitrogen balance and its space-time difference of agricultural region in Tao River Basin[J]. Water Resources and Power, 2012, 30(5):83-86 doi: 10.3969/j.issn.1000-7709.2012.05.024 |
| [10] | LIU C, WATANABE M, WANG Q X. Changes in nitrogen budgets and nitrogen use efficiency in the agroecosystems of the Changjiang River basin between 1980 and 2000[J]. Nutrient Cycling in Agroecosystems, 2008, 80(1):19-37 doi: 10.1007/s10705-007-9118-2 |
| [11] | LEIP A, BRITZ W, WEISS F, et al. Farm, land, and soil nitrogen budgets for agriculture in Europe calculated with CAPRI[J]. Environmental Pollution, 2011, 159(11):3243-3253 doi: 10.1016/j.envpol.2011.01.040 |
| [12] | ZHANG W S, SWANEY D P, LI X Y, et al. Anthropogenic point-source and non-point-source nitrogen inputs into Huai River basin and their impacts on riverine ammonia-nitrogen flux[J]. Biogeosciences, 2015, 12(14):4275-4289 doi: 10.5194/bg-12-4275-2015 |
| [13] | RYDEN J C, BALL P R, GARWOOD E A. Nitrate leaching from grassland[J]. Nature, 1984, 311(5981):50-53 doi: 10.1038/311050a0 |
| [14] | LIAO L X, GREEN C T, BEKINS B A, et al. Factors controlling nitrate fluxes in groundwater in agricultural areas[J]. Water Resources Research, 2012, 48(6):W00L09 http://cn.bing.com/academic/profile?id=b6cbbd79ec8524c61d0e5ed6ba8eb0cd&encoded=0&v=paper_preview&mkt=zh-cn |
| [15] | SCHOLEFIELD D, TYSON K C, GARWOOD E A, et al. Nitrate leaching from grazed grassland lysimeters:Effects of fertilizer input, field drainage, age of sward and patterns of weather[J]. European Journal of Soil Science, 1993, 44(4):601-613 http://cn.bing.com/academic/profile?id=05f05a55610c1a2a3e4744448fb98056&encoded=0&v=paper_preview&mkt=zh-cn |
| [16] | WELCH H L, GREEN C T, COUPE R H. The fate and transport of nitrate in shallow groundwater in northwestern Mississippi, USA[J]. Hydrogeology Journal, 2011, 19(6):1239-1252 doi: 10.1007/s10040-011-0748-8 |
| [17] | DAVIS D M, GOWDA P H, MULLA D J, et al. Modeling nitrate nitrogen leaching in response to nitrogen fertilizer rate and tile drain depth or spacing for southern Minnesota, USA[J]. Journal of Environmental Quality, 2000, 29(5):1568-1581 http://cn.bing.com/academic/profile?id=ce3a760a409372acc45925170f97dc00&encoded=0&v=paper_preview&mkt=zh-cn |
| [18] | JOHNES P J. Evaluation and management of the impact of land use change on the nitrogen and phosphorus load delivered to surface waters:The export coefficient modelling approach[J]. Journal of Hydrology, 1996, 183(3/4):323-349 http://cn.bing.com/academic/profile?id=c850455940a641fbb0b7b45d71d1b5ae&encoded=0&v=paper_preview&mkt=zh-cn |
| [19] | B?HLKE J K. Groundwater recharge and agricultural contamination[J]. Hydrogeology Journal, 2002, 10(1):153-179 doi: 10.1007/s10040-001-0183-3 |
| [20] | TESORIERO A J, SAAD D A, BUROW K R, et al. Linking ground-water age and chemistry data along flow paths:Implications for trends and transformations of nitrate and pesticides[J]. Journal of Contaminant Hydrology, 2007, 94(1/2):139-155 http://cn.bing.com/academic/profile?id=555ee01d8415ed58ac05492be2ec1471&encoded=0&v=paper_preview&mkt=zh-cn |
| [21] | 陈荦.沙颍河流域地下水流与硝酸盐运移模拟及其对地表水污染的贡献研究[D].南京: 南京大学, 2013: 24-78 http://cdmd.cnki.com.cn/Article/CDMD-10284-1015575007.htm CHEN L. Modeling of the water flow and nitrate transport in the shallow aquifer of the Shaying River basin and its contribution to river pollution[D]. Nanjing: Nanjing University, 2013: 24-78 http://cdmd.cnki.com.cn/Article/CDMD-10284-1015575007.htm |
| [22] | 马天海, 徐静, 单楠, 等.贾鲁河流域旱作农业区非点源氮污染负荷分布规律及其影响因素研究[J].南京大学学报:自然科学, 2016, 52(1):77-85 http://d.old.wanfangdata.com.cn/Periodical/njdxxb201601008 MA T H, XU J, SHAN N, et al. The study on distribution of dry farming agricultural non-point source pollution load and influencing factors in Jialu River Watershed[J]. Journal of Nanjing University:Natural Sciences, 2016, 52(1):77-85 http://d.old.wanfangdata.com.cn/Periodical/njdxxb201601008 |
| [23] | 周亮, 徐建刚, 孙东琪, 等.淮河流域农业非点源污染空间特征解析及分类控制[J].环境科学, 2013, 34(2):547-554 http://d.old.wanfangdata.com.cn/Periodical/hjkx201302019 ZHOU L, XU J G, SUN D Q, et al. Spatial heterogeneity and classified control of agricultural non-point source pollution in Huaihe River Basin[J]. Environmental Science, 2013, 34(2):547-554 http://d.old.wanfangdata.com.cn/Periodical/hjkx201302019 |
| [24] | 张立争, 王南江, 李卫东, 等.淮河流域非点源污染综合治理研究[J].水资源与水工程学报, 2006, 17(4):65-67 doi: 10.3969/j.issn.1672-643X.2006.04.017 ZHANG L Z, WANG N J, LI W D, et al. Study on the comprehensive treatment to control the non-point source pollution in Huaihe River Basin[J]. Journal of Water Resources and Water Engineering, 2006, 17(4):65-67 doi: 10.3969/j.issn.1672-643X.2006.04.017 |
| [25] | 刘钦普.淮河流域化肥施用空间特征及环境风险分析[J].生态环境学报, 2015, 24(9):1512-1518 http://d.old.wanfangdata.com.cn/Periodical/tryhj201509014 LIU Q P. Distribution and environmental risk assessment of fertilizer application on farmland in Huai River Basin[J]. Ecology and Environmental Sciences, 2015, 24(9):1512-1518 http://d.old.wanfangdata.com.cn/Periodical/tryhj201509014 |
| [26] | 张汪寿, 苏静君, 杜新忠, 等. 1990-2010年淮河流域人类活动净氮输入[J].应用生态学报, 2015, 26(6):1831-1839 http://d.old.wanfangdata.com.cn/Periodical/yystxb201506031 ZHANG W S, SU J J, DU X Z, et al. Net anthropogenic nitrogen input to Huaihe River Basin, China during 1990-2010[J]. Chinese Journal of Applied Ecology, 2015, 26(6):1831-1839 http://d.old.wanfangdata.com.cn/Periodical/yystxb201506031 |
| [27] | 叶念军, 葛伟亚, 龚建师, 等.淮河流域环境地质综合研究报告[R].南京:南京地质矿产研究所, 2009:59-219 http://www.cnki.com.cn/Article/CJFDTOTAL-NJDZ201601012.htm YE N J, GE W Y, GONG J S, et al. Report of comprehensive environmental geological research in Huaihe River Basin[R]. Nanjing:Nanjing Geology and Mineral Resources Institute, 2009:59-219 http://www.cnki.com.cn/Article/CJFDTOTAL-NJDZ201601012.htm |
| [28] | 李书田, 金继运.中国不同区域农田养分输入、输出与平衡[J].中国农业科学, 2011, 44(20):4207-4229 http://d.old.wanfangdata.com.cn/Periodical/zgnykx201120009 LI S T, JIN J Y. Characteristics of nutrient input/output and nutrient balance in different regions of China[J]. Scientia Agricultura Sinica, 2011, 44(20):4207-4229 http://d.old.wanfangdata.com.cn/Periodical/zgnykx201120009 |
| [29] | SAINJU U M, LENSSEN A W, ALLEN B L, et al. Nitrogen balance in dryland agroecosystem in response to tillage, crop rotation, and cultural practice[J]. Nutrient Cycling in Agroecosystems, 2018, 110(3):467-483 doi: 10.1007/s10705-018-9909-7 |
| [30] | OECD. OECD national soil surface nitrogen balances:Explanatory notes[R]. Paris:Organization for Economic Co-operation and Development, 2001 https://www.oecd.org/tad/sustainable-agriculture/1916652.pdf |
| [31] | 沈志良, 刘群, 张淑美.长江无机氮的分布变化和迁移[J].海洋与湖沼, 2003, 34(4):355-363 doi: 10.3321/j.issn:0029-814X.2003.04.002 SHEN Z L, LIU Q, ZHANG S M. Distribution, variation and removal patterns of inorganic nitrogen in the Changjiang River[J]. Oceanologia et Limnologia Sinica, 2003, 34(4):355-363 doi: 10.3321/j.issn:0029-814X.2003.04.002 |
| [32] | MATSUMOTO N, PAISANCHAROEN K, ANDO S. Effects of changes in agricultural activities on the nitrogen cycle in Khon Kaen Province, Thailand between 1990-1992 and 2000-2002[J]. Nutrient Cycling in Agroecosystems, 2010, 86(1):79-103 doi: 10.1007/s10705-009-9275-6 |
| [33] | YAN W J, MAYORGA E, LI X Y, et al. Increasing anthropogenic nitrogen inputs and riverine DIN exports from the Changjiang River basin under changing human pressures[J]. Global Biogeochemical Cycles, 2010, 24(4):GB0A06 http://cn.bing.com/academic/profile?id=da9f5ce9e7c54e8b856593339ea0628f&encoded=0&v=paper_preview&mkt=zh-cn |
| [34] | 朱兆良, 文启效.中国土壤氮素[M].南京:江苏科学技术出版社, 1992:24-65 ZHU Z L, WEN Q X. Nitrogen in Soils of China[M]. Nanjing:Jiangsu Science and Technology Press, 1992:24-65 |
| [35] | 马广文, 香宝, 银山, 等.长江流域农业区非点源氮的平衡变化及其区域性差异[J].环境科学研究, 2009, 22(2):132-137 http://d.old.wanfangdata.com.cn/Periodical/hjkxyj200902002 MA G W, XIANG B, YIN S, et al. Budget changes and district diversity of non-point source nitrogen in agricultural fields in the Yangtze River basin[J]. Research of Environmental Sciences, 2009, 22(2):132-137 http://d.old.wanfangdata.com.cn/Periodical/hjkxyj200902002 |
| [36] | 张欢, 李恒鹏, 李新艳, 等.太湖流域典型农业区氮平衡时间变化特征及驱动因素[J].土壤通报, 2014, 45(5):1119-1129 http://d.old.wanfangdata.com.cn/Periodical/trtb201405017 ZHANG H, LI H P, LI X Y, et al. Temporal changes of nitrogen balance and their driving factors in typical agricultural area of lake tai basin[J]. Chinese Journal of Soil Science, 2014, 45(5):1119-1129 http://d.old.wanfangdata.com.cn/Periodical/trtb201405017 |
| [37] | LIU X J, ZHANG Y, HAN W X, et al. Enhanced nitrogen deposition over China[J]. Nature, 2013, 494(7438):459-462 doi: 10.1038/nature11917 |
| [38] | XIONG Z Q, XIE Y X, XING G X, et al. Measurements of nitrous oxide emissions from vegetable production in China[J]. Atmospheric Environment, 2006, 40(12):2225-2234 doi: 10.1016/j.atmosenv.2005.12.008 |
| [39] | 谢迎新, 张淑利, 赵旭, 等.长江三角洲地区雨水中NH4+-N/NO3--N和δ15NH4+值的变化[J].应用生态学报, 2008, 19(9):2035-2041 http://d.old.wanfangdata.com.cn/Periodical/yystxb200809027 XIE Y X, ZHANG S L, ZHAO X, et al. Seasonal variation patterns of NH4+-N/NO3--N ratio and δ15NH4+ value in rainwater in Yangtze River Delta[J]. Chinese Journal of Applied Ecology, 2008, 19(9):2035-2041 http://d.old.wanfangdata.com.cn/Periodical/yystxb200809027 |
| [40] | SUN L Y, LIU Y L, WANG J Y, et al. Atmospheric nitrogen and phosphorus deposition at three sites in Nanjing, China, and possible links to nitrogen deposition sources[J]. CLEAN-Soil, Air, Water, 2014, 42(11):1650-1659 doi: 10.1002/clen.201300692 |
| [41] | 朱炫, 潘杨, 焦锋, 等.大气氮磷沉降量分析——以杭州北里湖为例[J].安全与环境学报, 2015, 15(3):313-316 http://www.cnki.com.cn/Article/CJFDTotal-AQHJ201503070.htm ZHU X, PAN Y, JIAO F, et al. Analysis of the atmospheric deposition of nitrogen and phosphorus-Taking with Beili Lake as an example[J]. Journal of Safety and Environment, 2015, 15(3):313-316 http://www.cnki.com.cn/Article/CJFDTotal-AQHJ201503070.htm |
| [42] | 刘超明, 万献军, 曾伟坤, 等.洞庭湖大气氮湿沉降的时空变异[J].环境科学学报, 2018, 38(3):1137-1146 http://d.old.wanfangdata.com.cn/Periodical/hjkxxb201803035 LIU C M, WAN X J, ZENG W K, et al. Spatio-temporal variability of bulk nitrogen deposition in the Dongting Lake region[J]. Acta Scientiae Circumstantiae, 2018, 38(3):1137-1146 http://d.old.wanfangdata.com.cn/Periodical/hjkxxb201803035 |
| [43] | 卞建民, 李育松, 胡昱欣, 等.吉林西部农田生态系统氮平衡及其水环境影响研究[J].环境科学学报, 2014, 34(7):1862-1868 http://d.old.wanfangdata.com.cn/Periodical/hjkxxb201407029 BIAN J M, LI Y S, HU Y X, et al. Nitrogen balance of farmland ecosystem in the western Jilin Province and its effect on water environment[J]. Acta Scientiae Circumstantiae, 2014, 34(7):1862-1868 http://d.old.wanfangdata.com.cn/Periodical/hjkxxb201407029 |
| [44] | BAO X, WATANABE M, WANG Q X, et al. Nitrogen budgets of agricultural fields of the Changjiang River basin from 1980 to 1990[J]. Science of the Total Environment, 2006, 363(1/3):136-148 doi: 10.1016-j.scitotenv.2005.06.029/ |
| [45] | 徐昔保, 杨桂山, 李恒鹏.三峡库区1980~2005年农业用地氮平衡时空变化研究[J].环境科学, 2009, 30(8):2227-2233 doi: 10.3321/j.issn:0250-3301.2009.08.008 XU X B, YANG G S, LI H P. Spatio-temporal changes of nitrogen balance in 1980-2005 for agricultural land in Three Gorges Reservoir Area[J]. Environmental Science, 2009, 30(8):2227-2233 doi: 10.3321/j.issn:0250-3301.2009.08.008 |
| [46] | 叶飞, 卞新民, 胡大伟, 等.江苏省农业非点源污染地区差异评价与控制对策[J].水资源保护, 2006, 22(6):86-88 doi: 10.3969/j.issn.1004-6933.2006.06.024 YE F, BIAN X M, HU D W, et al. Regional difference and countermeasures of agricultural non-point source pollution in Jiangsu Province[J]. Water Resources Protection, 2006, 22(6):86-88 doi: 10.3969/j.issn.1004-6933.2006.06.024 |
| [47] | DEMPSTER D N, JONES D L, MURPHY D V. Clay and biochar amendments decreased inorganic but not dissolved organic nitrogen leaching in soil[J]. Soil Research, 2012, 50(3):216-221 doi: 10.1071/SR11316 |
| [48] | ZEBARTH B J, PAUL J W, VAN KLEECK R. The effect of nitrogen management in agricultural production on water and air quality:evaluation on a regional scale[J]. Agriculture, Ecosystems & Environment, 1999, 72(1):35-52 http://cn.bing.com/academic/profile?id=765197556a7c4b19aadc4723bb2ddff7&encoded=0&v=paper_preview&mkt=zh-cn |
| [49] | HAN Y G, FAN Y T, YANG P L, et al. Net anthropogenic nitrogen inputs (NANI) index application in Mainland China[J]. Geoderma, 2014, 213(1):87-94 http://cn.bing.com/academic/profile?id=114b3e197026fe96644af7fcfc0eebf3&encoded=0&v=paper_preview&mkt=zh-cn |
| [50] | REN H Y, WAN X, YANG F, et al. Association between changing mortality of digestive tract cancers and water pollution:A case study in the Huai River Basin, China[J]. International Journal of Environmental Research and Public Health, 2015, 12(1):214-226 |
| [51] | CONSTANTIN J, MARY B, LAURENT F, et al. Effects of catch crops, no till and reduced nitrogen fertilization on nitrogen leaching and balance in three long-term experiments[J]. Agriculture, Ecosystems & Environment, 2010, 135(4):268-278 doi: 10.1016-j.agee.2009.10.005/ |
| [52] | 向东进, 李宏伟, 刘小雅.实用多元统计分析[M].武汉:中国地质大学出版社, 2005:42-98 XIANG D J, LI H W, LIU X Y. Applied Multivariate Statistical Analysis[M]. Wuhan:China University of Geosciences Press, 2005:42-98 |
