The Genetic Diversity of Common Millet (Panicum miliaceum) Germplasm Resources Based on the EST-SSR Markers
Jieli He1,?, Tiantian Shi2,?, Ling Chen3, Haigang Wang3, Zhijun Gao4, Meihong Yang1, Ruiyun Wang,2,3,*, Zhijun Qiao,3,*1 College of Arts and Science, Shanxi Agricultural University, Taigu 030801, China 2 College of Agronomy, Shanxi Agricultural University, Taigu 030801, China 3 Shanxi Key Laboratory of Genetic Resources and Genetic Improvement of Minor Crops, Key Laboratory of Crop Gene Resources and Germplasm Enhancement on Loess Plateau, Ministry of Agriculture, Institute of Crop Germplasm Resources, Shanxi Academy of Agricultural Sciences, Taiyuan 030031, China 4 Erdos Institute of Agriculture and Animal Husbandry, Erdos 017200, China
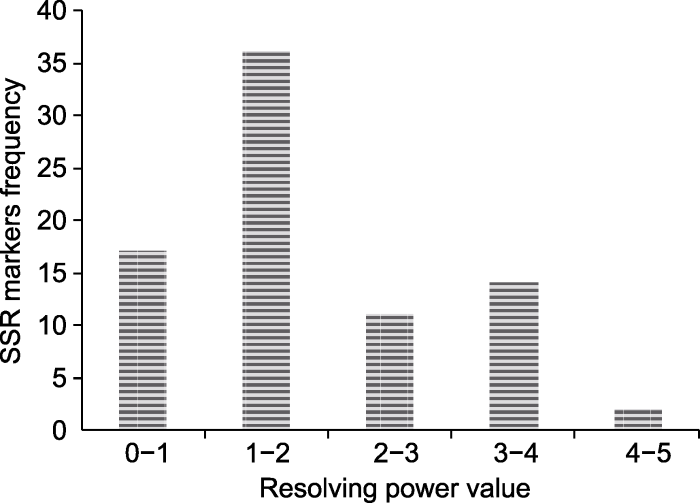
Abstract The EST-SSR molecular markers of common millet (Panicum miliaceum) were developed by high-throughput sequencing. Using these markers, we assessed the genetic diversity in a panel of 144 common millet accessions collected from different ecotopic regions in China and abroad. It was shown that 80 pairs of these markers were polymorphic, with the efficiency of approximately 40%. The resolution power (Rp) was 0.67-4.67 (mean 2.00) and the amplified product sizes ranged from 50 to 500 bp. Among the examined 144 accessions, 206 allelic variations were identified in 80 loci, with 2-3 alleles at each locus. The Shannon’s diversity index (I) ranged from 0.659 3 (RYW108) to 1.087 2 (RYW124) with an average of 0.859 9. The range of polymorphism information content (PIC) was 0.222 9 (RYW98) -0.717 2 (RYW124) with an average of 0.457 3. Based on UPGMA, these 144 accessions were classified into 3 groups, two of which belonged to the the Northern China spring-sowing ecotopes and one group was mainly from the Loess Plateau spring-summer-sowing ecotopes. Based on Structure (K=4), all the accessions were divided into four groups, of which two groups represented the gene pool originated from the Northern China, whereas the other two groups from the Loess Plateau and abroad accessions. Based on principal component analysis (PCA), the accessions were clustered into seven groups, consistent with their geographic origins. Keywords:Panicum miliaceum;genetic diversity;PCA;EST-SSR markers
PDF (1332KB)摘要页面多维度评价相关文章导出EndNote|Ris|Bibtex收藏本文 引用本文 何杰丽, 石甜甜, 陈凌, 王海岗, 高志军, 杨美红, 王瑞云, 乔治军. 糜子EST-SSR分子标记的开发及种质资源遗传多样性分析. 植物学报, 2019, 54(6): 723-732 doi:10.11983/CBB19037 He Jieli, Shi Tiantian, Chen Ling, Wang Haigang, Gao Zhijun, Yang Meihong, Wang Ruiyun, Qiao Zhijun. The Genetic Diversity of Common Millet (Panicum miliaceum) Germplasm Resources Based on the EST-SSR Markers. Chinese Bulletin of Botany, 2019, 54(6): 723-732 doi:10.11983/CBB19037
Table 3 表3 表3不同生态区糜子的遗传多样性参数 Table 3Parameters of genetic diversity in different ecotope of common millet
Ecotope/ abroad
Accessions
Na
Ne
I
Ho
He
PIC
NWSS
4
2.3375±0.5017
2.1517±0.4194
0.7644±0.2178
0.8042±0.2688
0.5944±0.1193
0.3551
NSP
48
2.5750±0.4975
2.3106±0.3211
0.8604±0.1576
0.8228±0.1308
0.5655±0.0604
0.4536
LPSS
37
2.5750±0.4975
2.2803±0.3110
0.8506±0.1534
0.8384±0.1166
0.5615±0.0595
0.4203
NES
9
2.5125±0.5030
2.2435±0.3929
0.8289±0.1823
0.7937±0.1732
0.5737±0.0909
0.4212
NSU
13
2.5625±0.4992
2.2815±0.3527
0.8496±0.1632
0.7946±0.1608
0.5712±0.0667
0.4304
SAW
2
2.2375±0.5092
2.0608±0.4387
0.7347±0.2316
0.7812±0.3265
0.6813±0.2006
0.2156
Domestic
113
2.5750 ±0.4975
2.3122±0.3086
0.8628±0.1554
0.8200±0.1188
0.5625±0.0584
0.4651
Abroad
31
2.5750±0.4975
2.2464±0.2909
0.8387±0.1449
0.8540±0.1193
0.5571±0.0561
0.3896
NWSS, NSP, LPSS, NES, NSU and SAW are the same as Table 1. Na: Observed number of alleles; Ne: Effective number of alleles; I: Shannon’s diversity index; Ho: Observed heterozygosity; He: Expected heterozygosity; PIC: Polymorphism information content NWSS、NSP、LPSS、NES、NSU和SAW同表1。Na: 观测等位基因数; Ne: 有效等位基因数; I: 多样性指数; Ho: 观测杂合度; He: 期望杂合度; PIC: 多态性信息含量
Table 4 表4 表4各糜子群体间的Nei氏遗传距离与遗传一致度 Table 4Parameters of Nei’s genetic distance and Nei’s genetic agreement in common millet populations
Population
NWSS
NSP
LPSS
NES
NSU
SAW
Abroad
NWSS
0.9560
0.9614
0.9487
0.9380
0.8694
0.9477
NSP
0.0449
0.9884
0.9678
0.9794
0.9110
0.9864
LPSS
0.0394
0.0117
0.9716
0.9830
0.9116
0.9865
NES
0.0527
0.0327
0.0288
0.9675
0.8974
0.9587
NSU
0.0640
0.0208
0.0171
0.0331
0.9023
0.9762
SAW
0.1400
0.0932
0.0926
0.1083
0.1029
0.9102
Abroad
0.0537
0.0137
0.0136
0.0422
0.0240
0.0941
NWSS, NSP, LPSS, NES, NSU and SAW are the same as Table 1. Nei’s genetic distances are below the diagonal; Nei’s genetic agreements are above the diagonal. NWSS、NSP、LPSS、NES、NSU和SAW同表1。表格对角线以下为Nei氏遗传距离; 表格对角线以上为Nei氏遗传一致度。
AzevedoALS, CostaPP, MachadoJC, MachadoMA, PereiraAV, da Silva LédoFJ ( 2012). Cross species amplification of Pennisetum glaucum microsatellite markers in Pennisetum purpureum and genetic diversity of napier grass accessions Crop Sci 52, 1776-1785. [本文引用: 1]
BonmanJM, BabikerEM, Cuesta-MarcosA, Esvelt-KlosK, Brown-GuediraG, ChaoSM, SeeD, ChenJL, AkhunovE, ZhangJL, BockelmanHE, GordonTC ( 2015). Genetic diversity among wheat accessions from the USDA national small grains collection Crop Sci 55, 1243-1253. [本文引用: 1]
ChangmeiS, DorothyJ ( 2014). Millet—the frugal grain Int J Sci Res Rev 3(4), 75-90. [本文引用: 1]
ChoYl, ChungJW, LeeGA, MaKH, DixitA, GwagJG, ParkYJ ( 2010). Development and characterization of twenty-five new polymorphic microsatellite markers in proso millet ( Panicum miliaceum L.) Genes Genomics 32, 267-273. [本文引用: 2]
CourtoisB, FrouinJ, GrecoR, BruschiG, DrocG, HamelinC, RuizM, ClémentG, EvrardJC, Van CoppenoleS, KatsantonisD, OliveiraM, Negr?oS, MatosC, CavigioloS, LupottoE, PiffanelliP, AhmadiN ( 2012). Genetic diversity and population structure in a European collection of rice Crop Sci 52, 1663-1675. [本文引用: 1]
EvannoG, RegnautS, GoudetJ ( 2005). Detecting the number of clusters of individuals using the software structure: a simulation study Mol Ecol 14, 2611-2620. [本文引用: 1]
FalushD, StephensM, PritchardJK ( 2003). Inference of population structure using multilocus genotype data: linked loci and correlated allele frequencies Genetics 164, 1567-1587. [本文引用: 1]
HabiyaremyeC, MatanguihanJB, GuedesJD, GanjyalGM, WhitemanMR, KidwellKK, MurphyKM ( 2017). Proso millet ( Panicum miliaceum L.) and its potential for cultivation in the pacific northwest, U.S: a review Front Plant Sci 7, 1961. [本文引用: 1]
HuXY, WangJF, LuP, ZhangHS ( 2009). Assessment of genetic diversity in broomcorn millet ( Panicum miliaceum L.) using SSR markers J Genet Genomics 36, 491-500. [本文引用: 1]
HuntHV, CampanaMG, LawesMC, ParkYJ, BowerMA, HoweCJ, JonesMK ( 2011). Genetic diversity and phylogeography of broomcorn millet ( Panicum miliaceum L.) across Eurasia Mol Ecol 20, 4756-4771. [本文引用: 1]
LiuKJ, MuseSV ( 2005). PowerMarker: an integrated analysis environment for genetic marker analysis Bioinformatics 21, 2128-2129. [本文引用: 1]
LiuMX, XuY, HeJH, ZhangS, WangYY, LuP ( 2016). Genetic diversity and population structure of broomcorn millet ( Panicum miliaceum L.) cultivars and landraces in China based on microsatellite markers Int J Mol Sci 17, 370. [本文引用: 1]
LuHY, ZhangJP, LiuKB, WuNQ, LiYM, ZhouKS, YeML, ZhangTY, ZhangHJ, YangXY, ShenLC, XuDK, LiQ ( 2009). Earliest domestication of common millet ( Panicum miliaceum ) in East Asia extended to 10, 000 years ago Proc Natl Acad Sci USA 106, 7367-7372. [本文引用: 1]
MurrayMG, ThompsonWF ( 1980). Rapid isolation of high molecular weight plant DNA Nucleic Acids Res 8, 4321-4325. [本文引用: 1]
PrevostA, WilkinsonMJ ( 1999). A new system of comparing PCR primers applied to ISSR fingerprinting of potato cultivars Theor Appl Genet 98, 107-112. [本文引用: 2]
RajputSG, Plyler-HarvesonT, SantraDK ( 2014). Development and characterization of SSR markers in proso millet based on switchgrass genomics Am J Plant Sci 5, 175-186. [本文引用: 1]
RajputSG, SantraDK ( 2016). Evaluation of genetic diversity of proso millet germplasm available in the United States using simple-sequence repeat markers Crop Sci 56, 2401-2409. [本文引用: 1]
RohlfFJ (2002). NTSYS-pc: Numerical Taxonomy and Multivariate Analysis System, Version 2.10. New York: Exter Publishing Ltd. Setauket. [本文引用: 1]
SahaD, Channabyre GowdaMV, AryaL, VermaM, BansalKC ( 2016). Genetic and genomic resources of small millets Crit Rev Plant Sci 35, 56-79. [本文引用: 1]
SatyaP, KaranM, JanaS, MitraS, SharmaA, KarmakarPG, RayDP ( 2015). Start codon targeted (SCoT) polymorphism reveals genetic diversity in wild and domesticated populations of ramie ( Boehmeria nivea L Gaudich.), a premium textile fiber producing species. Meta Gene 3, 62-70. [本文引用: 1]
TamuraK, PetersonD, PetersonN, StecherG, NeiM, KumarS ( 2011). MEGA5: molecular evolutionary genetics analysis using maximum likelihood, evolutionary distance, and maximum parsimony methods Mol Biol Evol 665, 2731-2739. [本文引用: 1]
TiwarG, SinghR, SinghN, ChoudhuryDR, PaliwalR, KumarA, GuptaV ( 2016). Study of arbitrarily amplified (RAPD and ISSR) and gene targeted (SCoT and CBDP) markers for genetic diversity and population structure in kalmegh [Andrographis paniculata(Burm. f.) Nees] Ind Crops Prod 86, 1-11. [本文引用: 1]
Van InghelandtD, MelchingerAE, LebretonC, StichB ( 2010). Population structure and genetic diversity in a commercial maize breeding program assessed with SSR and SNP markers Theor Appl Genet 120, 1289-1299. [本文引用: 1]
WangRY, HuntHV, QiaoZJ, WangL, HanYH ( 2016). Diversity and cultivation of broomcorn millet ( Panicum miliaceum L.) in China: a review Econ Bot 70, 332-342. [本文引用: 1]
WangRY, WangHG, LiuXY, JiX, ChenL, LuP, LiuMX, TengB, QiaoZJ ( 2018). Waxy allelic diversity in common millet(Panicum miliaceum L.) in China Crop J 6, 377-385. [本文引用: 1]
YehFC, BoyleTJB ( 1997). Population genetic analysis of codominant and dominant markers and quantitative traits Belg J Bot 129, 157-163. [本文引用: 1]
Cross species amplification of Pennisetum glaucum microsatellite markers in Pennisetum purpureum and genetic diversity of napier grass accessions 1 2012
... Rp值与微卫星标记信息直接关联, 能反映标记有效等位基因的分辨力, 是遗传差异评估的有效指标(Prevost and Wilkinson, 1999; Azevedo et al., 2012).以往研究显示, 苎麻(Boehmeria nivea)、穿心莲(Andrographis paniculata)和马铃薯(Solanum tuberosum) Rp值分别为3.22、5.36和6.9 (Prevost and Wilkinson, 1999; Satya et al., 2015; Tiwar et al., 2016), 而糜子Rp值为0.88-3.15 (Rajput et al., 2014; 王瑞云等, 2017b; 薛延桃等, 2018; 王璐琳等, 2018).本研究结果(Rp平均值为2.00)处于上述范围.由此表明, 不同植物的Rp值存在差异, 可能与物种自身特性有关.本研究开发的80个EST-SSR分子标记可作为评估糜子遗传多样性和阐明其群体结构的有效工具. ...
Genetic diversity among wheat accessions from the USDA national small grains collection 1 2015
PowerMarker: an integrated analysis environment for genetic marker analysis 1 2005
... 读取电泳条带并记录为基因型数据(0, 1), 在Excel中转换成不同软件相应格式.用PopGen1.32 (Yeh and Boyle, 1997)和PowerMarker 3.25 (Liu and Muse, 2005)软件计算遗传多样性衡量参数.用MEGA 5.0 (Tamura et al., 2011)和Structure 2.2 (Falush et al., 2003)构建聚类图.用NTSYSpc2.11 (Rohlf, 2002)进行主成分分析(principal component analysis, PCA).利用Genepop on the web在线软件(http://genepop.curtin.edu.au.html)对群体各标记位点的无效等位基因频率和哈迪-温伯格平衡(Hardy- Weinberg equilibrium)进行检验. ...
Genetic diversity and population structure of broomcorn millet ( Panicum miliaceum L.) cultivars and landraces in China based on microsatellite markers 1 2016
Start codon targeted (SCoT) polymorphism reveals genetic diversity in wild and domesticated populations of ramie ( Boehmeria nivea L 1 2015
... Rp值与微卫星标记信息直接关联, 能反映标记有效等位基因的分辨力, 是遗传差异评估的有效指标(Prevost and Wilkinson, 1999; Azevedo et al., 2012).以往研究显示, 苎麻(Boehmeria nivea)、穿心莲(Andrographis paniculata)和马铃薯(Solanum tuberosum) Rp值分别为3.22、5.36和6.9 (Prevost and Wilkinson, 1999; Satya et al., 2015; Tiwar et al., 2016), 而糜子Rp值为0.88-3.15 (Rajput et al., 2014; 王瑞云等, 2017b; 薛延桃等, 2018; 王璐琳等, 2018).本研究结果(Rp平均值为2.00)处于上述范围.由此表明, 不同植物的Rp值存在差异, 可能与物种自身特性有关.本研究开发的80个EST-SSR分子标记可作为评估糜子遗传多样性和阐明其群体结构的有效工具. ...
MEGA5: molecular evolutionary genetics analysis using maximum likelihood, evolutionary distance, and maximum parsimony methods 1 2011
... 读取电泳条带并记录为基因型数据(0, 1), 在Excel中转换成不同软件相应格式.用PopGen1.32 (Yeh and Boyle, 1997)和PowerMarker 3.25 (Liu and Muse, 2005)软件计算遗传多样性衡量参数.用MEGA 5.0 (Tamura et al., 2011)和Structure 2.2 (Falush et al., 2003)构建聚类图.用NTSYSpc2.11 (Rohlf, 2002)进行主成分分析(principal component analysis, PCA).利用Genepop on the web在线软件(http://genepop.curtin.edu.au.html)对群体各标记位点的无效等位基因频率和哈迪-温伯格平衡(Hardy- Weinberg equilibrium)进行检验. ...
Study of arbitrarily amplified (RAPD and ISSR) and gene targeted (SCoT and CBDP) markers for genetic diversity and population structure in kalmegh [Andrographis paniculata(Burm. f.) Nees] 1 2016
... Rp值与微卫星标记信息直接关联, 能反映标记有效等位基因的分辨力, 是遗传差异评估的有效指标(Prevost and Wilkinson, 1999; Azevedo et al., 2012).以往研究显示, 苎麻(Boehmeria nivea)、穿心莲(Andrographis paniculata)和马铃薯(Solanum tuberosum) Rp值分别为3.22、5.36和6.9 (Prevost and Wilkinson, 1999; Satya et al., 2015; Tiwar et al., 2016), 而糜子Rp值为0.88-3.15 (Rajput et al., 2014; 王瑞云等, 2017b; 薛延桃等, 2018; 王璐琳等, 2018).本研究结果(Rp平均值为2.00)处于上述范围.由此表明, 不同植物的Rp值存在差异, 可能与物种自身特性有关.本研究开发的80个EST-SSR分子标记可作为评估糜子遗传多样性和阐明其群体结构的有效工具. ...
Population structure and genetic diversity in a commercial maize breeding program assessed with SSR and SNP markers 1 2010
 ,2,3,*, 乔治军
 新窗口打开|下载原图ZIP|生成PPT
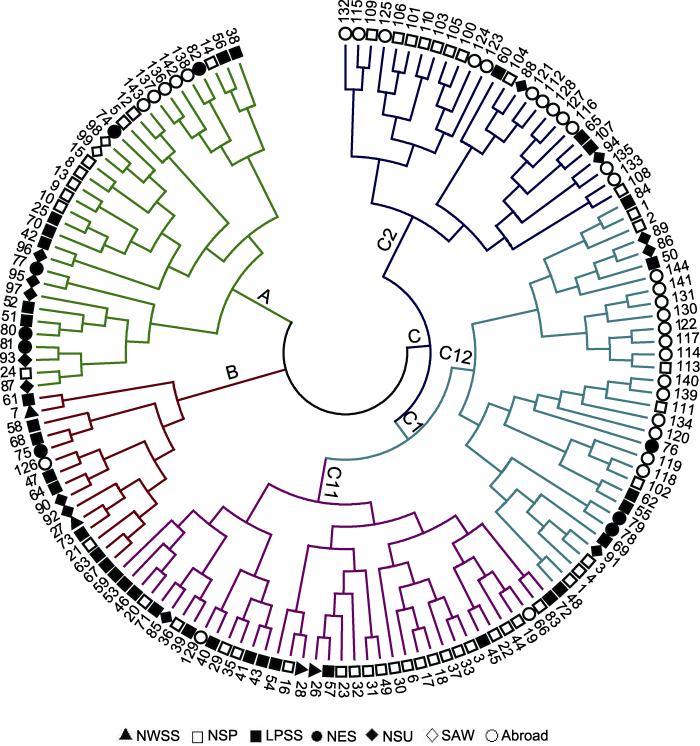 新窗口打开|下载原图ZIP|生成PPT
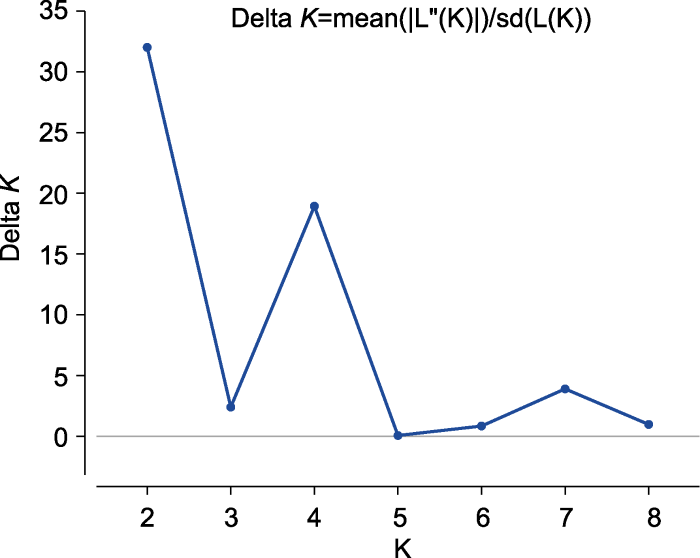 新窗口打开|下载原图ZIP|生成PPT
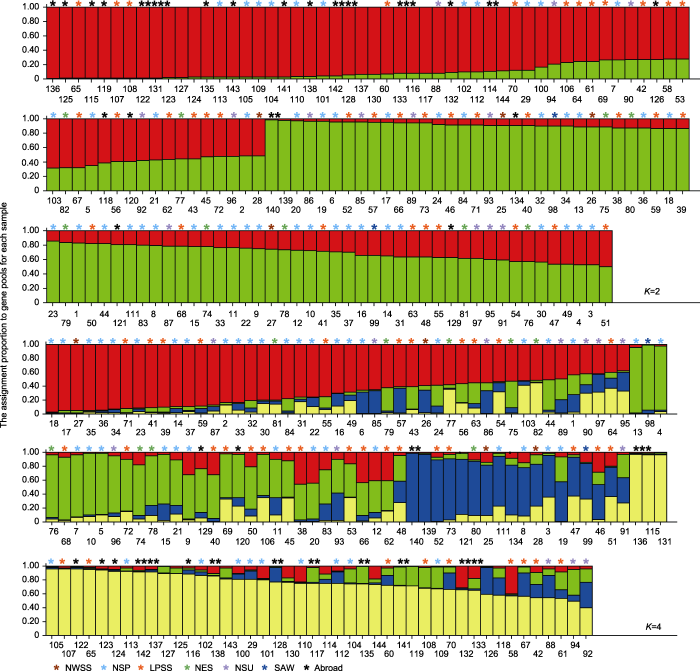 新窗口打开|下载原图ZIP|生成PPT
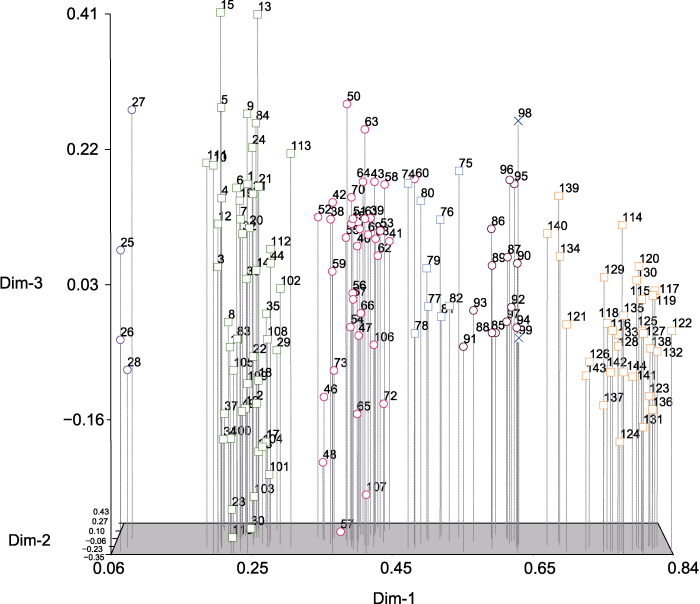 新窗口打开|下载原图ZIP|生成PPT