
华南农业大学林学与风景园林学院, 广东省森林植物种质创新与利用重点实验室, 广州 510642
引用本文
贡献者
基金资助
接受日期:2018-01-3网络出版日期:2018-11-1
-->Copyright
2018《植物学报》编辑部
Contributors
History
Received:Online:
摘要:
Abstract:
Key words:
实时荧光定量PCR (real time quantitative PCR, RT-qPCR)因具有重复性好、灵敏度高、定量准确以及反应速度快等优点, 已成为RNA靶标检测和定量的标准, 是确定基因表达水平的最常用方法(Gibson et al.,1996; Bustin, 2000; Ginzinger, 2002; Die et al., 2016)。利用RT-qPCR分析基因的相对表达量时, 通常需要引入1个表达较为稳定的管家基因(house- keeping gene)作为内参基因(reference gene), 以消除不同组织细胞间初始模板量、RNA质量及酶促反应效率等的偏差(Vandesompele et al., 2002; 吴文凯等, 2009; Martins et al., 2017)。传统上, 包括18S核糖体RNA (18S RNA)、甘油醛-3-磷酸脱氢酶(GAPDH)、延伸因子(EF)、泛素结合酶(UBCE)、α微管蛋白(Tub-α)和B微管蛋白(Tub-B)的管家基因, 它们被广泛用作RT-qPCR数据标准化的内源对照, 但是在所有实验条件下均稳定表达的参考基因不可能存在(Thellin et al., 1999; Vandesompele et al., 2002; Zhou et al., 2006)。因此, 为了得到更可靠的实验结果, 研究过程中需要选择较为合适的1个或多个内参基因进行校正(孙美莲等, 2010; 姜琼等, 2015)。
黄梁木(Neolamarckia cadamba), 又名团花树, 隶属茜草科(Rubiaceae)团花属, 常绿大乔木, 广泛分布于南亚和华南地区(Li et al., 2017)。由于黄梁木生长十分迅速, 在1972年的第7届世界林业大会上, 被各国专家誉为“奇迹树”。该树种材质好, 是胶合板和面板的理想原料, 亦可作为纤维板和制浆造纸原料(邓小梅等, 2011)。此外, 黄梁木中含有丰富的次生代谢产物, 如酚类化合物、黄酮类化合物和生物碱(Chandel et al., 2016; Pandey and Negi, 2018), 具有治疗眼睛感染、皮肤疾病、消化不良、牙龈出血、口腔炎、咳嗽、发烧、贫血和胃痛等一系列药理功能(Pandey and Negi, 2016)。由于黄梁木重要的经济价值和社会价值, 对其开展的分子生物学研究越来越多(Ho et al., 2014; Ouyang et al., 2014; Zhao et al., 2014; Li et al., 2017)。但目前关于黄梁木内参基因的选择却未见报道, 这将严重影响基于定量PCR分析基因表达的准确性。本研究以黄梁木不同组织(根、芽、叶、花、果、皮及形成层)为材料, 利用RT-qPCR技术对肌动蛋白(ACT)、网格蛋白连接复合物介质(CAC)、亲环素(CYP)、延伸因子1α (EF1α)、真核起始因子(eIF)、焦磷酸法尼酯合成酶1 (FPS1)、F-盒基重复蛋白(FBK)、甘油醛-3-磷酸脱氢酶(GAPDH)、GTP结合核蛋白(RAN)、磷酸烯醇式丙酮酸羧化酶相关激酶1 (PEPKR1)、蛋白磷酸酶2A (PP2A)、核糖体蛋白L (RPL)、核糖体蛋白S (RPS)、核酮糖-1,5-二磷酸羧化酶(RuBP)、S-腺苷甲硫氨酸脱羧酶(SAMDC)、翻译延伸因子(TEF)、α微管蛋白(Tub-α)、B微管蛋白(Tub-B)、泛素结合酶(UBCE)、泛素(UBQ)和泛素蛋白连接酶(UPL) 21个家族43个候选内参基因的表达量进行分析, 并利用geNorm、NormFinder和Best- Keeper软件进行内参基因稳定性分析, 旨在找出适合黄梁木不同组织中稳定表达的内参基因, 为后续黄梁木中重要基因的表达分析提供可靠内参。
1 材料与方法1.1 材料本研究以黄梁木(Neolamarckia cadamba (Roxb.) Bosser)的根、芽、叶、花、果、皮及形成层为材料。每个样品设3次生物学重复。样品采集后放入液氮速冻, 置于-80°C冰箱储存备用。
1.2 总RNA的提取结合十六烷基三甲基溴化铵(CTAB)和植物RNA试剂盒(Omega, Cat No.R6827-01)来提取黄梁木总RNA (Ouyang et al., 2014)。操作步骤如下: 取适量材料于液氮中研磨成粉末, 然后转移到不含RNA酶的1.5 mL离心管中, 加入600 μL预热的CTAB和10 μL B-巯基乙醇, 60°C水浴10分钟, 中间进行颠倒混匀。将等体积的氯仿/异戊醇(24:1, v:v)加入匀浆中, 然后震荡使其完全混合。4°C 16 260 ×g离心10分钟, 将上清液转移到新管中, 重复上述步骤。将上清液与等体积试剂盒中的RB缓冲液混匀; 加入等体积的无水乙醇, 其余步骤按试剂盒说明书操作。最后用40 μL的DEPC水洗脱RNA, -80°C保存备用。
1.3 cDNA合成和普通PCR扩增根据PrimeScript TM RT Master Mix试剂盒(Takara, Cat No.RR047A)说明书, 将总RNA (0.5 μg)反转录为第1链cDNA。将单链cDNA稀释15倍进行常规PCR扩增, 用2%琼脂糖凝胶电泳检测扩增产物。常规PCR总体积25 μL的反应体系如下: 12.5 μL 2×Es Taq Master Mix, 1 μL引物F (5 μmol?L-1), 1 μL引物R (5 μmol?L-1), 2 μL cDNA, 8.5 μL ddH2O。反应程序如下: 94°C3分钟; 94°C30秒, 58°C30秒, 72°C15秒, 35个循环; 72°C10分钟。10°C保存。
1.4 内参基因的荧光定量PCR分析RT-qPCR在罗氏(Roche) LC480定量PCR仪上进行。每个样品3次技术重复, 并取平均值计算分析, 以ddH2O代替模板作为实验的空白对照。荧光定量PCR总体积20 μL的反应体系如下: 10 μL 2×SYBR Premix Ex Taq II, 1 μL引物F (5 μmol?L-1), 1 μL引物R (5 μmol?L-1), 2 μL cDNA, 6 μL ddH2O。反应程序如下: 95°C30秒; 95°C5秒, 56°C30秒, 72°C30秒, 40个循环; 72°C2分钟。进行56-95°C的熔解曲线分析。40°C冷却30秒。
1.5 数据处理和分析利用软件geNorm (Vandesompele et al., 2002)、NormFinder (Andersen et al., 2004)和BestKeeper (Pfaffl et al., 2004)综合分析候选内参基因在不同实验条件下的表达稳定性。以3次生物学重复的平均CT (Cycle Threshold)值作为每个基因在各样品中的表达水平, 在此基础上进行3种软件分析前的数据转换。对于某个基因, 先找到该基因在所有样品中最小的CT值(表达量最高), 表达水平设为1; 再用其它样品的CT值减去最低CT值, 从而得到ΔCT值, 则该基因在该样品的表达水平即为2-ΔCT。用经此换算后的数据进行geNorm和NormFinder分析。通过geNorm和NormFinder程序计算出每个内参基因稳定性的M值,从而筛选出稳定性较好的内参基因。M值越小内参基因稳定性越好, 反之, 则稳定性越差。此外, geNorm还给出确定所需最适内参基因的数目。对经geNorm和NormFinder分析得到的稳定性好的前9个基因进行BestKeeper分析。
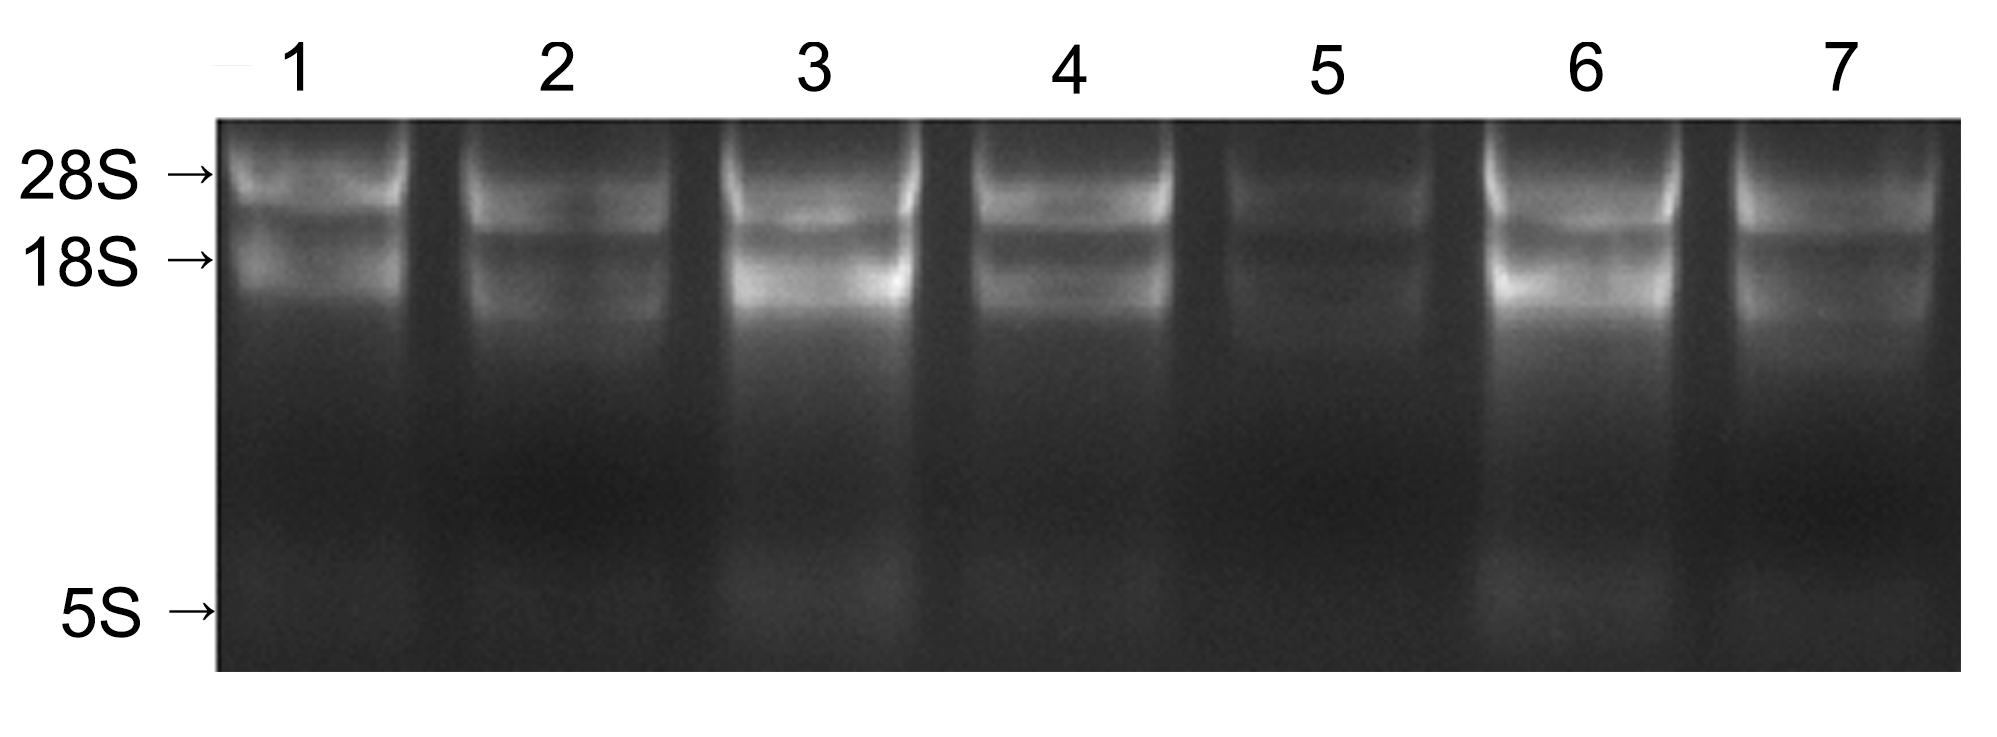
2 结果与讨论2.1 RNA样品质量检测将提取的各组织样品总RNA用1.5%琼脂糖凝胶电泳进行检测。结果(图1)显示, 28S和18S RNA条带无拖尾现象, 表明RNA样品没有降解。使用分光光度计(NanoDrop 1000, USA)检测的结果(表1)显示, 各样品A260/A280在1.8-2.2之间, A260/A230在1.84-2.22之间, 表明RNA的纯度高, 没有多酚和多糖的污染, 能满足后续实验的要求。
图 1
Figure 1
下载原图ZIP
生成PPT
图 1
黄梁木不同组织总RNA电泳检测
1: 皮; 2: 花; 3: 形成层; 4: 叶; 5: 根; 6: 芽; 7: 果
Figure 1
Electrophoresis of total RNA extracted from different tissues of Neolamarckia cadamba
1: Bark; 2: Flower; 3: Cambium; 4: Leaf; 5: Root; 6: Bud; 7: Fruit
表 1
Table 1
表 1
| Tissues | A260/A280 | A260/A230 | Yield (ng?μL-1) |
|---|---|---|---|
| Root | 2.19 | 2.1 | 107.5 |
| Bud | 2.12 | 2.14 | 410.6 |
| Leaf | 2.13 | 1.96 | 258.5 |
| Flower | 2.19 | 2.22 | 114.8 |
| Fruit | 2.11 | 1.84 | 156.8 |
| Bark | 2.17 | 1.89 | 299.7 |
| Cambium | 2.14 | 2.11 | 331.8 |
表 1
黄梁木不同组织总RNA的质量
Table 1
The quality of total RNA extracted from different tissues of Neolamarckia cadamba
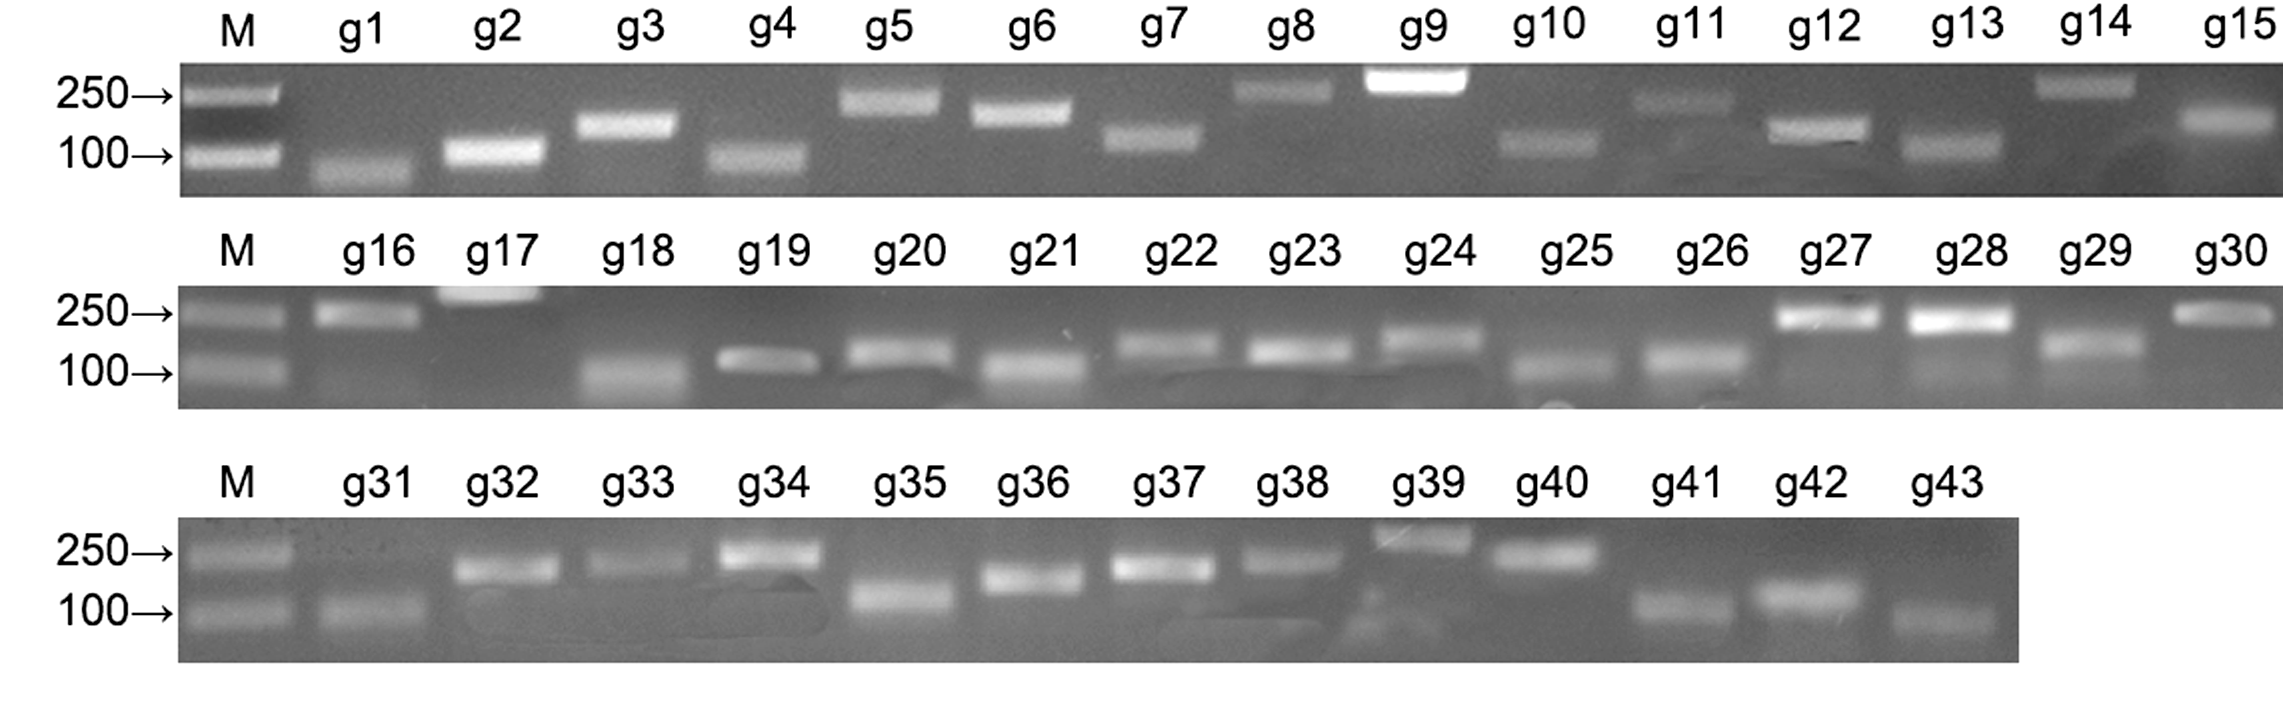
2.2 PCR引物设计、合成和检测将拟南芥管家基因序列与已有的黄梁木转录组数据(http://www.ncbi.nlm.nih.gov/bioproject/PRJNA232- 616) (Ouyang et al., 2016)以E值为10-5进行TBlastn比对, 查找管家基因, 并在NCBI数据库中通过BlastX进行核实。根据定量PCR引物设计原则, 利用Premier 5.0软件, 设计所有候选内参基因的定量PCR引物, 引物序列见表2, 由上海生工生物科技有限公司合成。以叶组织的cDNA为模板, 通过常规PCR扩增各内参基因片段, 经2%琼脂糖凝胶电泳检测(图2), 片段大小与目的基因一致, 并经测序确定序列正确。利用RT-qPCR进一步检测这些引物, 其溶解曲线只有1个信号峰(附图1), 说明RT-qPCR反应的特异性高, 结果可靠。
表 2
Table 2
表 2
| Name | UniGene ID | Reference gene (Rg) ID | F primer (5'-3') R primer (5'-3') | Amplicator length (bp) |
|---|---|---|---|---|
| Actin | comp52737_c0 | g1 | TGTAGTGGATGAATGCTTCTGTTAT | 95 |
| CTTCCTCCTACCAACTTCAAATG | ||||
| comp79635_c0 | g2 | CTTCTGAGGTTATGGAGCAATCT | 101 | |
| CGATAAATCAAAACTTCAAGCC | ||||
| Clathrin adaptor complexes medium | comp48976_c0 | g3 | CTCAGAGAACGCTGCTGACTAC | 161 |
| GAGCCAAGGGAAACAAGATAA | ||||
| Cyclophilin | comp67418_c0 | g4 | GGGGTCTCACGCTCTTTACT | 83 |
| GGATTGGATTGGGTTGGTT | ||||
| comp75463_c0 | g5 | CCCCAGCAAGAAGACCACT | 213 | |
| TTGACCATGAATCCCAACCA | ||||
| comp77969_c0 | g6 | ATAGCATCCCAACCGAACA | 187 | |
| CCCTCTTGCCTCCTGTGTAT | ||||
| Elongation factor 1α | comp87079_c1 | g7 | ACCAGCATCACCGTTCTTCA | 123 |
| GTCCTCGATTGCCACACCT | ||||
| comp87526_c0 | g8 | AATCAGACAGAAACCCCTCAA | 245 | |
| GAACCTCTCAATCACACGCTT | ||||
| Eukaryotic initiation factor | comp6386_c0 | g9 | GTTGAAACTTCTTGGACATCG | 250 |
| CTTGAGACACTGATTTGTATGAGA | ||||
| Farnesyl pyrophosphate synthase 1 | comp72548_c0 | g10 | TGATAATCTGGCTTCCACCTT | 112 |
| TGGGAGGAACTCAATCTCCTAC | ||||
| comp75377_c0 | g11 | TATCAGGCTCAGCATTCCACT | 212 | |
| TTGCCACAATAACACATCCAT | ||||
| F-boxkelch-repeat protein | comp78454_c0 | g12 | AAGGCCAATTCTGTTCAAGC | 143 |
| CCTAGAGGGAAAGACATGACTG | ||||
| comp78817_c0 | g13 | GCAAACGGGGTAAAAGGA | 102 | |
| AAAGGGTAAGAGTGACGACAGC | ||||
| GAPDH | comp78593_c0 | g14 | TGTTCCAAGTGGGCATTTAC | 247 |
| CGCTCTGAGGTGTTAATAAGTG | ||||
| comp80828_c1 | g15 | CTGAGCATTTTTTAGGCTTGTC | 151 | |
| TCAGATTCATGTGGCAGTCG | ||||
| GTP-binding nuclear protein | comp85262_c0 | g16 | TCTCGCAACCTGCCTCTT | 257 |
| TATCACTCCCATCTTCGCAC | ||||
| Phosphoenolpyruvate carboxylase-related kinase 1 | comp75525_c0 | g17 | CGACCTCACATTCCTCATTAC | 291 |
| ACATAGACCATCCAGAGCCCA | ||||
| comp80613_c0 | g18 | TACATAGACCATCCAGAGCCA | 112 | |
| GCAAAAGGGCAAGCAACAG | ||||
| Protein phosphatase 2A | comp81334_c1 | g19 | GGGCTTTCCATCCCATACC | 128 |
| AGCCTTAGGGGGATTGGAA | ||||
| comp52412_c0 | g20 | ATGTTGGATGATATTAGTGGTGTG | 161 | |
| TCATAGGAAAATAGACCTCTGGTT | ||||
| Ribosomal protein L | comp46755_c0 | g21 | CTGAGGATTGTTAGCAGTTGAC | 119 |
| ACCAGAAAACAGACCACCTAAG | ||||
| comp52434_c0 | g22 | AAGGAAGGTAAAGCAGGGAA | 177 | |
| GCATGGGCAGGGATATAAAC | ||||
| comp87976_c0 | g23 | CACGCAGCATAGCCAAAC | 157 | |
| AGGCAGTTCTCTGATTCTTTTG | ||||
| Name | UniGene ID | Reference gene (Rg) ID | F primer (5'-3') R primer (5'-3') | Amplicator length (bp) |
| Ribosomal protein S | comp65909_c1 | g24 | GCTATGGTAGTCTCCCGAAAG | 182 |
| GGGGGAACAAGACTAAGGGT | ||||
| comp67276_c0 | g25 | TTTTGTTTCCCCTCTTTGC | 97 | |
| AACCTTGAACAACCTGTGTAGAA | ||||
| comp71526_c0 | g26 | CGGTTACACAAGGTTGAATGA | 117 | |
| AGAGGGTCTGGATTTGAGTGA | ||||
| Ribulose 1,5-bisphosphate carboxylase | comp47386_c0 | g27 | CAGCACCGTAATCCATAAAAC | 226 |
| CAAGCAGCCCAGCAAGTC | ||||
| comp88001_c0 | g28 | ACAGGATGGGTAGAAAGAGGC | 210 | |
| AGGATTGAGCCGAATACAACG | ||||
| S-adenosylmethionine decarboxylase | comp44802_c0 | g29 | TCTTCGTGGCACTTCTCTCC | 133 |
| ACAGGGTGTTGACTTGTTTCC | ||||
| comp71874_c0 | g30 | ATAAGGTCTCTTCTTGTTCGTGTAG | 178 | |
| GACTGAACAGCAACAGGAATAAT | ||||
| comp80075_c0 | g31 | GCTGCCTGTGGGTCTCCTA | 85 | |
| GTAAACCCCAATGCTACTCCT | ||||
| Translation elongation factor | comp65909_c1 | g32 | GCTATGGTAGTCTCCCGAAAG | 184 |
| CTGGGGGAACAAGACTAAGG | ||||
| comp70791_c0 | g33 | TCAACCAACCGTTCCTACC | 195 | |
| ACAACAGTCCTTTGCCACC | ||||
| Tubulin α | comp70323_c2 | g34 | GGTGGTGGAACTGGCTCTG | 217 |
| GGCAAATGTCATAGATGGCTT | ||||
| comp76448_c4 | g35 | AAGGAGGGAATGAGTGGAG | 107 | |
| ACTATGGCAAGAAGTCAAAGC | ||||
| Tubulin B | comp66056_c0 | g36 | GCAAGAAAGCCTTCCTCCTAA | 153 |
| TTCCCAACAATGTCAAATCAA | ||||
| comp79707_c1 | g37 | TTCAGGAGAGTCAGCGAGC | 187 | |
| CATCGTCTTCATATTCCCCTT | ||||
| Ubiquitin conjugating enzyme | comp79182_c1 | g38 | TCCTTGCTTGTGGCGTCA | 213 |
| CACGGGTGTCAAATCTGGC | ||||
| Ubiquitin | comp67366_c0 | g39 | GACGGGAGGACCTTAGCA | 298 |
| CTCGGAGACGGAGAACAA | ||||
| comp82561_c0 | g40 | GCATTTGTGTCTTGCCTCTTTAT | 186 | |
| GCGATGAGCAACATTCCTTTA | ||||
| comp68357_c0 | g41 | TTTTTCAGCAAAGAACAACCG | 135 | |
| TGAAGACCCTCACTGGAAAGA | ||||
| Ubiquitin-protein ligase | comp87122_c0 | g42 | GGTTGGTGGTAGAGTTGTGACTC | 182 |
| CGAGCACTACCACGACACG | ||||
| comp87211_c0 | g43 | GCCCCTCCGTTAAACTCG | 122 | |
| GCCATACTCCCACCGAAAT | ||||
表 2
候选内参基因的引物序列
Table 2
Primer sequences of the candidate reference genes
图 2
Figure 2
下载原图ZIP
生成PPT
图 2
黄梁木43个候选内参基因的常规PCR扩增产物
M: Marker; g1-g43同
Figure 2
PCR products of 43 candidate reference genes in Neolamarckia cadamba
M: Marker; g1-g43 see
2.3 候选内参基因的稳定性分析2.3.1 7个组织中43个内参基因CT值分析
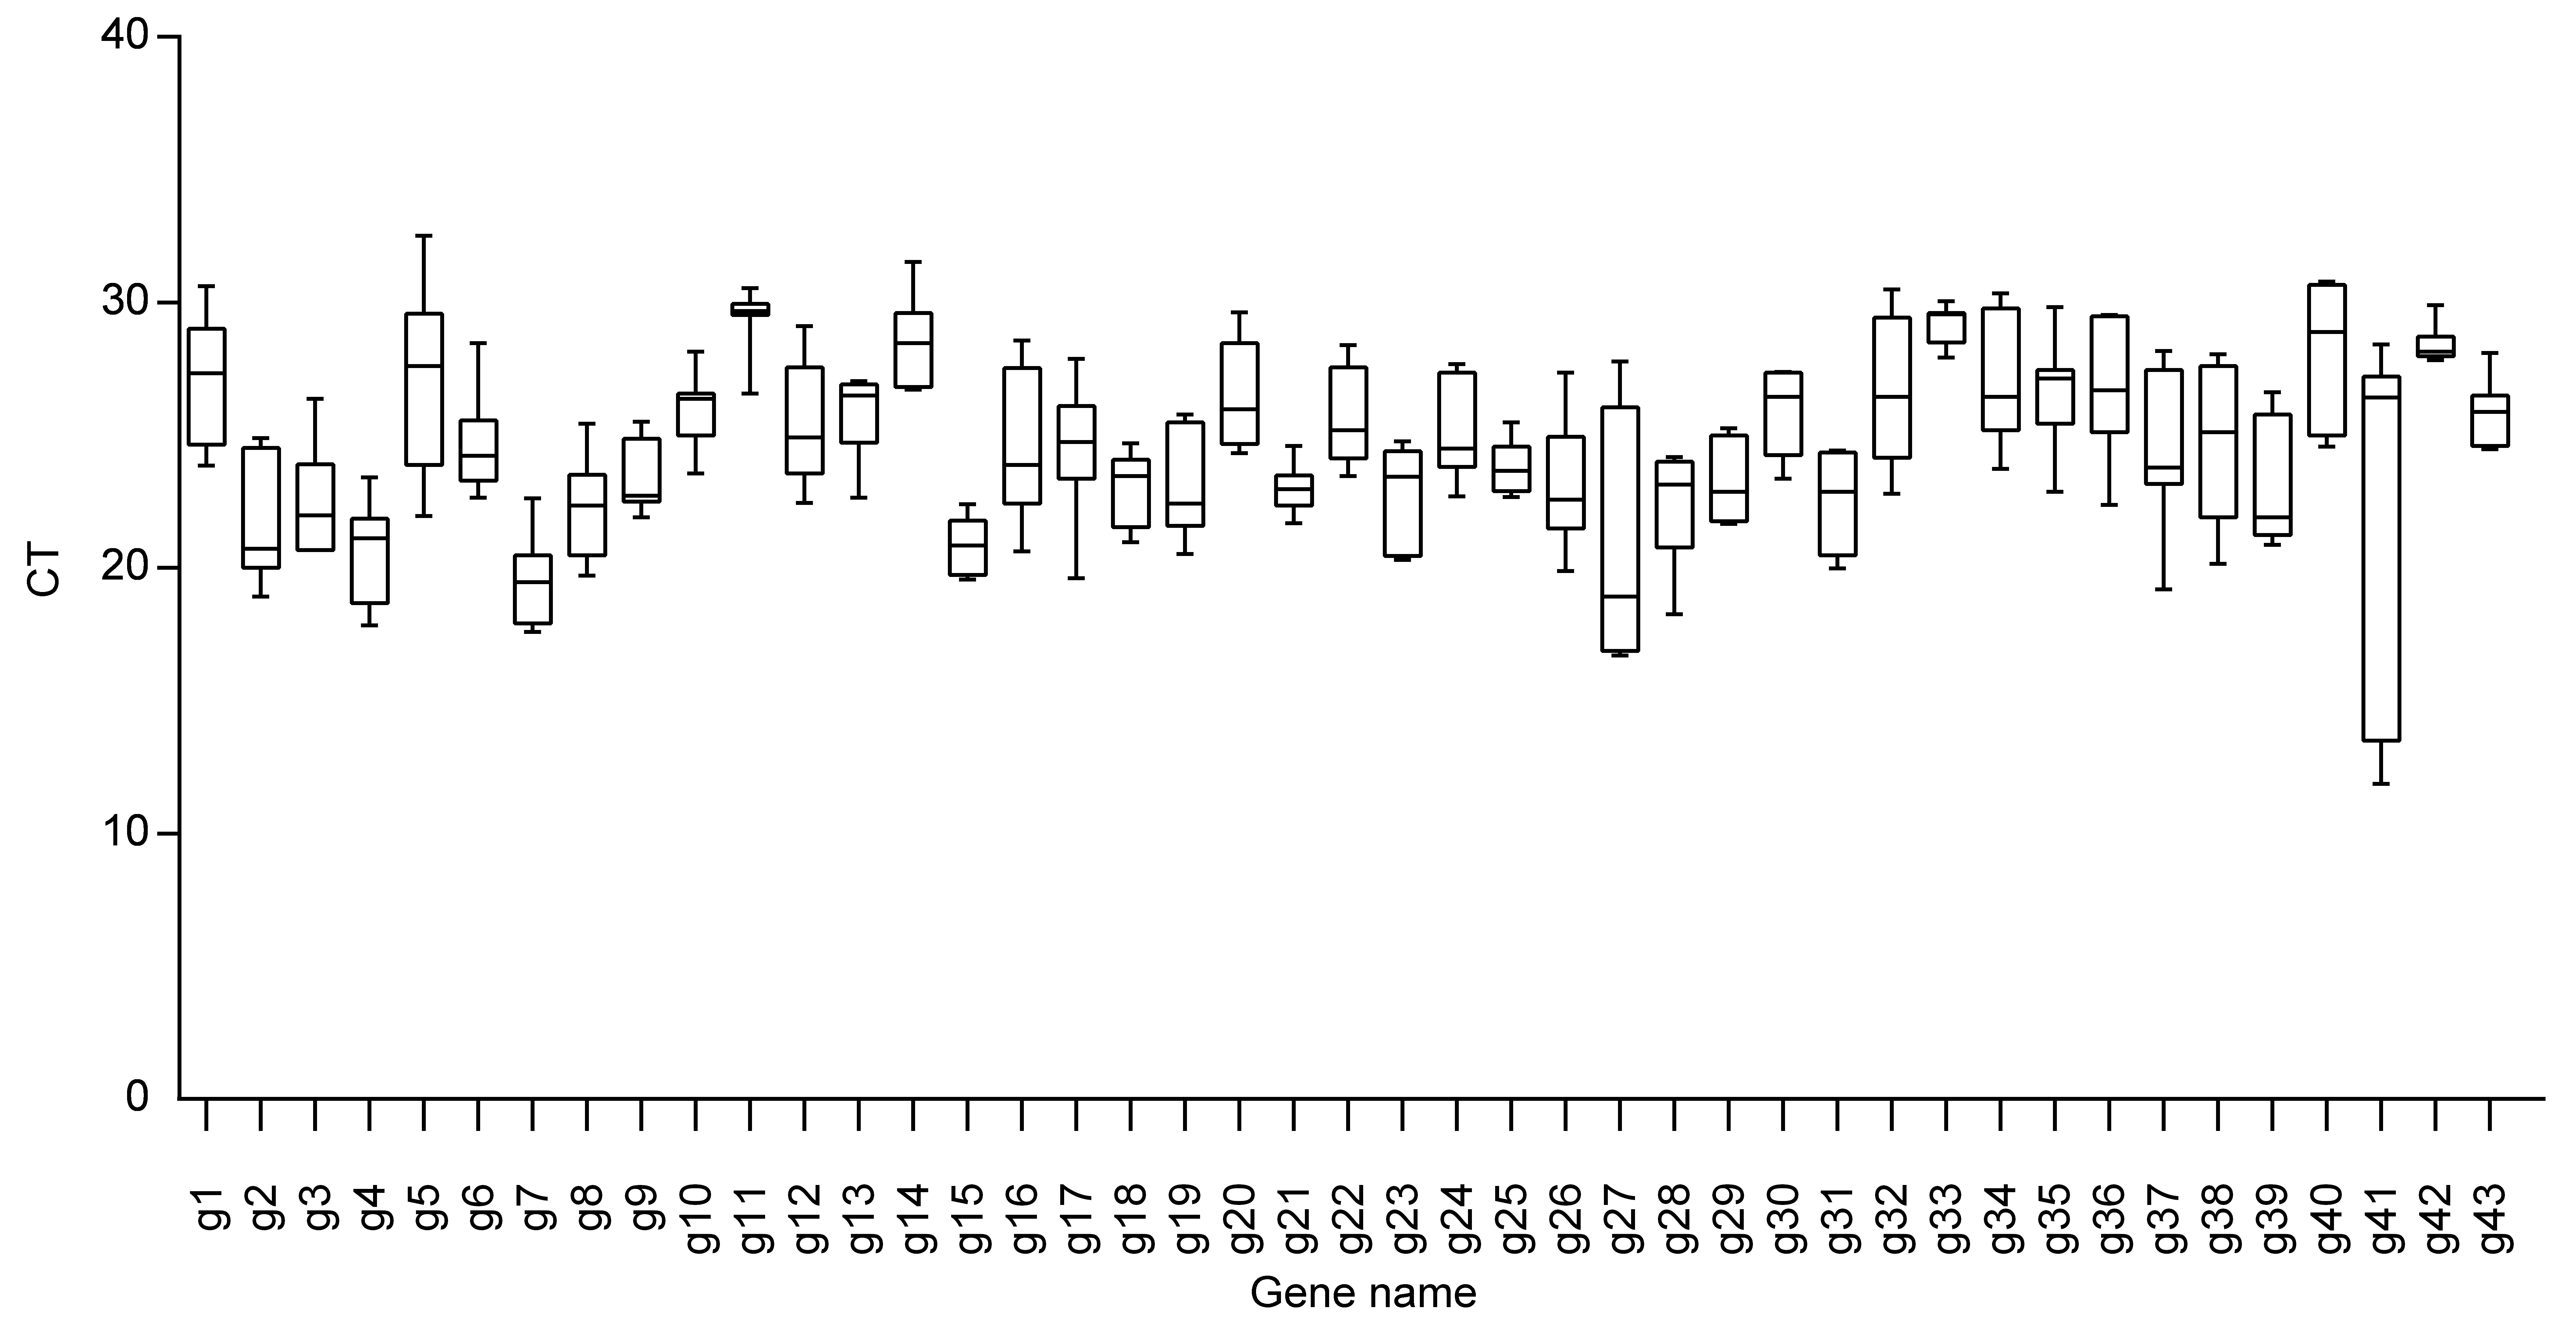
图3显示本研究中选取的43个候选内参基因在黄梁木7个不同组织中CT值的分布范围。内参基因的平均CT值为19.4-29.3。g7是该组中表达量最高的内参基因(平均CT=19.4), 而g11是表达量最低的内参基因(平均CT=29.36)。表现最稳定的是g42, 其CT值在27.84-29.90之间, 且CT值的分布集中。表现最不稳定的是g41, 其CT值在11.88-28.43之间, 且CT值分布最分散。而一些常用的稳定内参基因(如UBQ及GAPDH)在黄梁木中的表现并不稳定。
图 3
Figure 3
下载原图ZIP
生成PPT
图 3
候选内参基因在黄梁木7个组织中的CT值
g1-g43同
Figure 3
CT values of the candidate reference genes in 7 tissues of Neolamarckia cadamba
g1-g43 see
2.3.2 geNorm分析
利用geNorm软件对43个候选基因在黄梁木7个不同组织中的表达水平进行分析(表3)。由表3可知, 在43个候选内参基因中, g25和g42的M值(0.443)最低, 稳定性最高。在43个候选内参基因中, 共有16个候选内参基因的M值小于本软件的阈值1.5, 都可以考虑将其作为内参基因。
表 3
Table 3
表 3
| Rg ID | M | Rg ID | M | Rg ID | M | Rg ID | M | Rg ID | M |
|---|---|---|---|---|---|---|---|---|---|
| g25 | 0.443 | g23 | 1.142 | g36 | 1.649 | g6 | 2.045 | g40 | 2.365 |
| g42 | 0.443 | g31 | 1.183 | g34 | 1.693 | g4 | 2.080 | g17 | 2.412 |
| g21 | 0.471 | g24 | 1.229 | g28 | 1.737 | g2 | 2.113 | g16 | 2.458 |
| g33 | 0.565 | g13 | 1.287 | g7 | 1.789 | g32 | 2.148 | g38 | 2.503 |
| g15 | 0.704 | g22 | 1.348 | g12 | 1.836 | g39 | 2.184 | g5 | 2.566 |
| g43 | 0.862 | g14 | 1.404 | g10 | 1.881 | g19 | 2.217 | g27 | 2.652 |
| g29 | 0.966 | g26 | 1.467 | g11 | 1.927 | g37 | 2.251 | g41 | 2.859 |
| g18 | 1.014 | g9 | 1.533 | g30 | 1.967 | g1 | 2.285 | ||
| g8 | 1.090 | g35 | 1.597 | g3 | 2.007 | g20 | 2.321 |
表 3
用geNorm软件分析内参基因的稳定性
Table 3
Analysis of expression stability of reference genes by geNorm
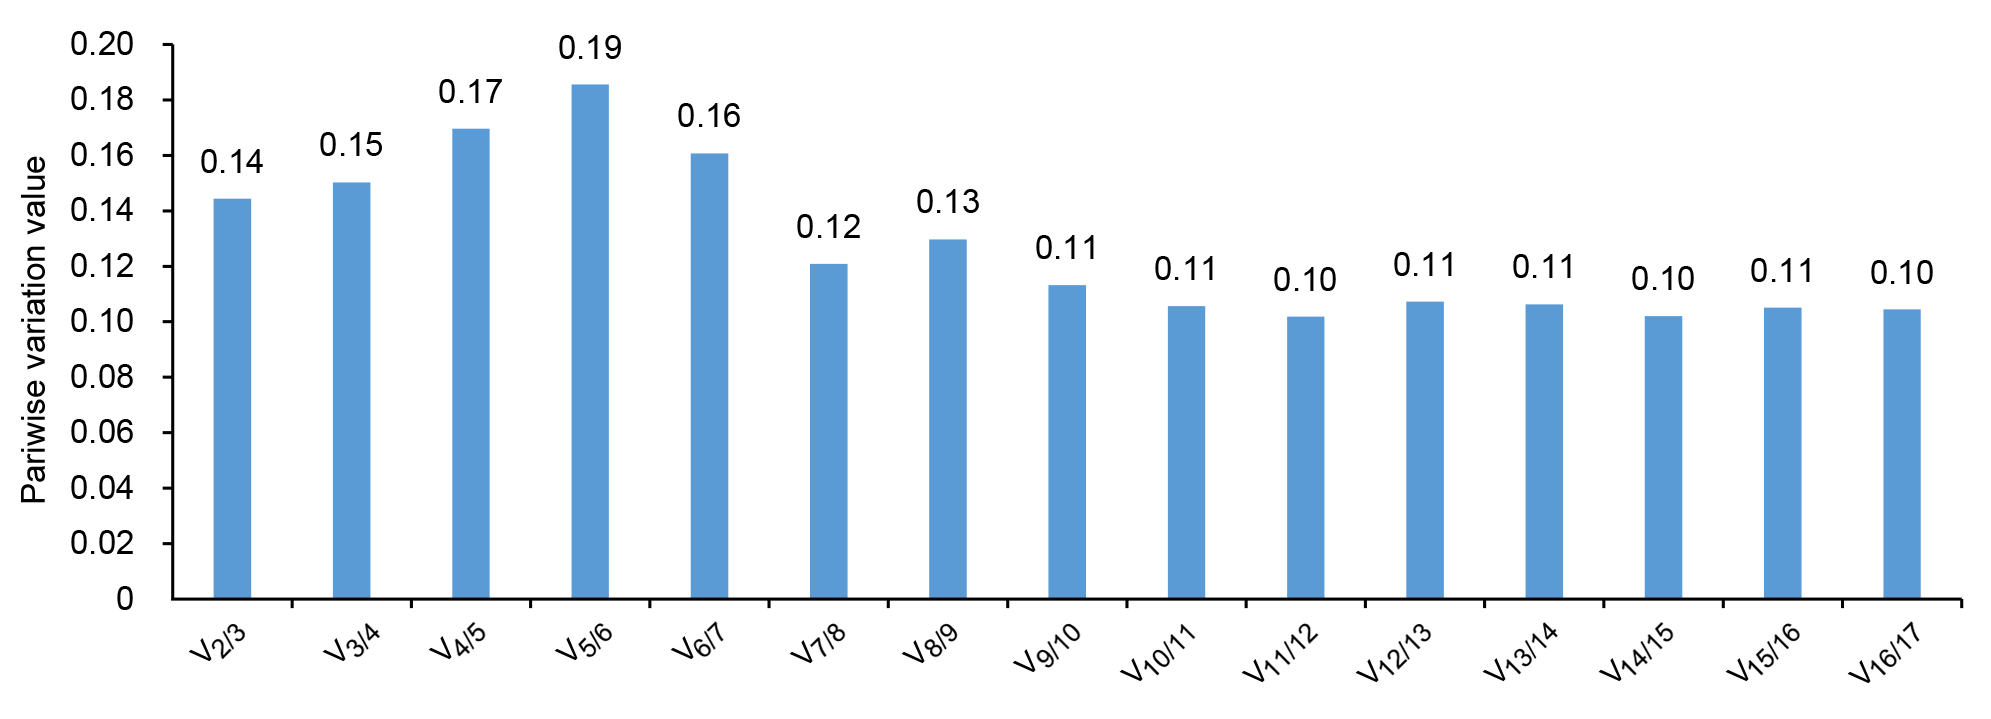
此外, geNorm还通过计算新的内参基因引入后标准化因子的配对变异值(Vn/n+1), 并根据此比值来确定内参基因的最佳数目。软件默认的Vn/n+1值为0.15, 如果比值小于0.15, 表明n个内参基因已经稳定, 能够满足相对定量的要求, 否则需引入第n+1个内参基因。根据表3中分析的表达稳定值, 考虑用作内参基因的16个候选基因(M<1.5)的配对差异值。如图4所示, V2/3的比值为0.14, 小于程序的阈值0.15, 说明在黄梁木的不同组织中, 2个内参基因组合的稳定性已能满足要求, 不必引入第3个内参基因进行校正。最稳定的2个内参基因分别是g25和g42。
图 4
Figure 4
下载原图ZIP
生成PPT
图 4
geNorm软件分析内参基因的最佳数目
Figure 4
Analysis of optional number of reference genes by geNorm
2.3.3 NormFinder分析
采用NormFinder软件对黄梁木不同组织中的43个候选内参基因进行分析(表4), 结果表明, 在不同组织中最稳定的基因是g42, 与geNorm分析结果一致。且在NormFinder分析结果中, 稳定性排在前10的基因与geNorm分析排在前10的基因有9个是一致的, 分别是g42、g15、g25、g43、g21、g33、g18、g8和g29。
表 4
Table 4
表 4
| Rg ID | Stability value | Rg ID | Stability value | Rg ID | Stability value | Rg ID | Stability value | Rg ID | Stability value |
|---|---|---|---|---|---|---|---|---|---|
| g42 | 0.223 | g8 | 0.787 | g28 | 1.249 | g6 | 1.441 | g40 | 1.937 |
| g15 | 0.298 | g23 | 0.871 | g35 | 1.264 | g4 | 1.460 | g17 | 2.023 |
| g25 | 0.343 | g31 | 0.951 | g10 | 1.316 | g19 | 1.496 | g38 | 2.062 |
| g43 | 0.505 | g9 | 1.007 | g12 | 1.354 | g2 | 1.518 | g16 | 2.099 |
| g21 | 0.517 | g13 | 1.021 | g36 | 1.371 | g39 | 1.545 | g5 | 2.350 |
| g33 | 0.554 | g22 | 1.108 | g3 | 1.372 | g32 | 1.574 | g27 | 2.750 |
| g18 | 0.567 | g14 | 1.136 | g34 | 1.384 | g1 | 1.657 | g41 | 4.759 |
| g29 | 0.590 | g7 | 1.141 | g11 | 1.397 | g37 | 1.709 | ||
| g24 | 0.724 | g26 | 1.160 | g30 | 1.411 | g20 | 1.733 |
表 4
NormFinder分析内参基因表达的稳定性
Table 4
Stability analysis of reference gene expression by NormFinder
2.3.4 BestKeeper分析
BestKeeper基于相关系数(r)、标准偏差(SD)和变异系数(CV)来评价内参基因的稳定性, 即相关系数越大、标准偏差和变异系数越小, 表明内参基因越稳定。由于BestKeeper同时最多只能分析10个基因的相互关系, 我们选取经geNorm和NormFinder两个软件分析得到稳定性都排在前10的9个基因(g42、g15、g25、g43、g21、g33、g18、g8和g29)进行稳定性分析。从BestKeeper软件分析结果(表5)可知, 这9个内参基因中, g42的标准偏差(SD=0.513)最小, 相关系数(r)和变异系数(CV)分别为0.851和1.804, 表明g42的表达稳定性最高。其次为g15和g25; g18、g8和g29这3个候选基因的标准偏差(SD)值均大于1, 不适合用作内参基因。
表 5
Table 5
表 5
| Parameter | Genes | ||||||||
|---|---|---|---|---|---|---|---|---|---|
| g42 | g15 | g25 | g43 | g21 | g33 | g18 | g8 | g29 | |
| SD±CP | 0.513 | 0.736 | 0.840 | 0.966 | 0.692 | 0.610 | 1.153 | 1.477 | 1.280 |
| CV (% CP) | 1.804 | 3.530 | 3.522 | 3.745 | 3.008 | 2.091 | 5.015 | 6.600 | 5.474 |
| coeff. of corr. (r) | 0.851 | 0.871 | 0.833 | 0.737 | 0.297 | 0.520 | 0.846 | 0.966 | 0.849 |
| p-value | 0.015 | 0.011 | 0.020 | 0.059 | 0.515 | 0.232 | 0.016 | 0.001 | 0.016 |
表 5
BestKeeper分析内参基因表达的稳定性
Table 5
Stability analysis of reference gene expression by BestKeeper
为了进一步评价候选内参基因的可靠性, 我们对这3个软件的分析结果进行排序, 选取经这3个软件分析均适宜用作内参基因的6个基因进行排序, 根据这6个基因在各软件中的排名分别打分(1-6), 将3个软件的分数相加作为总分, 然后再根据总分的大小排序。结果(表6)显示, 其排序的结果与geNorm软件的基本一致, 且这3个软件分析结果排第1的基因均为g42, 表明g42在黄梁木中最适合作为内参基因。
表 6
Table 6
表 6
| Genes | G | N | B | O |
|---|---|---|---|---|
| g42 | 1 | 1 | 1 | 1 |
| g25 | 1 | 3 | 5 | 2 |
| g21 | 3 | 5 | 3 | 3 |
| g33 | 4 | 6 | 2 | 4 |
| g15 | 5 | 2 | 4 | 3 |
| g43 | 6 | 4 | 6 | 5 |
表 6
3种分析软件的总分排序
Table 6
The rank of total score by 3 analysis softwares
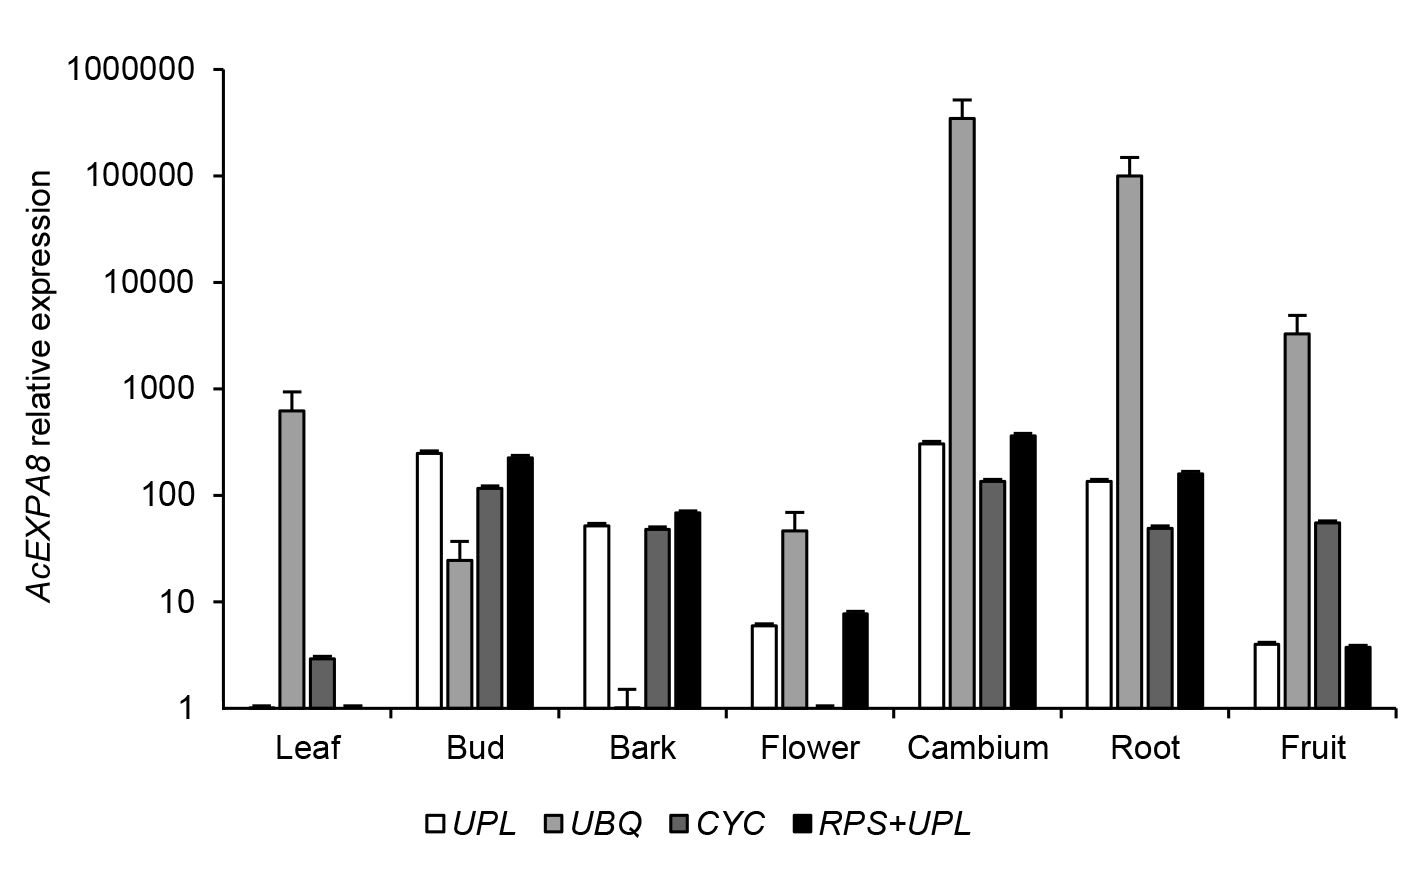
2.4 内参基因稳定性验证选用NcEXPA8基因来对筛选的稳定内参基因的准确性进行验证。本研究用geNorm筛选的内参基因(1个稳定表达的内参基因UPL, 2个稳定表达的内参基因组合RPS+UPL, 1个不稳定表达的内参基因UPQ)以及欧阳昆唏等(2013)在黄梁木中曾使用过的1个内参基因CYC (HQ832564)来定量NcEXPA8基因的表达(图5)。结果表明, NcEXPA8基因在形成层中的表达量最高。同时, 在使用1个或2个最稳定内参基因时, NcEXPA8基因在各组织间的表达趋势一致, 而使用CYC基因来定量时, 与最稳定内参基因定量结果存在较大差异(叶、花和果), 表明我们筛选的内参基因比之前在黄梁木中使用的内参基因稳定性好。在所有组织中, 当使用最不稳定的内参基因时, NcEXPA8基因的表达水平与使用最稳定内参基因时的定量结果都相差很大。
图 5
Figure 5
下载原图ZIP
生成PPT
图 5
用不同内参基因定量黄梁木NcEXPA8基因的表达谱
Figure 5
Screening the reference gene for quantification of the NcEXPA8 gene of Neolamarckia cadamba
2.5 讨论基因表达分析为理解生物学调控机制提供了重要手段, 但是质量数据的获取和再现, 以及数据确认和验证仍然具有挑战性(Liu and Slininger, 2007)。因此, 为了尽可能获得准确的数据, 在定量分析的每一个环节都需要注意, 尤其是在特定的实验条件下稳定表达的内参基因是定量分析获得准确结果的必要条件(Bustin et al., 2010)。在许多植物中, 传统上常把管家基因(如18S RNA、GAPDH和EF1α)用作RT-qPCR数据定量分析的内参基因, 但是在所有实验条件下都稳定表达的内参基因不可能存在。Chen等(2011)在对香蕉(Musa nana)进行的8个不同实验处理中分别筛选出不同的稳定内参基因。Jian等(2008)从大豆(Glycine max)的7个不同实验处理中筛选的各自稳定内参也不相同。因此要根据具体的实验要求选择表达相对稳定的内参基因。
此外, 理想的内参基因应具有高度或中度的表达水平, 应排除太高(CT<15)或低(CT>30)表达的内参基因(Jian et al., 2008)。在本研究中, 43个候选内参基因的CT平均值都在19.4-29.3范围内, 均可参与稳定内参基因的筛选。
从geNorm和NormFinder软件分析结果可以看出, 在黄梁木7种不同组织中, 用2种软件得出的分析
结果虽然在稳定性排名上存在差异, 但最稳定的同为UPL (g42), 且在稳定性各自排名前10位的候选内参基因中, 有9个一致; 用2个软件分析得出最不稳定的同为UBQ (g41)。已有研究表明, 利用geNorm和NormFinder软件分析得到的稳定性排名会存在较小差异(Chen et al., 2011; Galeano et al., 2014), 可能是由于2种不同软件的算法不同所致。在本研究中, 对利用geNorm和NormFinder软件分析获得的排名都靠前的9个内参基因进行BestKeeper软件分析, 最稳定的仍为UPL (g42)。因此, 此基因为3个软件一致认为的最稳定内参基因。为了进一步验证本研究中筛选的最佳内参基因(UPL)的准确性, 我们对目的基因NcEXPA8在7个不同组织中的表达量进行分析, 结果显示单个内参基因(UPL)与2个内参基因组合(RPS+UPL)的标准化结果相似, 且优于原有的内参基因(CYC), 但由最不稳定的内参基因(UPQ)得到的标准化数据明显不准确。因此, UPL基因可作为内参基因在黄梁木不同组织中开展基因表达的荧光定量分析。
附图1 候选内参基因PCR产物的溶解曲线Appendix figure 1 The PCR product melting curve of the candidate reference genes
http://www.chinbullbotany.com/fileup/PDF/t18003-1.pdf
参考文献
文献选项
原文顺序
文献年度倒序
文中引用次数倒序
被引期刊影响因子
| [1] | DOI:10.3969/j.issn.1673-923X.2011.11.018URL团花属茜草科团花属常绿阔叶乔木,是亚洲热带和南亚热带速生树种,在我国华南地区有着较大的开发和应用前景。综述了团花的生物学特性、生长特性、栽培技术、生物技术、化学成分等方面研究进展。针对我国团花产业发展存在的问题,对团花人工林发展和利用进行了讨论。 [本文引用: 1] |
| [2] | DOI:10.11983/CBB14173URL实时荧光定量PCR已广泛用于基因表达的分析,适当的内参基因选择是获得准确分析结果的关键。在大豆(Glycinemax)分子生物学研究中,逆境响应基因和microRNA(miRNA)表达的内参辅助检测基因均有哪些目前尚不清楚。该研究选用不同盐梯度和时间点组合处理的大豆根组织为材料,对已报道的其它条件下表达相对稳定的内参基因(ACT、ACT2/7、CYP2、ELF1A、ELF1B、F-Box、TUA和UBC2)以及miRNA内参基因(U6、miR1515a、miR1520c、miR1520d、miR171a和miR171b)的表达情况进行了全面检测;并采用?-Ct、Bestkeeper、NormFinder和Genorm四种方法对检测结果进行了综合分析,发现ELF1B和CYP2适合作为大豆根系盐胁迫响应基因研究的内参基因,miR1515a和U6适合作为盐胁迫下大豆根组织miRNA研究的内参。上述研究结果为大豆盐胁迫响应基因和miRNA表达及其进一步的功能研究奠定了基础。 [本文引用: 1] |
| [3] | |
| [4] | [本文引用: 1] |
| [5] | URL本文用GeNorm与NormFinder算法分析actin、α-tubulin、cblp和yptc1四个常用内参基因在不同处理下莱茵衣藻中的表达。结果显示,α-tubulin在各种条件下都有较好的表达稳定性,而以不同基因组合构成的多内参系统可能更有利于细胞周期短暂的单细胞绿藻的分析。 [本文引用: 1] |
| [6] | DOI:10.1158/0008-5472.CAN-04-0496PMID:15289330URLAccurate normalization is an absolute prerequisite for correct measurement of gene expression. For quantitative real-time reverse transcription-PCR (RT-PCR), the most commonly used normalization strategy involves standardization to a single constitutively expressed control gene. However, in recent years, it has become clear that no single gene is constitutively expressed in all cell types and under all experimental conditions, implying that the expression stability of the intended control gene has to be verified before each experiment. We outline a novel, innovative, and robust strategy to identify stably expressed genes among a set of candidate normalization genes. The strategy is rooted in a mathematical model of gene expression that enables estimation not only of the overall variation of the candidate normalization genes but also of the variation between sample subgroups of the sample set. Notably, the strategy provides a direct measure for the estimated expression variation, enabling the user to evaluate the systematic error introduced when using the gene. In a side-by-side comparison with a previously published strategy, our model-based approach performed in a more robust manner and showed less sensitivity toward coregulation of the candidate normalization genes. We used the model-based strategy to identify genes suited to normalize quantitative RT-PCR data from colon cancer and bladder cancer. These genes are , and for the colon and , and for the bladder. The presented strategy can be applied to evaluate the suitability of any normalization gene candidate in any kind of experimental design and should allow more reliable normalization of RT-PCR data. [本文引用: 1] |
| [7] | DOI:10.1677/jme.0.0250169URL [本文引用: 1] |
| [8] | DOI:10.1016/j.ymeth.2009.12.006PMID:20025972URLThe polymerase chain reaction (PCR) has matured from a labour- and time-intensive, low throughput qualitative gel-based technique to an easily automated, rapid, high throughput quantitative technology. Real-time quantitative PCR (qPCR) has become the benchmark technology for the detection and quantification of nucleic acids in a research, diagnostic, forensic and biotechnology setting. However, ill-assorted pre-assay conditions, poor assay design and inappropriate data analysis methodologies have resulted in the recurrent publication of data that are at best inconsistent and at worst irrelevant and even misleading. Furthermore, there is a lamentable lack of transparency of reporting, with the “Materials and Methods” sections of many publications, especially those with high impact factors, not fit for the purpose of evaluating the quality of any reported qPCR data. This poses a challenge to the integrity of the scientific literature, with serious consequences not just for basic research, but potentially calamitous implications for drug development and disease monitoring. These issues are being addressed by a set of guidelines that propose a minimum standard for the provision of information for qPCR experiments (“MIQE”). MIQE aims to restructure to-day’s free-for-all qPCR methods into a more consistent format that will encourage detailed auditing of experimental detail, data analysis and reporting principles. General implementation of these guidelines is an important requisite for the maturing of qPCR into a robust, accurate and reliable nucleic acid quantification technology. [本文引用: 1] |
| [9] | DOI:10.1016/j.bjp.2016.02.007URLIn search of lead molecules for use in disease prevention and as food additive from natural sources, two flavanols were isolated from leaves ofAnthocephalus cadamba(Roxb.) Miq., Rubiaceae. Their structures were established as 6-hydroxycoumarin-(4″→8)-(61)-epicatechin and 6-hydroxycoumarin-(4″→8)-(61)-epicatechin-(4→664)-(61)-epicatechin on the basis of spectroscopic data. Both the compounds exhibited potent antioxidant and antigenotoxic activity. 6-Hydroxycoumarin-(4″→8)-(61)-epicatechin scavenged DPPH, ABTS+.and superoxide anion radicals with IC50values of 6.09μg/ml, 5.95μg/ml and 42.70μg/ml respectively whereas the IC50values for 6-hydroxycoumarin-(4″→8)-(61)-epicatechin-(4→664)-(61)-epicatechin were 6.62μg/ml for DPPH free radicals, 6.93μg/ml for ABTS radical cations and 49.08μg/ml for superoxide anion radicals. Both the compounds also exhibited potent reducing potential in reducing power assay and protected the plasmid DNA (pBR322) against the attack of hydroxyl radicals generated by Fenton's reagent in DNA protection assay. In SOS chromotest, 6-hydroxycoumarin-(4″→8)-(61)-epicatechin decreased the induction factor induced by 4NQO (20μg/ml) and aflatoxin B1 (20μg/ml) by 31.78% and 65.04% respectively at a concentration of 1000μg/ml. On the other hand, 6-hydroxycoumarin-(4″→8)-(61)-epicatechin-(4→664)-(61)-epicatechin decreased the genotoxicity of these mutagens by 37.11% and 47.05% respectively. It also showed cytotoxicity in COLO-205 cancer cell line with GI50of 435.71μg/ml. Both the compounds showed moderate cyclooxygenase-2 inhibitory activity. [本文引用: 1] |
| [10] | DOI:10.1007/s00425-011-1410-3PMID:21505864URLReverse transcription quantitative real-time PCR (RT-qPCR) is a sensitive technique for quantifying gene expression, but its success depends on the stability of the reference gene(s) used for data normalization. Only a few studies on validation of reference genes have been conducted in fruit trees and none in banana yet. In the present work, 20 candidate reference genes were selected, and their expression stability in 144 banana samples were evaluated and analyzed using two algorithms, geNorm and NormFinder. The samples consisted of eight sample sets collected under different experimental conditions, including various tissues, developmental stages, postharvest ripening, stresses (chilling, high temperature, and pathogen), and hormone treatments. Our results showed that different suitable reference gene(s) or combination of reference genes for normalization should be selected depending on the experimental conditions. The RPS2 and UBQ2 genes were validated as the most suitable reference genes across all tested samples. More importantly, our data further showed that the widely used reference genes, ACT and GAPDH, were not the most suitable reference genes in many banana sample sets. In addition, the expression of MaEBF1, a gene of interest that plays an important role in regulating fruit ripening, under different experimental conditions was used to further confirm the validated reference genes. Taken together, our results provide guidelines for reference gene(s) selection under different experimental conditions and a foundation for more accurate and widespread use of RT-qPCR in banana. [本文引用: 1] |
| [11] | DOI:10.3389/fpls.2016.00271PMID:27014296URLThe qPCR assay has become a routine technology in plant biotechnology and agricultural research. It is unlikely to be technically improved, but there are still challenges which center around minimizing the variability in results and transparency when reporting technical data in support of the conclusions of a study. There are a number of aspects of the pre- and post-assay workflow that contribute to variability of results. Here, through the study of the introduction of error in qPCR measurements at different stages of the workflow, we describe the most important causes of technical variability in a case study using blueberry. In this study, we found that the stage for which increasing the number of replicates would be the most beneficial depends on the tissue used. For example, we would recommend the use of more RT replicates when working with leaf tissue, while the use of more sampling (RNA extraction) replicates would be recommended when working with stems or fruits to obtain the most optimal results. The use of more qPCR replicates provides the least benefit as it is the most reproducible step. By knowing the distribution of error over an entire experiment and the costs at each step, we have developed a script to identify the optimal sampling plan within the limits of a given budget. These findings should help plant scientists improve the design of qPCR experiments and refine their laboratory practices in order to conduct qPCR assays in a more reliable-manner to produce more consistent and reproducible data. [本文引用: 1] |
| [12] | DOI:10.1186/1756-0500-7-464PMID:25048176URLBackground Teak (Tectona grandis L.f.) is currently the preferred choice of the timber trade for fabrication of woody products due to its extraordinary qualities and is widely grown around the world. Gene expression studies are essential to explore wood formation of vascular plants, and quantitative real-time reverse transcription PCR (qRT-PCR) is a sensitive technique employed for quantifying gene expression levels. One or more appropriate reference genes are crucial to accurately compare mRNA transcripts through different tissues/organs and experimental conditions. Despite being the focus of some genetic studies, a lack of molecular information has hindered genetic exploration of teak. To date, qRT-PCR reference genes have not been identified and validated for teak. Results Identification and cloning of nine commonly used qRT-PCR reference genes from teak, including ribosomal protein 60s (rp60s), clathrin adaptor complexes medium subunit family (Cac), actin (Act), histone 3 (His3), sand family (Sand), ??-Tubulin (??-Tub), ubiquitin (Ubq), elongation factor 1-?? (Ef-1??), and glyceraldehyde-3-phosphate dehydrogenase (GAPDH). Expression profiles of these genes were evaluated by qRT-PCR in six tissue and organ samples (leaf, flower, seedling, root, stem and branch secondary xylem) of teak. Appropriate gene cloning and sequencing, primer specificity and amplification efficiency was verified for each gene. Their stability as reference genes was validated by NormFinder, BestKeeper, geNorm and Delta Ct programs. Results obtained from all programs showed that TgUbq and TgEf-1?? are the most stable genes to use as qRT-PCR reference genes and TgAct is the most unstable gene in teak. The relative expression of the teak cinnamyl alcohol dehydrogenase (TgCAD) gene in lignified tissues at different ages was assessed by qRT-PCR, using TgUbq and TgEf-1?? as internal controls. These analyses exposed a consistent expression pattern with both reference genes. Conclusion This study proposes a first broad collection of teak tissue and organ mRNA expression data for nine selected candidate qRT-PCR reference genes. NormFinder, Bestkeeper, geNorm and Delta Ct analyses suggested that TgUbq and TgEf-1?? have the highest expression stability and provided similar results when evaluating TgCAD gene expression, while the commonly used Act should be avoided. [本文引用: 1] |
| [13] | DOI:10.1101/gr.6.10.995URL [本文引用: 1] |
| [14] | DOI:10.1016/S0301-472X(02)00806-8URL [本文引用: 1] |
| [15] | DOI:10.1007/s12298-014-0230-xPMID:25049467URLThe large-scale genomic resource for kelampayan was generated from a developing xylem cDNA library. A total of 6,622 high quality expressed sequence tags (ESTs) were generated through high-throughput 5’ EST sequencing of cDNA clones. The ESTs were analyzed and assembled to generate 4,728 xylogenesis unigenes distributed in 2,100 contigs and 2,628 singletons. About 59.302% of the ESTs were assigned with putative identifications whereas 40.702% of the sequences showed no significant similarity to any sequences in GenBank . Interestingly, most genes involved in lignin biosynthesis and several other cell wall biosynthesis genes were identified in the kelampayan EST database. The identified genes in this study will be candidates for functional genomics and association genetic studies in kelampayan aiming at the production of high value forests. [本文引用: 1] |
| [16] | DOI:10.1186/1471-2199-9-59PMID:2443375URLBackground Normalizing to housekeeping gene (HKG) can make results from quantitative real-time PCR (qRT-PCR) more reliable. Recent studies have shown that no single HKG is universal for all experiments. Thus, a suitable HKG should be selected before its use. Only a few studies on HKGs have been done in plants, and none in soybean, an economically important crop. Therefore, the present study was conducted to identify suitable HKG(s) for normalization of gene expression in soybean. Results All ten HKGs displayed a wide range of Ct values in 21 sample pools, confirming that they were variably expressed. GeNorm was used to determine the expression stability of the HGKs in seven series sets. For all the sample pools analyzed, the stability rank was ELF1B, CYP2 > ACT11 > TUA > ELF1A > UBC2 > ACT2/7 > TUB > G6PD > UBQ10. For different tissues under the same developmental stage, the rank was ELF1B, CYP2 > ACT2/7 > UBC2 > TUA > ELF1A > ACT11 > TUB > G6PD > UBQ10. For the developmental stage series, the stability rank was ACT2/7, TUA > ELF1A > UBC2 > ELF1B > TUB > CYP2 > ACT11 > G6PD > UBQ10. For photoperiodic treatments, the rank was ACT11, ELF1B > CYP2 > TUA > ELF1A > UBC2 > ACT2/7 > TUB > G6PD > UBQ10. For different times of the day, the rank was ELF1A, TUA > ELF1B > G6PD > CYP2 > ACT11 > ACT2/7 > TUB > UBC2 > UBQ10. For different cultivars and leaves on different nodes of the main stem, the ten HKGs' stability did not differ significantly. ??Ct approach and 'Stability index' were also used to analyze the expression stability in all 21 sample pools. Results from ??Ct approach and geNorm indicated that ELF1B and CYP2 were the most stable HKGs, and UBQ10 and G6PD the most variable ones. Results from 'Stability index' analysis were different, with ACT11 and CYP2 being the most stable HKGs, and ELF1A and TUA the most variable ones. Conclusion Our data suggests that HKGs are expressed variably in soybean. Based on the results from geNorm and ??Ct analysis, ELF1B and CYP2 could be used as internal controls to normalize gene expression in soybean, while UBQ10 and G6PD should be avoided. To achieve accurate results, some conditions may require more than one HKG to be used for normalization. [本文引用: 1] |
| [17] | [本文引用: 2] |
| [18] | DOI:10.1016/j.mimet.2006.10.014PMID:17173990URLGene expression analysis provides significant insight to understand regulatory mechanisms of biology, yet acquisition and reproduction of quality data, as well as data confirmation and verification remain challenging due to a lack of proper quality controls across different assay platforms. We present a set of six universal external RNA quality controls for microbial mRNA expression analysis that can be applied to both DNA oligo microarray and real-time qRT-PCR including using SYBR Green and TaqMan probe-based chemistry. This set of controls was applied for Saccharomyces cerevisiae and Pseudomonas fluorescens Pf-5 microarray assays and qRT-PCR for yeast gene expression analysis. Highly fitted linear relationships between detected signal intensity and mRNA input were described. Valid mRNA detection range, from 10 to 7000 pg and from 100 fg to 1000 pg were defined for microarray and qRT-PCR assay, respectively. Quantitative estimation of mRNA abundance was tested using randomly selected yeast ORF including function unknown genes using the same source of samples by the two assay platforms. Estimates of mRNA abundance by the two methods were similar and highly correlated in an overlapping detection range from 10 to 1000 pg. The universal external RNA controls provide a means to compare microbial gene expression data derived from different experiments and different platforms for verification and confirmation. Such quality controls ensure reliability and reproducibility of gene expression data, and provide unbiased normalization reference for validation, quantification, and estimate of variation of gene expression experiments. Application of these controls also improves efficiency and facilitates high throughput applications of gene expression analysis using the qRT-PCR assay. [本文引用: 1] |
| [19] | DOI:10.3389/fpls.2017.00307PMID:5339599URLWorld coffee production has faced increasing challenges associated with ongoing climatic changes. Several studies, which have been almost exclusively based on temperature increase, have predicted extensive reductions (higher than half by 2,050) of actual coffee cropped areas. However, recent studies showed that elevated [CO2] can strongly mitigate the negative impacts of heat stress at the physiological and biochemical levels in coffee leaves. In addition, it has also been shown that coffee genotypes can successfully cope with temperatures above what has been traditionally accepted. Altogether, this information suggests that the real impact of climate changes on coffee growth and production could be significantly lower than previously estimated. Gene expression studies are an important tool to unravel crop acclimation ability, demanding the use of adequate reference genes. We have examined the transcript stability of 10 candidate reference genes to normalize RT-qPCR expression studies using a set of 24 cDNAs from leaves of three coffee genotypes (CL153, Icatu, and IPR108), grown under 380 or 700 L CO2L 1, and submitted to increasing temperatures from 25/20 C (day/night) to 42/34 C. Samples were analyzed according to genotype, [CO2], temperature, multiple stress interaction ([CO2], temperature) and total stress interaction (genotype, [CO2], and temperature). The transcript stability of each gene was assessed through a multiple analytical approach combining the Coeficient of Variation method and three algorithms (geNorm, BestKeeper, NormFinder). The transcript stability varied according to the type of stress for most genes, but the consensus ranking obtained with RefFinder, classifiedMDHas the gene with the highest mRNA stability to a global use, followed byACTandS15, whereas -TUBandCYCLshowed the least stable mRNA contents. Using the coffee expression profiles of the gene encoding the large-subunit of ribulose-1,5-bisphosphate carboxylase/oxygenase (RLS), results from thein silicoaggregation and experimental validation of the best number of reference genes showed that two reference genes are adequate to normalize RT-qPCR data. Altogether, this work highlights the importance of an adequate selection of reference genes for each single or combined experimental condition and constitutes the basis to accurately study molecular responses ofCoffeaspp. in a context of climate changes and global warming. [本文引用: 1] |
| [20] | [本文引用: 2] |
| [21] | DOI:10.1371/journal.pone.0159407PMID:27438485URLNeolamarckia cadambais a fast-growing tropical hardwood tree that is used extensively for plywood and pulp production, light furniture fabrication, building materials, and as a raw material for the preparation of certain indigenous medicines. Lack of genomic resources hampers progress in the molecular breeding and genetic improvement of this multipurpose tree species. In this study, transcriptome profiling of differentiating stems was performed to understandN.cadambaxylogenesis. TheN.cadambatranscriptome was sequenced using Illumina paired-end sequencing technology. This generated 42.49 G of raw data that was thende novoassembled into 55,432 UniGenes with a mean length of 803.2bp. Approximately 47.8% of the UniGenes (26,487) were annotated against publically available protein databases, among which 21,699 and 7,754 UniGenes were assigned to Gene Ontology categories (GO) and Clusters of Orthologous Groups (COG), respectively. 5,589 UniGenes could be mapped onto 116 pathways using the Kyoto Encyclopedia of Genes and Genomes (KEGG) pathway database. Among 6,202 UniGenes exhibiting differential expression during xylogenesis, 1,634 showed significantly higher levels of expression in the basal and middle stem segments compared to the apical stem segment. These genes includedNACandMYBtranscription factors related to secondary cell wall biosynthesis, genes related to most metabolic steps of lignin biosynthesis, andCesAgenes involved in cellulose biosynthesis. This study lays the foundation for further screening of key genes associated with xylogenesis inN.cadambaas well as enhancing our understanding of the mechanism of xylogenesis in fast-growing trees. [本文引用: 1] |
| [22] | DOI:10.1016/j.jep.2016.01.036PMID:26821190URL[Display omitted] [本文引用: 1] |
| [23] | [本文引用: 1] |
| [24] | DOI:10.1023/B:BILE.0000019559.84305.47URL [本文引用: 1] |
| [25] | DOI:10.1016/S0168-1656(99)00163-7URL [本文引用: 1] |
| [26] | [本文引用: 3] |
| [27] | DOI:10.3389/fpls.2014.00602PMID:25426124URLWood, derived from plant secondary growth, is a commercially important material. Both cellulose and lignin assembly have been well studied during wood formation (xylogenesis), but heteroxylan biosynthesis is less well defined. Elucidation of the heteroxylan biosynthetic pathway is crucial to understand the mechanism of wood formation. Here, we use N. cadamba, a fast-growing tropical tree, as a sample to analyze heteroxylan formation at the biochemical and molecular levels during wood formation. Analysis of the non-cellulosic polysaccharides isolated from N. cadamba stems shows that heteroxylans dominate non-cellulosic polysaccharides and increase with xylogenesis. Microsomes isolated from stems of 1-year-old N.cadamba exhibited UDP-Xyl synthase (UXS) and xylosyltransferase (XylT) activities with the highest activity present in the middle and basal stem regions. To further understand the genetic basis of heteroxylan synthesis, RNA-Seq was used to generate transcriptomes of N. cadamba during xylogenesis. The RNA-seq results showed that genes related to heteroxylan synthesis had higher expression levels in the middle and basal part of the stem compared to the apical part. Our results describe the heteroxylan distribution and heteroxylan synthesis trait in N. cadamba and give a new example for understanding the mechanism of heteroxylan synthesis in tropical tree species in future. [本文引用: 1] |
| [28] | DOI:10.1016/j.gene.2006.02.002PMID:16580793URLPrevious molecular studies on the termite Reticulitermes flavipes have revealed that two hexamerin proteins serve an important status quo role in the regulation of juvenile hormone (JH)-dependent caste differentiation. Here, we report sequence data and other experimental evidence suggesting how these two hexamerins function in achieving caste regulation. The two hexamerin genes, named Hex-1 and Hex-2, encode highly unique sequence features relative to the 100+ other known insect hexamerins. These features include a long hydrophobic tail and prenylation motif in Hex-1, and a long hydrophilic insertion plus several putative protease cleavage sites in Hex-2. Both hexamerin genes are primarily expressed in fat body tissue, but only Hex-2 expression is substantially induced by JH. SDS AGE showed that the hexamerin proteins constitute a major proportion of total soluble termite protein. Also, although each protein occurs in both the membrane and soluble protein fractions, Hex-2 has stronger membrane affinity. Anti-JH antiserum specifically recognizes hemolymph-soluble Hex-1 protein, supporting that the unique prenylation site in Hex-1 facilitates covalent JH binding to the primary amino acid chain. Finally, increased ratios of Hex-2 to Hex-1 transcription occur in caste phenotypes and developmental stages that differentiate in response to rising JH titers. Two main conclusions can be taken from these studies. First, elevated ratios of Hex-2 to Hex-1 expression are associated with caste phenotypes that differentiate in response to rising JH titers (i.e., workers, presoldiers and soldiers). Second, due to their unique structural features and other observed characteristics, our findings support the hypothesis that the two hexamerins participate in the regulation of caste-differentiation by modulating JH availability. [本文引用: 1] |
团花研究现状及发展思考
1
2011
... 黄梁木(Neolamarckia cadamba), 又名团花树, 隶属茜草科(Rubiaceae)团花属, 常绿大乔木, 广泛分布于南亚和华南地区(
盐胁迫下大豆根组织定量PCR分析中内参基因的选择
1
2015
... 实时荧光定量PCR (real time quantitative PCR, RT-qPCR)因具有重复性好、灵敏度高、定量准确以及反应速度快等优点, 已成为RNA靶标检测和定量的标准, 是确定基因表达水平的最常用方法(
团花树α-扩展蛋白基因的克隆及表达分析
2013
茶树实时荧光定量PCR分析中内参基因的选择
1
2010
... 实时荧光定量PCR (real time quantitative PCR, RT-qPCR)因具有重复性好、灵敏度高、定量准确以及反应速度快等优点, 已成为RNA靶标检测和定量的标准, 是确定基因表达水平的最常用方法(
用于莱茵衣藻荧光定量PCR分析的内参基因选择
1
2009
... 实时荧光定量PCR (real time quantitative PCR, RT-qPCR)因具有重复性好、灵敏度高、定量准确以及反应速度快等优点, 已成为RNA靶标检测和定量的标准, 是确定基因表达水平的最常用方法(
1
2004
... 利用软件geNorm (
1
2000
... 实时荧光定量PCR (real time quantitative PCR, RT-qPCR)因具有重复性好、灵敏度高、定量准确以及反应速度快等优点, 已成为RNA靶标检测和定量的标准, 是确定基因表达水平的最常用方法(
1
2010
... 基因表达分析为理解生物学调控机制提供了重要手段, 但是质量数据的获取和再现, 以及数据确认和验证仍然具有挑战性(
1
2016
... 黄梁木(Neolamarckia cadamba), 又名团花树, 隶属茜草科(Rubiaceae)团花属, 常绿大乔木, 广泛分布于南亚和华南地区(
1
2011
... 结果虽然在稳定性排名上存在差异, 但最稳定的同为UPL (g42), 且在稳定性各自排名前10位的候选内参基因中, 有9个一致; 用2个软件分析得出最不稳定的同为UBQ (g41).已有研究表明, 利用geNorm和NormFinder软件分析得到的稳定性排名会存在较小差异(
1
2016
... 实时荧光定量PCR (real time quantitative PCR, RT-qPCR)因具有重复性好、灵敏度高、定量准确以及反应速度快等优点, 已成为RNA靶标检测和定量的标准, 是确定基因表达水平的最常用方法(
1
2014
... 结果虽然在稳定性排名上存在差异, 但最稳定的同为UPL (g42), 且在稳定性各自排名前10位的候选内参基因中, 有9个一致; 用2个软件分析得出最不稳定的同为UBQ (g41).已有研究表明, 利用geNorm和NormFinder软件分析得到的稳定性排名会存在较小差异(
1
1996
... 实时荧光定量PCR (real time quantitative PCR, RT-qPCR)因具有重复性好、灵敏度高、定量准确以及反应速度快等优点, 已成为RNA靶标检测和定量的标准, 是确定基因表达水平的最常用方法(
1
2002
... 实时荧光定量PCR (real time quantitative PCR, RT-qPCR)因具有重复性好、灵敏度高、定量准确以及反应速度快等优点, 已成为RNA靶标检测和定量的标准, 是确定基因表达水平的最常用方法(
1
2014
... 黄梁木(Neolamarckia cadamba), 又名团花树, 隶属茜草科(Rubiaceae)团花属, 常绿大乔木, 广泛分布于南亚和华南地区(
1
2008
... 此外, 理想的内参基因应具有高度或中度的表达水平, 应排除太高(CT<15)或低(CT>30)表达的内参基因(
2
2017
... 黄梁木(Neolamarckia cadamba), 又名团花树, 隶属茜草科(Rubiaceae)团花属, 常绿大乔木, 广泛分布于南亚和华南地区(
... ;
1
2007
... 基因表达分析为理解生物学调控机制提供了重要手段, 但是质量数据的获取和再现, 以及数据确认和验证仍然具有挑战性(
1
2017
... 实时荧光定量PCR (real time quantitative PCR, RT-qPCR)因具有重复性好、灵敏度高、定量准确以及反应速度快等优点, 已成为RNA靶标检测和定量的标准, 是确定基因表达水平的最常用方法(
2
2014
... 黄梁木(Neolamarckia cadamba), 又名团花树, 隶属茜草科(Rubiaceae)团花属, 常绿大乔木, 广泛分布于南亚和华南地区(
... 结合十六烷基三甲基溴化铵(CTAB)和植物RNA试剂盒(Omega, Cat No.R6827-01)来提取黄梁木总RNA (
1
2016
... 将拟南芥管家基因序列与已有的黄梁木转录组数据(http://www.ncbi.nlm.nih.gov/bioproject/PRJNA232- 616) (
1
2016
... 黄梁木(Neolamarckia cadamba), 又名团花树, 隶属茜草科(Rubiaceae)团花属, 常绿大乔木, 广泛分布于南亚和华南地区(
1
2018
... 黄梁木(Neolamarckia cadamba), 又名团花树, 隶属茜草科(Rubiaceae)团花属, 常绿大乔木, 广泛分布于南亚和华南地区(
1
2004
... 利用软件geNorm (
1
1999
... 实时荧光定量PCR (real time quantitative PCR, RT-qPCR)因具有重复性好、灵敏度高、定量准确以及反应速度快等优点, 已成为RNA靶标检测和定量的标准, 是确定基因表达水平的最常用方法(
3
2002
... 实时荧光定量PCR (real time quantitative PCR, RT-qPCR)因具有重复性好、灵敏度高、定量准确以及反应速度快等优点, 已成为RNA靶标检测和定量的标准, 是确定基因表达水平的最常用方法(
... ;
... 利用软件geNorm (
1
2014
... 黄梁木(Neolamarckia cadamba), 又名团花树, 隶属茜草科(Rubiaceae)团花属, 常绿大乔木, 广泛分布于南亚和华南地区(
1
2006
... 实时荧光定量PCR (real time quantitative PCR, RT-qPCR)因具有重复性好、灵敏度高、定量准确以及反应速度快等优点, 已成为RNA靶标检测和定量的标准, 是确定基因表达水平的最常用方法(
