Effects of nitrogen addition on plant community composition and microbial biomass ecological stoichiometry in a desert steppe in China
Pan WANG1, Wan-Wan ZHU1, Yu-Bin NIU1, Jin FAN1, Hai-Long YU1, Jiang-Shan LAI2, Ju-Ying HUANG,,3,*1. College of Resources and Environment, Ningxia University, Yinchuan 750021, China 2. State Key Laboratory of Vegetation and Environmental Change, Institute of Botany, Chinese Academy of Sciences, Beijing 100093, China 3. Institute of Environmental Engineering, Ningxia University, Yinchuan 750021, China
Editorial board:HANWen-xuan Editor:LI Min, ZHAO Hang Received:2019-03-5Accepted:2019-04-23Online:2019-05-20
Fund supported:
Supported by the High School Scientific Research Foundation of Ningxia, China(NGY2017003) The National Natural Science Foundation of China(31760144) The Natural Science Foundation of Ningxia, China(NZ17015)
Abstract Aims Increasing atmospheric nitrogen (N) deposition accelerates soil N cycling, potentially resulting in decoupling of microbial biomass carbon (C):N:phosphorus (P), loss of plant species, and reductions of provision of ecosystem service. Studies on how the changes of elemental balance in microbes affect plant community composition, could provide a new insight for making clear the mechanism of N-induced loss of plant species. Methods We conducted a manipulative N addition experiment in a desert steppe in Ningxia, northwestern China to quantify the changes in plant biomass and species composition over two years. We analyzed the individual effects of microbial biomass C:N:P ecological stoichiometry and the joint effects with other key soil factors on plant community composition. Important findings The responses of plants to N addition appeared species-specific. The biomass of Salsola collina increased substantially; the biomass of Lespedeza potaninii decreased gradually. Other species showed slightly decreasing in biomass although statistically insignificant (p > 0.05). Along the N addition gradient, Shannon-Wiener diversity index, Simpson dominance index, and Patrick richness index of the plant community increased initially but decreased over time later. With increase in N addition level, the N content and N:P ratio of the microbial community increased, but the C:N ratio decreased. Plant community composition showed stronger correlations with microbial biomass N content, microbial biomass C:N ratio, microbial biomass N:P, soil NO3--N concentration, soil NH4+-N concentration, and the total P content of the soils. Microbial biomass C:N:P ecological stoichiometry explained <3% of the variation in aboveground plant biomass and community diversity index. Surprisingly, the joint influences from microbial biomass C:N:P ecological stoichiometry and other soil properties explained 51% of the variation in plant biomass and 26% of the change in plant community diversity. These results indicate that the effect of microbial biomass C:N:P ecological stoichiometry on plant community was highly related to the effects of other soil properties under N addition. Keywords:atmospheric nitrogen deposition;ecological stoichiometry;species diversity;degraded ecosystem
PDF (1327KB)元数据多维度评价相关文章导出EndNote|Ris|Bibtex收藏本文 引用本文 王攀, 朱湾湾, 牛玉斌, 樊瑾, 余海龙, 赖江山, 黄菊莹. 氮添加对荒漠草原植物群落组成与微生物生物量生态化学计量特征的影响. 植物生态学报, 2019, 43(5): 427-436. DOI: 10.17521/cjpe.2019.0046 WANG Pan, ZHU Wan-Wan, NIU Yu-Bin, FAN Jin, YU Hai-Long, LAI Jiang-Shan, HUANG Ju-Ying. Effects of nitrogen addition on plant community composition and microbial biomass ecological stoichiometry in a desert steppe in China. Chinese Journal of Plant Ecology, 2019, 43(5): 427-436. DOI: 10.17521/cjpe.2019.0046
大气氮(N)沉降是指由地面排放源排放至大气中的含N化合物, 在大气中经过混合、转化、扩散和漂移并降落汇至地表的过程(Goulding, 1990)。21世纪初, 人为活性氮(Nr)排放量已经达到自然界排放的2倍(85 Tg·a-1), 且其中的78%又以N沉降的形式降落至地面(Fowler et al., 2013)。据估计, 全球N沉降量到2050年可能会增至195 Tg·a-1 (Galloway et al., 2004)。在我国, N沉降速率已从20世纪80年代的13.2 kg·hm-2·a-1增加至21世纪的21.1 kg·hm-2·a-1 (Liu et al., 2013); 20世纪90年代至21世纪10年代期间全国NO3-湿沉降量提高了74.1% (Yu et al., 2017); 2008-2012年我国平均N沉降速率约为16.4 kg·hm-2·a-1, 其中62%为NHx, 38%为NOy (Zhao et al., 2017b)。区域N沉降时空格局模拟结果表明, 21世纪初宁夏大部分地区N沉降速率达到20 kg·hm-2·a-1以上, 低于南方大部分地区平均值但高于西北地区平均水平(顾峰雪等, 2016)。N作为大量营养元素之一, 对植物的生长发育至关重要。同时, N限制广泛存在于陆地生态系统中(LeBauer & Treseder, 2008)。因此, 短期或少量N沉降在一定程度上可缓解植物生长所受的N限制, 对植物地上部分的生长具有促进作用(Bai et al., 2010; 王晶等, 2016); 但长期或高量N沉降不但会引起N富集, 而且可能造成植被-土壤系统元素计量关系失衡, 生物多样性降低和生态系统服务功能降低等问题(Li et al., 2016)。
重要值(Pi) = (相对生物量+相对高度+相对频度)/3 H = $-\underset{i=1}{\overset{S}{\mathop \sum }}\,{{P}_{i}}\text{ln}{{P}_{i}}$ D = $1-\underset{i=1}{\overset{S}{\mathop \sum }}\,P_{i}^{2}$ R = S E = H/lnS 式中, S为群落中物种数, Pi为种i的重要值。
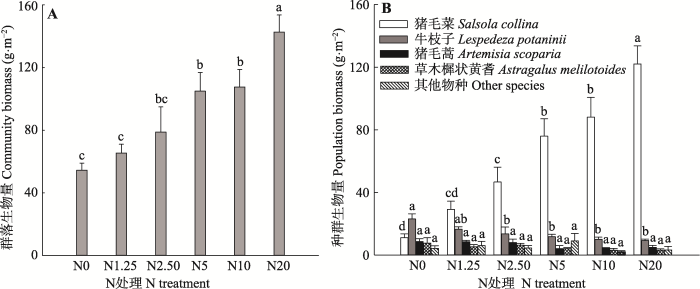
新窗口打开|下载原图ZIP|生成PPT 图1N处理对植物群落(A)和种群生物量(B)的影响(平均值+标准误差, n = 5)。N0、N1.25、N2.50、N5、N10和N20分别代表0、1.25、2.50、5、10和20 g·m-2·a-1的N施用量。不同小写字母表示N处理间指标差异显著(p < 0.05)。
Fig. 1Effects of N addition on biomass of plant community (A) and individual species (B) (mean + SE, n = 5). N0, N1.25, N2.50, N5, N10, and N20 represent N addition level of 0, 1.25, 2.50, 5, 10, and 20 g·m-2·a-1, respectively. Different lowercase letters indicate significant differences among N treatments (p < 0.05).
新窗口打开|下载原图ZIP|生成PPT 图2N处理对植物群落多样性指数的影响(平均值+标准误差, n = 5)。N0、N1.25、N2.50、N5、N10和N20分别代表0、1.25、2.50、5、10和20 g·m-2·a-1的N施用量。不同小写字母表示N处理间指标差异显著(p < 0.05)。
Fig. 2Effects of N treatments on plant community diversity (mean + SE, n = 5). N0, N1.25, N2.50, N5, N10, and N20 represent N addition level of 0, 1.25, 2.50, 5, 10, and 20 g·m-2·a-1, respectively. Different lowercase letters indicate significant differences among N treatments (p < 0.05).
新窗口打开|下载原图ZIP|生成PPT 图3N处理对微生物生物量C、N、P及其生态化学计量比的影响(平均值+标准误差, n = 5)。N0、N1.25、N2.50、N5、N10和N20分别代表0、1.25、2.50、5、10和20 g·m-2·a-1的N施用量。不同小写字母表示N处理间指标差异显著(p < 0.05)。
Fig. 3Effects of N treatments on microbial biomass C, N, P, and their stoichiometric ratios (mean + SE, n = 5). N0, N1.25, N2.50, N5, N10, and N20 represent N addition level at 0, 1.25, 2.50, 5, 10, and 20 g·m-2·a-1, respectively. Different lowercase letters indicate significant differences among N treatments (p < 0.05).
Fig. 4RDA of plant biomass (A) and community diversity (B) explained by soil factors. Sc, Am, As, and Lp represent Salsola collina, Astragalus melilotoides, Artemisia scoparia, and Lespedeza potaninii, respectively. H and D represent Shannon-Wiener diversity index and Simpson dominance index, respectively. MBC, MBN, MBP, C:Nm, C:Pm, and N:Pm represent microbial biomass C content, N content, P content, C:N, C:P, and N:P, respectively. TOC, TN, TP, C:Ns, C:Ps, N:Ps, NH4+-N, NO3--N, and AP represent soil organic C content, total N content, total P content, C:N, C:P, N:P, NH4+-N concentration, NO3--N concentration, and available P concentration, respectively.
Fig. 5Variation partitioning of plant population biomass (A) and community diversity index (B) by soil factor groups. Values < 0 not shown. Data in one circle represent the variation individually explained by the soil factor group, data in the overlapped part of circles represent the variation jointly explained by soil factor groups. X1 group includes microbial biomass C content, N content, P content, C:N, C:P, and N:P; X2 group includes soil organic C content, total N content, total P content, C:N, C:P, N:P; X3 group includes soil NH4+-N, NO3--N, and available P concentrations, respectively.
BaiYF, WuJG, ClarkCM, NaeemS, PanQM, HuangJH, ZhangLX, HanXG (2010). Tradeoffs and thresholds in the effects of nitrogen addition on biodiversity and ecosystem functioning: Evidence from Inner Mongolia grasslands Global Change Biology, 16, 358-372. [本文引用: 1]
CaoCY, ShaoJF, JiangDM, CuiZ (2011). Effects of fence enclosure on soil nutrients and biological activities in highly degraded grasslands Journal of Northeastern University (Natural Science), 32, 427-430, 451. [本文引用: 1]
ClevelandCC, LiptzinD (2007). C:N:P stoichiometry in soil: Is there a “Redfield ratio” for the microbial biomass? Biogeochemistry, 85, 235-252. [本文引用: 4]
DuanL, HaoJM, XieSD, ZhouZP (2002). Estimating critical loads of sulfur and nitrogen for Chinese soils by steady state method Journal of Environmental Science, 23(2), 7-12. [本文引用: 1]
FangY, XunF, BaiWM, ZhangWH, LiLH (2012). Long-term nitrogen addition leads to loss of species richness due to litter accumulation and soil acidification in a temperate steppe PLOS ONE, 7, e47369. DOI: 10.1371/journal.pone.?0047369. [本文引用: 1]
FowlerD, CoyleM, SkibaU, SuttonMA, CapeJN, ReisS, SheppardLJ, JenkinsA, GrizzettiB, GallowayJN, VitousekP, LeachA, BouwmanAF, Butterbach-BahlK, DentenerR, StevensonD, AmannM, VossM (2013). The global nitrogen cycle in the twenty-first century Philosophical Transactions of the Royal Society B-Biological Sciences, 368, 20130164. DOI: 10.1098/rstb.2013.0164. [本文引用: 1]
HeYT, QiYC, DongYS, PengQ, XiaoSS, LiuXC (2010). Advances in the influence of external nitrogen input on soil microbiological characteristics of grass land ecosystem Advances in Earth Science, 25, 877-885. [本文引用: 1]
HessenDO, ElserJJ (2010). Elements of ecology and evolution Oikos, 109, 3-5. [本文引用: 1]
HeuckC, WeigA, SpohnM (2015). Soil microbial biomass C:N:P stoichiometry and microbial use of organic phosphorus Soil Biology & Biochemistry, 85, 119-129. [本文引用: 1]
HuangJY, YuHL (2016). Responses of growth of four desert species to different N addition levels Chinese Journal of Plant Ecology, 40, 165-176. [本文引用: 1]
HuangJY, YuHL, LiuJL, MaF, HanL (2018). Effects of precipitation levels on the C:N:P stoichiometry in plants, microbes, and soils in a desert steppe in China Acta Ecologica Sinica, 38, 5362-5373. [本文引用: 1]
JiangJ, SongMH (2010). Review of the roles of plants and soil microorganisms in regulating ecosystem nutrient cycling Chinese Journal of Plant Ecology, 34, 979-988. [本文引用: 2]
LanZC, JeneretteGD, ZhanSX, LiWH, ZhengSX, BaiYF (2015). Testing the scaling effects and mechanisms of N-induced biodiversity loss: Evidence from a decade-long grassland experiment Journal of Ecology, 103, 750-760. [本文引用: 1]
LeBauerDS, TresederKK (2008). Nitrogen limitation of net primary productivity in terrestrial ecosystems is globally distributed Ecology, 89, 371-379. [本文引用: 1]
LeffJW, JonesSE, ProberSM, BarberánA, BorerET, FirnJL, FiererN (2015). Consistent responses of soil microbial communities to elevated nutrient inputs in grasslands across the globe Proceedings of the National Academy of Sciences of the United States of America, 112, 10967-10972. [本文引用: 1]
LiH, YangS, XuZW, YanQY, LiXB, van NostrandJD, HeZL, YaoF, HanXG, ZhouJZ, DengY, JiangY (2017). Responses of soil microbial functional genes to global changes are indirectly influenced by aboveground plant biomass variation Soil Biology & Biochemistry, 104, 18-29. [本文引用: 1]
LiY, NiuSL, YuGR (2016). Aggravated phosphorus limitation on biomass production under increasing nitrogen loading: A meta-analysis Global Change Biology, 22, 934-942. [本文引用: 2]
LuQQ, BaiJH, ZhangGL, ZhaoQQ, WuJJ (2018). Spatial and seasonal distribution of carbon, nitrogen, phosphorus, and sulfur and their ecological stoichiometry in wetland soils along a water and salt gradient in the Yellow River Delta, China Physics and Chemistry of the Earth, 104, 9-17. [本文引用: 1]
MakinoW, CotnerJB, SternerRW, ElserJJ (2003). Are bacteria more like plants or animals? Growth rate and resource dependence of bacterial C:N:P stoichiometry Functional Ecology, 17, 121-130. [本文引用: 1]
MaoQG, LuXK, ChenH, MoJM (2015). Responses of terrestrial plant diversity to elevated mineral element inputs Acta Ecologica Sinica,35, 5884-5897. [本文引用: 1]
MayorJR, MackMC, SchuurEAG (2015). Decoupled stoichiometric, isotopic, and fungal responses of an ectomycorrhizal black spruce forest to nitrogen and phosphorus additions Soil Biology & Biochemistry, 88, 247-256. [本文引用: 1]
SongMH, YuFH, OuyangH, CaoGM, XuXL, CornelissenJHC (2012). Different inter-annual responses to availability and form of nitrogen explain species coexistence in an alpine meadow community after release from grazing Global Change Biology, 18, 3100-3111. [本文引用: 1]
SoongJL, Maranon-JimenezS, CotrufoMF, BoeckxP, BodeS, GuenetB, Pe?uelasJ, RichterA, StahlC, VerbruggenE, JanssensIA (2018). Soil microbial CNP and respiration responses to organic matter and nutrient additions: Evidence from a tropical soil incubation Soil Biology & Biochemistry, 122, 141-149. [本文引用: 1]
SternerRW, ElserJJ (2002). Ecological Stoichiometry: The Biology of Elements From Molecules to the Biosphere. Princeton University Press, Princeton. [本文引用: 1]
SuXL, LiYB, YangB, LiQ (2018). Effects of plant diversity on soil microbial community in a subtropical forest Chinese Journal of Ecology, 37, 2254-2261. [本文引用: 1]
TangZS, DengL, AnH, YanWM, ShangguanZP (2017). The effect of nitrogen addition on community structure and productivity in grasslands: A meta-analysis Ecological Engineering, 99, 31-38. [本文引用: 1]
TianQY, LiuNN, BaiWM, LiLH, ChenJQ, ReichPB, YuQ, GuoDL, SmithMD, KnappAK, ChengWX, LuP, GaoY, YangA, WangTZ, LiX, WangZW, MaYB, HanXG, ZhangWH (2016). A novel soil manganese mechanism drives plant species loss with increased nitrogen deposition in a temperate steppe Ecology, 97, 65-74. [本文引用: 1]
van der HeijdenMGA, BardgettRD, van StraalenNM (2008). The unseen majority: Soil microbes as drivers of plant diversity and productivity in terrestrial ecosystems Ecology Letters, 11, 296-310. [本文引用: 2]
WangCJ, WangQQ, XuH, GaoHJ, ZhuP, XuMG, ZhangWJ (2018). Carbon, nitrogen, and phosphorus stoichiometry characteristics of bulk soil, organic matter, and soil microbial biomass under long-term fertilization in cropland Acta Ecologica Sinica, 38, 3848-3858. [本文引用: 1]
WangJ, WangSS, QiaoXG, LiA, XueJG, HasiM, ZhangXY, HuangJH (2016). Influence of nitrogen addition on the primary production in Nei Mongol degraded grassland Chinese Journal of Plant Ecology, 40, 980-990. [本文引用: 2]
XueYF, ZongN, HeNP, TianJ, ZhangYQ (2018). Influence of long-term enclosure and free grazing on soil microbial community structure and carbon metabolic diversity of alpine meadow Chinese Journal of Applied Ecology, 29, 2705-2712. [本文引用: 1]
YangQ, WangW, ZengH (2018). Effects of nitrogen addition on the plant diversity and biomass of degraded grasslands of Nei Mongol, China Chinese Journal of Plant Ecology, 42, 430-441. [本文引用: 1]
YuHL, HeNP, WangQF, ZhuJX, GaoY, ZhangYH, JiaYL, YuGR (2017). Development of atmospheric acid deposition in China from the 1990s to the 2010s Environmental Pollution, 231, 182-190. [本文引用: 2]
YueK, FornaraDA, YangW, PengY, LiZ, WuFZ, PengCH (2017). Effects of three global change drivers on terrestrial C:N:P stoichiometry: A global synthesis Global Change Biology, 23, 2450-2463. [本文引用: 2]
Zechmeister-BoltensternS, KeiblingerKM, MooshammerM, Pe?uelasJ, RichterA, SardansJ, WanekW (2015). The application of ecological stoichiometry to plant-microbial- soil organic matter transformations Ecological Monographs, 85, 133-155. [本文引用: 2]
ZhanSX, WangY, ZhuZC, LiWH, BaiYF (2017). Nitrogen enrichment alters plant N:P stoichiometry and intensifies phosphorus limitation in a steppe ecosystem Environmental and Experimental Botany, 134, 21-32. [本文引用: 1]
ZhangJJ, XuDM (2013). Niche characteristics of dominant plant populations in desert steppe of Ningxia with different enclosure times Acta Agrestia Sinica, 21(1), 73-78. Magsci [本文引用: 1] 以宁夏荒漠草原为研究对象,采用空间梯度代替时间梯度的方法,对不同封育年限及未封育草地的植被进行调查,并运用生态位宽度和生态位重叠指数对不同恢复演替阶段优势种群的生态位特征进行计测。结果表明:草地封育后,植物种群的生态位宽度发生变化,未封育草地以一年生植物刺蓬(Salsola pestifer)的生态位宽度最大,短花针茅(Stipa breviliora)和牛枝子(Lespedeza potaninii)种群的生态位宽度均以封育7年的草地最高,分别为3.153和4.058,中亚白草(Pennisetum centrasiaticum)种群的生态位宽度在各封育年限草地及未封育草地中均较高,是该区域的泛化种。封育草地恢复演替过程中种群之间生态位重叠总体较高,大多物种间生态位重叠指数在0.4~0.8之间;其中,未封育草地的种群重叠指数较低,封育5年的草地种群重叠指数最高。不同封育年限草地中生态位宽度最大的物种不一定和其他的物种有最大的重叠值,植物群落较高的生态位重叠和种群生态位宽度之间不存在线性关系。 [ 张晶晶, 许冬梅 (2013). 宁夏荒漠草原不同封育年限优势种群的生态位特征 草地学报, 21(1), 73-78.] Magsci [本文引用: 1] 以宁夏荒漠草原为研究对象,采用空间梯度代替时间梯度的方法,对不同封育年限及未封育草地的植被进行调查,并运用生态位宽度和生态位重叠指数对不同恢复演替阶段优势种群的生态位特征进行计测。结果表明:草地封育后,植物种群的生态位宽度发生变化,未封育草地以一年生植物刺蓬(Salsola pestifer)的生态位宽度最大,短花针茅(Stipa breviliora)和牛枝子(Lespedeza potaninii)种群的生态位宽度均以封育7年的草地最高,分别为3.153和4.058,中亚白草(Pennisetum centrasiaticum)种群的生态位宽度在各封育年限草地及未封育草地中均较高,是该区域的泛化种。封育草地恢复演替过程中种群之间生态位重叠总体较高,大多物种间生态位重叠指数在0.4~0.8之间;其中,未封育草地的种群重叠指数较低,封育5年的草地种群重叠指数最高。不同封育年限草地中生态位宽度最大的物种不一定和其他的物种有最大的重叠值,植物群落较高的生态位重叠和种群生态位宽度之间不存在线性关系。
ZhangYH, LüXT, IsbellF, StevensC, HanX, HeNP, ZhangGM, YuQ, HuangJH, HanXG (2014). Rapid plant species loss at high rates and at low frequency of N addition in temperate steppe Global Change Biology, 20, 3520-3529. [本文引用: 1]
ZhaoH, SunJ, XuXL, QinXJ (2017a). Stoichiometry of soil microbial biomass carbon and microbial biomass nitrogen in China’s temperate and alpine grasslands European Journal of Soil Biology, 83, 1-8. [本文引用: 1]
ZhaoYH, ZhangL, ChenYF, LiuXJ, XuW, PanYP, DuanL (2017b). Atmospheric nitrogen deposition to China: A model analysis on nitrogen budget and critical load exceedance Atmospheric Environment, 153, 32-40. [本文引用: 1]
ZhouXB, ZhangYM, WangSS, ZhangBC (2010). Combined effects of simulated nitrogen deposition and drought stress on growth and photosynthetic physiological responses of two annual desert plants in Junggar Basin, China Chinese Journal of Plant Ecology, 34, 1394-1403. [本文引用: 1]
ZhouZH, WangCK (2016). Changes of the relationships between soil and microbes in carbon, nitrogen and phosphorus stoichiometry during ecosystem succession Chinese Journal of Plant Ecology, 40, 1257-1266. [本文引用: 1]
ZhouZH, WangCK, JinY (2017). Stoichiometric responses of soil microflora to nutrient additions for two temperate forest soils Biology and Fertility of Soils, 53, 397-406. [本文引用: 1]
Tradeoffs and thresholds in the effects of nitrogen addition on biodiversity and ecosystem functioning: Evidence from Inner Mongolia grasslands 1 2010
... 大气氮(N)沉降是指由地面排放源排放至大气中的含N化合物, 在大气中经过混合、转化、扩散和漂移并降落汇至地表的过程(Goulding, 1990).21世纪初, 人为活性氮(Nr)排放量已经达到自然界排放的2倍(85 Tg·a-1), 且其中的78%又以N沉降的形式降落至地面(Fowler et al., 2013).据估计, 全球N沉降量到2050年可能会增至195 Tg·a-1 (Galloway et al., 2004).在我国, N沉降速率已从20世纪80年代的13.2 kg·hm-2·a-1增加至21世纪的21.1 kg·hm-2·a-1 (Liu et al., 2013); 20世纪90年代至21世纪10年代期间全国NO3-湿沉降量提高了74.1% (Yu et al., 2017); 2008-2012年我国平均N沉降速率约为16.4 kg·hm-2·a-1, 其中62%为NHx, 38%为NOy (Zhao et al., 2017b).区域N沉降时空格局模拟结果表明, 21世纪初宁夏大部分地区N沉降速率达到20 kg·hm-2·a-1以上, 低于南方大部分地区平均值但高于西北地区平均水平(顾峰雪等, 2016).N作为大量营养元素之一, 对植物的生长发育至关重要.同时, N限制广泛存在于陆地生态系统中(LeBauer & Treseder, 2008).因此, 短期或少量N沉降在一定程度上可缓解植物生长所受的N限制, 对植物地上部分的生长具有促进作用(Bai et al., 2010; 王晶等, 2016); 但长期或高量N沉降不但会引起N富集, 而且可能造成植被-土壤系统元素计量关系失衡, 生物多样性降低和生态系统服务功能降低等问题(Li et al., 2016). ...
围栏封育对重度退化草地土壤养分和生物活性的影响 1 2011
... 微生物生物量C:N:P生态化学计量比决定了微生物活动的方向以及凋落物分解过程中养分释放与否, 因此影响着土壤C状况和养分有效性(Heuck et al., 2015).全球尺度上微生物生物量C:P变化幅度较大(平均值为59.5, 摩尔比), 但C:N (3-24)和N:P (1-55)变化幅度较小(Cleveland & Liptzin, 2007).本研究中, 转换后的微生物生物量C:N、C:P和N:P的变化范围分别为5.26-14.30、39.79-76.19和4.33-15.70, 处于全球数据的变化范围之内, 但是低于我国黄河三角洲湿地(Lu et al., 2018)以及高山草地的值(Zhao et al., 2017a).其原因一方面可能是N添加提高了土壤N有效性(附录I), 因此刺激了微生物生长发育.另一方面, 试验草地自1998年开始围封, 连续18年的禁牧促进了微生物活动以及N和P的积累(曹成有等, 2011; 薛亚芳等, 2018), 进而可能导致C:N和C:P偏低. ...
C:N:P stoichiometry in soil: Is there a “Redfield ratio” for the microbial biomass? 4 2007
... 生态化学计量学是研究植物-微生物-土壤系统生物地球化学循环的一门新兴学科(Sterner & Elser, 2002).碳(C)、N、磷(P)是元素循环和转化的核心, 调节和驱动着地上植物群落结构组成以及地下生态过程.研究表明微生物生物量C:N:P生态化学计量特征在很大程度上符合“Redfield ratio” (Cleveland & Liptzin, 2007), 即微生物具有保持自身C、N、P组成比相对稳定的能力(Hessen & Elser, 2010).然而, 近年来随着N沉降的加剧, 微生物生物量元素计量关系逐渐趋于失衡(Mayor et al., 2015; Li et al., 2017; 王传杰等, 2018).植被-土壤系统地上和地下过程是相互联系的(Zechmeister-Boltenstern et al., 2015).植物地下部分和微生物对养分的相互依存和相互竞争关系, 直接调控着植物生产力和群落多样性(van der Heijden et al., 2008; 蒋婧和宋明华, 2010).此外, 微生物生物量C:N:P决定了其活动方向(养分固持或矿化), 影响着土壤养分有效性.因此, N沉降下微生物生物量C:N:P平衡关系的改变可能会通过与植物地下部分以及土壤元素的相互作用, 影响到植被地上部分群落组成.目前国内研究****已分别从植物N:P计量平衡(Zhan et al., 2017), 植物资源竞争(Lan et al., 2015), 凋落物累积和土壤酸化(Fang et al., 2012), 金属离子富集和叶片Mn2+吸收规律(Tian et al., 2016)等方面揭示了N添加引起植物多样性降低的机制, 尚缺乏从微生物生物量C:N:P生态化学计量关系角度的探讨. ...
... 微生物生物量C:N:P生态化学计量比决定了微生物活动的方向以及凋落物分解过程中养分释放与否, 因此影响着土壤C状况和养分有效性(Heuck et al., 2015).全球尺度上微生物生物量C:P变化幅度较大(平均值为59.5, 摩尔比), 但C:N (3-24)和N:P (1-55)变化幅度较小(Cleveland & Liptzin, 2007).本研究中, 转换后的微生物生物量C:N、C:P和N:P的变化范围分别为5.26-14.30、39.79-76.19和4.33-15.70, 处于全球数据的变化范围之内, 但是低于我国黄河三角洲湿地(Lu et al., 2018)以及高山草地的值(Zhao et al., 2017a).其原因一方面可能是N添加提高了土壤N有效性(附录I), 因此刺激了微生物生长发育.另一方面, 试验草地自1998年开始围封, 连续18年的禁牧促进了微生物活动以及N和P的积累(曹成有等, 2011; 薛亚芳等, 2018), 进而可能导致C:N和C:P偏低. ...
... N是影响微生物活性的重要因素, 同时又是大多数陆地生态系统微生物生长发育的主要限制因子.因此, 大气N沉降增加会影响到微生物生物量积累, 但其影响较为复杂, 有关研究结论具有很大的不确定性(何亚婷等, 2010).基于全球尺度的数据整合分析结果表明, N添加显著提高了微生物生物量C:P和N:P, 对微生物生物量C:N的影响则受到生态系统类型的综合影响(Yue et al., 2017).本研究中, 少量N添加对微生物生物量C:N:P生态化学计量特征影响较小, 中高量N添加提高了微生物生物量N含量和N:P, 降低了C:N.微生物生物量C:N:P生态化学计量比可以反映生态系统养分的受限程度(Cleveland & Liptzin, 2007), 因此以上研究结果意味着中高量N添加缓解了研究区N受限性, 但同时可能导致P限制风险增加, 与全球尺度以及小尺度N添加试验结果相似(Yue et al., 2017; Zhou et al., 2017; Soong et al., 2018). ...
... 大气氮(N)沉降是指由地面排放源排放至大气中的含N化合物, 在大气中经过混合、转化、扩散和漂移并降落汇至地表的过程(Goulding, 1990).21世纪初, 人为活性氮(Nr)排放量已经达到自然界排放的2倍(85 Tg·a-1), 且其中的78%又以N沉降的形式降落至地面(Fowler et al., 2013).据估计, 全球N沉降量到2050年可能会增至195 Tg·a-1 (Galloway et al., 2004).在我国, N沉降速率已从20世纪80年代的13.2 kg·hm-2·a-1增加至21世纪的21.1 kg·hm-2·a-1 (Liu et al., 2013); 20世纪90年代至21世纪10年代期间全国NO3-湿沉降量提高了74.1% (Yu et al., 2017); 2008-2012年我国平均N沉降速率约为16.4 kg·hm-2·a-1, 其中62%为NHx, 38%为NOy (Zhao et al., 2017b).区域N沉降时空格局模拟结果表明, 21世纪初宁夏大部分地区N沉降速率达到20 kg·hm-2·a-1以上, 低于南方大部分地区平均值但高于西北地区平均水平(顾峰雪等, 2016).N作为大量营养元素之一, 对植物的生长发育至关重要.同时, N限制广泛存在于陆地生态系统中(LeBauer & Treseder, 2008).因此, 短期或少量N沉降在一定程度上可缓解植物生长所受的N限制, 对植物地上部分的生长具有促进作用(Bai et al., 2010; 王晶等, 2016); 但长期或高量N沉降不但会引起N富集, 而且可能造成植被-土壤系统元素计量关系失衡, 生物多样性降低和生态系统服务功能降低等问题(Li et al., 2016). ...
Spatial and seasonal distribution of carbon, nitrogen, phosphorus, and sulfur and their ecological stoichiometry in wetland soils along a water and salt gradient in the Yellow River Delta, China 1 2018
... 微生物生物量C:N:P生态化学计量比决定了微生物活动的方向以及凋落物分解过程中养分释放与否, 因此影响着土壤C状况和养分有效性(Heuck et al., 2015).全球尺度上微生物生物量C:P变化幅度较大(平均值为59.5, 摩尔比), 但C:N (3-24)和N:P (1-55)变化幅度较小(Cleveland & Liptzin, 2007).本研究中, 转换后的微生物生物量C:N、C:P和N:P的变化范围分别为5.26-14.30、39.79-76.19和4.33-15.70, 处于全球数据的变化范围之内, 但是低于我国黄河三角洲湿地(Lu et al., 2018)以及高山草地的值(Zhao et al., 2017a).其原因一方面可能是N添加提高了土壤N有效性(附录I), 因此刺激了微生物生长发育.另一方面, 试验草地自1998年开始围封, 连续18年的禁牧促进了微生物活动以及N和P的积累(曹成有等, 2011; 薛亚芳等, 2018), 进而可能导致C:N和C:P偏低. ...
Are bacteria more like plants or animals? Growth rate and resource dependence of bacterial C:N:P stoichiometry 1 2003
... 进一步的变差分解结果显示(图5), 微生物生物量C:N:P生态化学计量特征对植物种群生物量和群落多样性指数的独立解释力较低, 但其与其他土壤因子有较强的共同解释力, 表明微生物生物量元素化学计量关系与这些土壤因子高度相关, 共同作用于植物群落结构变化.可能原因在于: 一方面, 微生物在生长过程中需要土壤养分的协调供应, 所以土壤C:N:P生态化学计量特征会显著影响微生物生物量C:N:P生态化学计量特征和代谢活动(周正虎和王传宽, 2016); 另一方面, 微生物通过自身的固N和硝化作用, 会对土壤中有效N的含量产生影响(Leff et al., 2015).而且, 微生物胞外酶的释放作用和对底物的分解也会影响到土壤中P等养分的供给状况(Makino et al., 2003).因而微生物和土壤之间N和P传递和转化的耦合关系, 将直接作用于植物元素化学平衡特征乃至群落结构(Zechmeister- Boltenstern et al., 2015). ...
Decoupled stoichiometric, isotopic, and fungal responses of an ectomycorrhizal black spruce forest to nitrogen and phosphorus additions 1 2015
... 生态化学计量学是研究植物-微生物-土壤系统生物地球化学循环的一门新兴学科(Sterner & Elser, 2002).碳(C)、N、磷(P)是元素循环和转化的核心, 调节和驱动着地上植物群落结构组成以及地下生态过程.研究表明微生物生物量C:N:P生态化学计量特征在很大程度上符合“Redfield ratio” (Cleveland & Liptzin, 2007), 即微生物具有保持自身C、N、P组成比相对稳定的能力(Hessen & Elser, 2010).然而, 近年来随着N沉降的加剧, 微生物生物量元素计量关系逐渐趋于失衡(Mayor et al., 2015; Li et al., 2017; 王传杰等, 2018).植被-土壤系统地上和地下过程是相互联系的(Zechmeister-Boltenstern et al., 2015).植物地下部分和微生物对养分的相互依存和相互竞争关系, 直接调控着植物生产力和群落多样性(van der Heijden et al., 2008; 蒋婧和宋明华, 2010).此外, 微生物生物量C:N:P决定了其活动方向(养分固持或矿化), 影响着土壤养分有效性.因此, N沉降下微生物生物量C:N:P平衡关系的改变可能会通过与植物地下部分以及土壤元素的相互作用, 影响到植被地上部分群落组成.目前国内研究****已分别从植物N:P计量平衡(Zhan et al., 2017), 植物资源竞争(Lan et al., 2015), 凋落物累积和土壤酸化(Fang et al., 2012), 金属离子富集和叶片Mn2+吸收规律(Tian et al., 2016)等方面揭示了N添加引起植物多样性降低的机制, 尚缺乏从微生物生物量C:N:P生态化学计量关系角度的探讨. ...
Different inter-annual responses to availability and form of nitrogen explain species coexistence in an alpine meadow community after release from grazing 1 2012
 ,
, ,3,*1.
 新窗口打开|下载原图ZIP|生成PPT
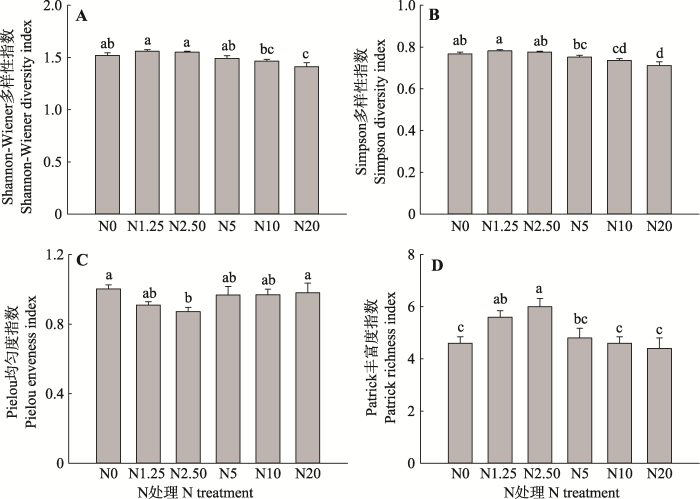 新窗口打开|下载原图ZIP|生成PPT
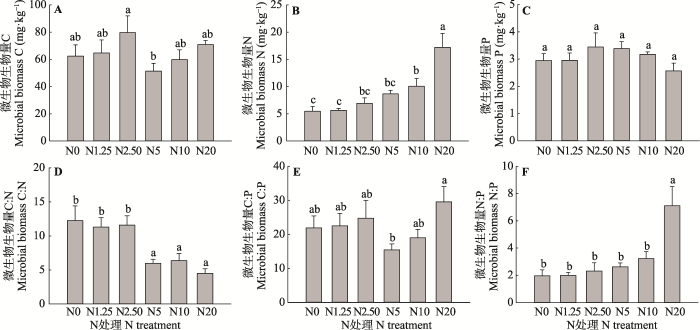 新窗口打开|下载原图ZIP|生成PPT
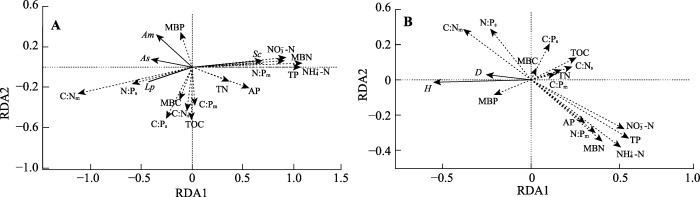 新窗口打开|下载原图ZIP|生成PPT
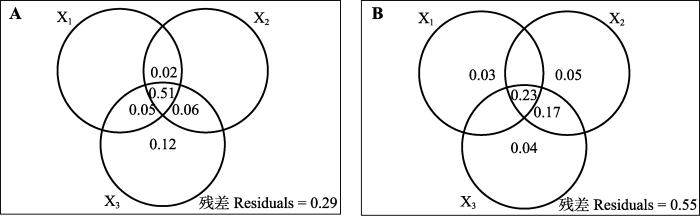 新窗口打开|下载原图ZIP|生成PPT

