 ,1,*
,1,*Identification of maize flowering gene co-expression modules by WGCNA
YANG Yu-Xin1, SANG Zhi-Qin1,2, XU Cheng1, DAI Wen-Shuang1, ZOU Cheng,1,*通讯作者:
第一联系人:
收稿日期:2018-07-17接受日期:2018-10-8网络出版日期:2018-11-08
| 基金资助: |
Received:2018-07-17Accepted:2018-10-8Online:2018-11-08
| Fund supported: |

摘要
关键词:
Abstract
Keywords:
PDF (1494KB)元数据多维度评价相关文章导出EndNote|Ris|Bibtex收藏本文
本文引用格式
杨宇昕, 桑志勤, 许诚, 代文双, 邹枨. 利用WGCNA进行玉米花期基因共表达模块鉴定[J]. 作物学报, 2019, 45(2): 161-174. doi:10.3724/SP.J.1006.2019.83053
YANG Yu-Xin, SANG Zhi-Qin, XU Cheng, DAI Wen-Shuang, ZOU Cheng.
近年来, 随着高通量测序技术的飞速发展与成本不断的降低, 越来越多的研究人员采用多样本的转录组测序进行生物学问题的研究。用多样本的转录组数据可以系统地研究复杂条件下(例如多个组织、多个环境、多试验变量)的生物学问题, 然而传统的两个样本的相关性比较方法已经不能有效的处理海量的生物学数据。面对这个问题, 网络研究的方法脱颖而出, 当前生物学研究中广泛应用的网络研究方法有基因网络[1]、蛋白质调控网络[2]和代谢网络[3]等。借助于基因组学和转录组学的快速发展, 基因调控网络在理论和实践层面都取得了较快的发展。在基因调控网络中, 应用较广泛的是权重基因共表达网络。前人研究指出, 权重基因共表达网络内部的基因联通符合无尺度的网络拓扑结构, 即网络中少数基因作为网络中的核心节点与大部分基因具有联系, 该过程的实现依赖于对基因间的连接系数进行幂函数处理, 使网络逐渐趋向无尺度分布[4]。因此借助网络分析, 可以有效地利用海量的转录组数据, 将众多基因划分为相似的基因表达模块进行研究。权重基因共表达网络分析(weighted gene co-expression network analysis, WGCNA)根据基因表达水平的不同将基因聚类, 具有相似表达模式的基因被划分到同一个模块中。其目的在于研究共表达模块和目标性状之间的生物学相关性、鉴定组织特异性模块并研究模块内的核心基因。WGCNA作为一种系统生物学方法, 已经广泛应用于多样本的生物学问题研究当中。例如在动物中, 研究人员利用四个年龄段的恒河猴[5](Macaca mulatta L.), 分别选取8个组织进行转录组测序, 通过将不同的lncRNA和mRNA分为不同的模块, 阐释了lncRNA-lncRNA, lncRNA-mRNA基因间的共表达关系。WGCNA也广泛应用在植物研究中, 为了研究油菜(Brassica napus L.)在干旱处理条件下的mRNA的表达模式[6], 研究人员利用干旱和对照处理下的48个转录组数据进行了共表达网络构建, 进一步鉴定到与干旱处理相关的生物学模块, 并且挖掘了目标模块内的核心基因。在对草莓(Fragaria L.)花的研究中[7], 研究者选取了6个组织, 12个发育时期的样品, 进行了转录组测序进而得到了共表达网络, 在特异性模块中鉴定到了大量的转录因子作为模块中的核心基因, 对促进花芽分化具有重要的作用, 此外该研究还表明WGCNA比K-MEAN聚类更具有特异性, 这是因为WGCNA构建的网络符合无尺度拓扑分布, 因此可以得到更多的具有生物学意义的模块。
玉米开花是一个多基因控制的数量性状, 代表了玉米从生殖生长到营养生长的转变。开花是玉米生育周期中的重要农艺性状, 关系到叶片数量、产量、营养价值以及抗逆性等性状。近年来, 研究人员利用分子生物学的方法, 已经在玉米中鉴定到了数十个开花调控基因。例如, 通过数量性状位点定位, 已经克隆了数个开花调控基因, 包括VGT1[8]、ID1[9]和DLF1[10]。研究人员结合突变体分析和转基因技术鉴定到了FLOWERING LOCUS T在玉米中的同源基因ZCN8[11], 研究结果表明ZCN8是一个开花促进因子, 该基因在叶片中表达并通过韧皮部运送到玉米的顶端分生组织, 在顶端分生组织中与DLF1转录因子结合, 进而激活开花促进因子ZMM4[12], 而ZMM4的表达则标志着玉米开始从营养生长转变到生殖生长。此外, 有研究使用5000份重组玉米自交系进行巢式关联分析, 鉴定到数十个参与光周期调控的候选基因[13]。随着玉米参考基因组以及单倍型图谱的相继构建完成, 利用重测序、转录组和代谢组等生物信息学手段研究玉米的农艺性状已经成为一个有力的手段, 然而前人的研究着眼于单个调控因子(如顺式表达元件, 反式作用因子), 鲜有利用网络分析的方法解析玉米开花遗传机制的报道。
本研究利用玉米14个不同组织的RNA-seq数据, 计算得到全基因组水平上的基因表达量, 进而构建了具有高度拓扑性质的共表达网络, 得到了基因共表达模块, 并进一步筛选到了与组织高度关联的共表达模块。通过对组织特异性模块的基因富集分析发现了具有生物学功能的模块。此外, 结合富集分析的结果, 鉴定到了数个与开花调控相关的模块。本研究利用转录组数据得到了开花相关的共表达模块, 挖掘了模块内的开花相关的调控基因, 为玉米开花的遗传机制解析提供了新的研究思 和实验结果。
1 材料与方法
1.1 玉米转录组数据获取与分析
玉米不同发育阶段的转录组数据来源于NCBI(national center for biotechnology information)的SRA (Sequence Read Archive)数据库, 获取码为PRJNA171684[14]。转录组数据来源于叶片、顶端分生组织、花丝、花药、果穗等组织。首先利用SRAtoolkit软件的fast-dump参数将高通量测序数据转变为Fastq文件, 利用FastQC[15]软件对原始测序数据进行质量评估, 接着利用Trimmomatic软件去除接头、低质量和未知碱基数目过多的reads, 得到clean reads。参考Pertea流程[16], 利用Hisat2软件将clean reads比对到玉米B73参考基因组。玉米参考基因组序列和注释信息下载自ensemble数据库发布的玉米基因组信息(ftp://ftp.ensemblgenomes.org/ pub/plants/release-27/genbank/zea_mays/), 利用Stringtie软件对转录本组装, 之后采用R软件的Ballgown包计算基因在每一个组织中的转录本表达量。使用FPKM (fragments per kilobase of exon per million fragments mapped, 每千碱基外显子百万片段数)值来衡量基因的表达水平。1.2 共表达网络构建
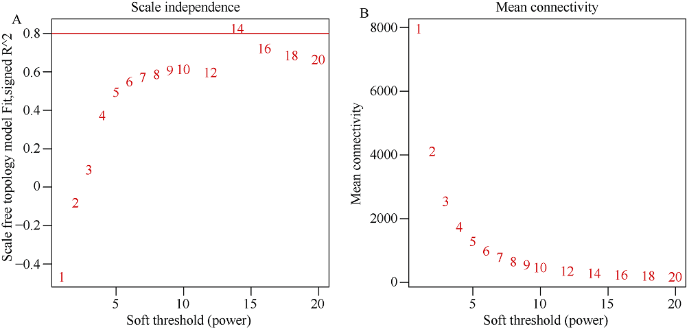
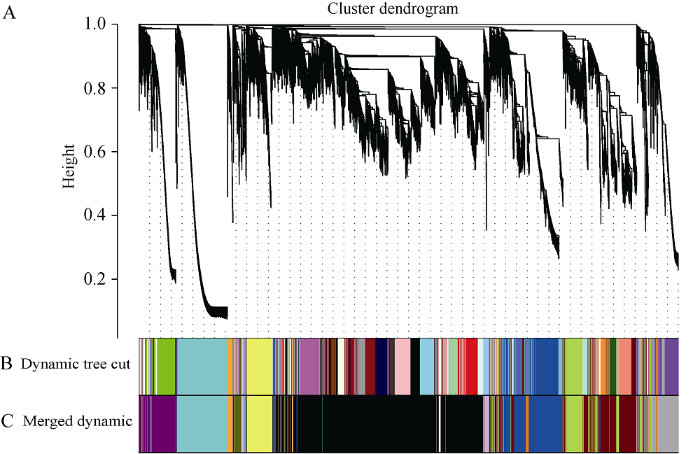
基因的表达谱矩阵来自所有样本的基因表达量。考虑到在各个组织中均低表达的基因不具有生物学意义, 在后续的计算中还会增加运算量, 因此为了保证共表达网络的特异性和快捷性, 基因在各个组织中的最大FPKM值小于5的将被过滤[17,18]。首先, 构建共表达网络需要计算每2个基因间的相关系数, 进而得到相似矩阵。使用公式表示如下: Smn=cor(xm, xn), S=[Smn], 式中Smn表示基因m和基因n之间的皮尔森相关系数, S表示相似矩阵。R软件中的WGCNA包提供了一系列函数用来构建权重基因共表达网络[19,20]。为了使网络符合无尺度网络分布, 需要选择合适的权重值, 利用WGCNA包中的函数pickSoftThreshold计算权重值。根据图1的结果, 选择软阈值β=14用来构建共表达网络, 在该参数下每个基因的平均邻接系数是280, 中位数是165, 最大连接系数是1140。邻接矩阵的计算公式为Amn=[(1+Smn)/2]β, 为了清除背景噪音和伪关联带来的误差, 将邻接矩阵转为拓扑重叠矩阵(Topological Overlap Matrix, TOM), 同时利用函数dissTom=1-TOM对拓扑重叠矩阵取逆得到相异性矩阵。利用函数hclust对相异矩阵进行层次聚类。针对产生的聚类树, 采用动态切割 (Dynamic Tree Cut) 法切割基因聚类树, 相关参数为minModuleSize=30, 该过程可以把表达模式相近的基因合并在同一个分支, 每一个分支代表一个共表达模块(图2)。
图1
 新窗口打开|下载原图ZIP|生成PPT
图1软阈值确定
图中的横轴均代表软阈值(β)。A: 纵坐标对应的是无尺度网络模型指数; B: 每一个软阈值对应的网络平均连接程度。
Fig. 1Determination of soft threshold
The abscissa represents the soft threshold (β). A: ordinate corresponds to the index of scale free network model; B: the average link degree of each soft threshold.
图2
 新窗口打开|下载原图ZIP|生成PPT
图2基因聚类树和模块切割
A: 基于拓扑重叠构建的基因聚类树。B: 动态混合切割法得到的基因模块, 颜色代表模块。C: 合并相似表达模式的基因模块。
Fig. 2Gene cluster dendrograms and module detecting
A: clustering of genes based on the topological overlap. B: the gene modules obtained from the dynamic tree cut. C: the merged modules with similar expression pattern.
1.3 组织特异性模块鉴定
具有相似表达模式的基因被认为是具有类似的生物学功能。模块是一组表达模式高度相似的基因集合。为了深入研究与组织高度相关联的模块, 计算了模块特征向量(module eigengene, ME)和不同组织之间的相关系数, 相关系数越大, 该模块与组织间关联度越高, 而相关系数值越小, 模块与组织间关联度低。为了研究具有高度生物学特性的模块, 本研究定义相关系数的阈值为0.65, 即任何模块与组织的相关系数高于0.65将被定义为组织特异性模块[21]。1.4 模块基因的富集分析
首先提取出组织特异性模块中的基因, 再将模块基因提交到Agrigo[22](GO Analysis Toolkit and Database for Agricultural Community)(http://bioinfo. cau.edu.cn/agriGO/index.php)在线分析工具, 采用奇异富集分析(singular enrichment analysis, SEA)法进行富集分析。使用玉米参考基因组B73作为参考数据库, 利用Fisher’s校验和Bonferronni多重校验来进行显著GO类型的筛选。1.5 玉米开花调控通 的相关模块
开花作为一个复杂的农艺性状, 不仅与外界环境信号有关, 同时也涉及到内源性的信号调控[23]。根据已有的文献报道, 玉米开花受到日照、赤霉素以及DNA的甲基化修饰等因素的调控。利用开花调控相关的一些关键词例如开花(flower)、光(light)、赤霉素(gibberellin)、甲基化(methylation)、分生组织(meristem)等, 在组织特异性模块中查找参与调控开花的模块与基因。1.6 基因互作网络的构建
根据拓扑重叠矩阵计算出模块中不同基因间的权重值, 权重值越高, 代表基因间的关联程度越高。筛选出模块间相关系数排名较高的基因, 同时挑选出模块中已经报道过的开花基因, 利用这些基因进行互作网络的构建, 网络中每一个节点代表一个基因, 连接线两端的基因具有相似的生物学功能。2 结果与分析
2.1 基因共表达网络构建
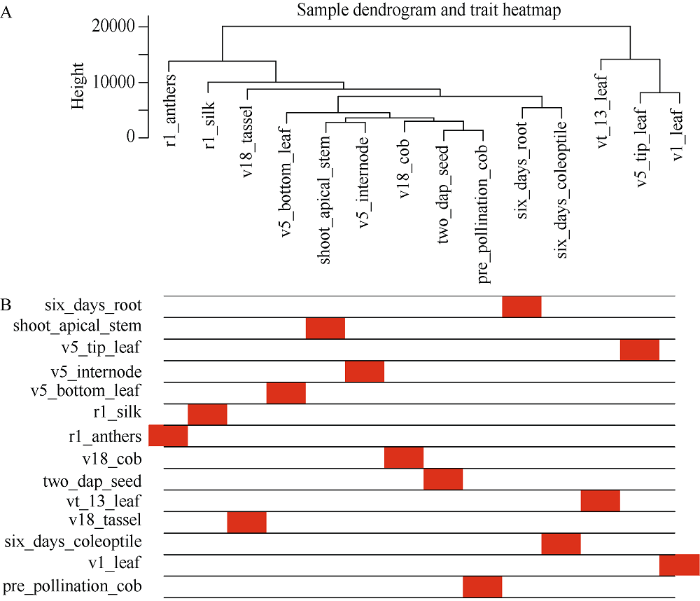
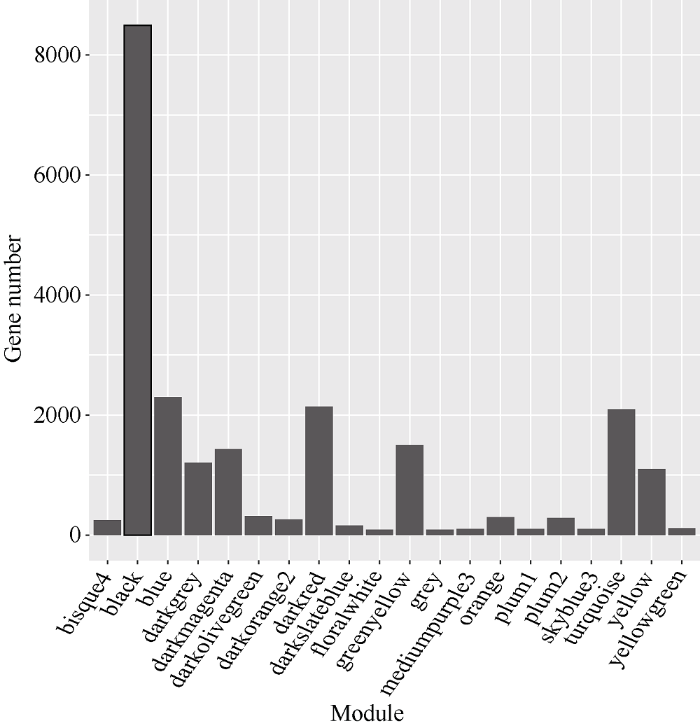
通过数据分析共获得39,625个基因的表达谱数据, 过滤低表达量的基因, 获得22,426个高表达基因。计算得到了基因表达水平的样本聚类和性状关联, 图3的结果表明每一个组织的基因聚类树可以和组织很好地对应。通过对权重值筛选, 最终选择β=14来构建网络, 采用动态剪切树法合并表达相似的模块, 共获得20个共表达模块(图2), 不同的颜色代表不同的模块。模块中的基因数目分配根据其表达量进行一个相关度的聚类, 聚类度较高的基因被分配到一个模块中, 其中Black模块包含的基因数目最多, 是8492个基因, Floralwhite模块内的基因数量最少, 含87个基因, 平均每个模块包含的基因数目是1123, Grey模块是一组未分配到其他模块的基因集合(图2)。图3
 新窗口打开|下载原图ZIP|生成PPT
图3样本层次聚类树及对应的组织信息
A: 基于欧氏距离得到的基因聚类树。横轴表示不同的玉米组织, 纵轴代表基因间的聚类高度。B: 性状与基因聚类树关联热图。白色的代表低关联度, 红色的代表高关联度。
Fig. 3Clustering dendrogram of samples and corresponding tissue information
A: the gene cluster tree based on the Euclidean distance. The abscissa represents the different tissues. The ordinate represents the cluster height of genes. B: the association trait heatmap, the white means a low correlation, the red means a high correlation.
图4
 新窗口打开|下载原图ZIP|生成PPT
图4共表达模块中基因数目分布
横轴代表模块, 纵轴代表模块中的基因数目。
Fig. 4Distribution of number of genes in modules
The abscissa represents the modules and the vertical ordinate represents the gene number of each module.
2.2 组织特异性模块鉴定
在20个模块中有14个与组织存在高度特异性(图5)。大多数组织都有与其高度相关联的模块, 例如Blue模块与13叶期叶片存在高度相关性(r=0.96, P=6E-08), Darkmagenta与v18雄穗连接度较高(r=0.98, P=2E-09)。14个组织特异性模块中没有任何一个模块和v18未成熟果穗与授粉前果穗两个组织存在高度相关性。我们推测这两个时期组织中的基因主要进行常规的生命活动, 因此没有组织特异性的模块与之对应。图5
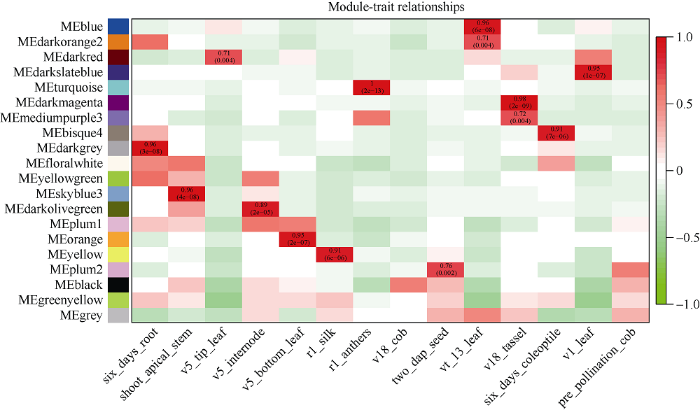 新窗口打开|下载原图ZIP|生成PPT
图5模块与性状关联热图
横轴表示不同的性状, 纵轴表示每一个模块的特征向量。红色的格子代表性状与模块具有正相关性, 绿色的格子代表性状与模块具有负相关性。
Fig. 5Heat map of module-trait relationship
Each column represents the co-expression module. Red color of each box represents the positive correlation between module and trait. Green color of each box represents the negative relationships between module and trait.
2.3 组织特异性模块的功能富集分析
具有相似表达模式的基因可能具有相同的生物学功能, 通过共表达网络构建的模块在很大程度上与特定的生物组织相联系, 而特定的生物组织又与特定生命活动存在高度协同性[4]。为了进一步解析组织特异性模块的生物学功能, 本研究利用Agrigo工具对模块基因进行富集分析, 表明这14个模块都可以富集得到显著的GO通 , 这些GO通 涉及到生物学过程(biological process, BP), 分子功能(molecular function, MF)以及细胞组分(cellular component, CC)。与根发育高度关联Darkgrey模块可以富集得到水转运(GO:0006833), 流体运送(GO:0042044)等调控通 , 表明WGCNA可以构建到具有生物学意义的共表达模块。通过对开花发育与调控的关键字进行检索发现, Blue、Darkmagenta、Darkred、Darkslateblue、Orange、Plum2、Yellow和Bisuqe4模块都富集到了与开花相关的调控通 (图6), 这些通 主要是响应光照刺激的调控通 (GO:0009416)、顶端分生组织形态保持(GO:0010073)和花器官发育(GO:0048437)等。Blue模块与13叶期叶片存在最高的相关性(r=0.96, P=6E-08), Darkmagenta模块和v18雄穗具有最高的相关性(r=0.98, P=2E-09), 这两个模块对应的组织是叶片和雄穗, 是和开花密切相关的组织, 此外, Blue模块包含了7个已经报道的开花基因, Darkmagenta模块也包含6个已经报道的开花基因, 虽然富集得到了开花调控通 , 但是开花基因数目较少或者没有已知开花基因存在于这些模块, 因此本研究重点关注了Blue模块(图7)和Darkmagenta (图8)模块, 筛选出模块中高连通性的基因, 利用Cytoscape[24]软件对网络进行了可视化处理, 处于网络中的基因是该模块中的高连接度的基因。图6
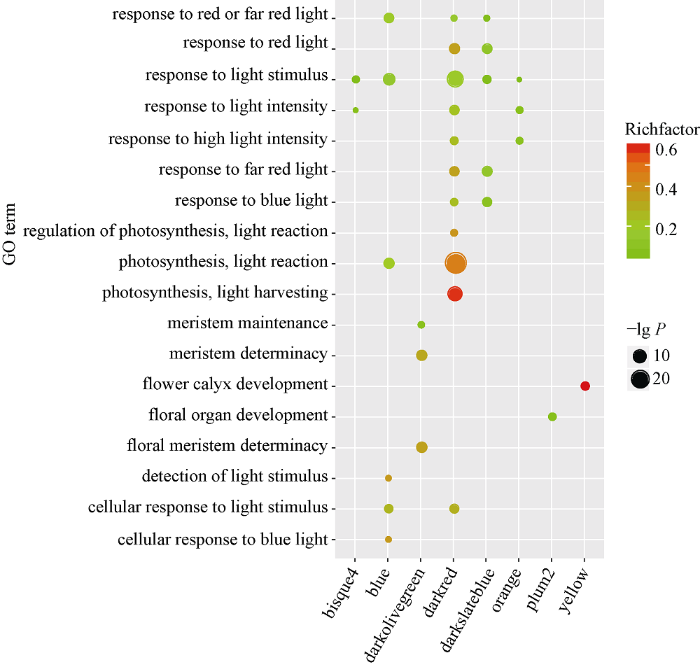 新窗口打开|下载原图ZIP|生成PPT
图6开花富集通
每一行代表开花富集通 , 每一列代表组织特异性模块。点的大小代表多重校验的P值大小, 点的颜色表示输入基因与背景基因的比值。
Fig. 6Enrichment pathway of flowering time
Each row corresponds to a GO enrichment pathway, column to a tissue specific module. The point size is calculated by the P-value of multiple check. The Richfactor represent the ratio of input genes to the background genes.
图7
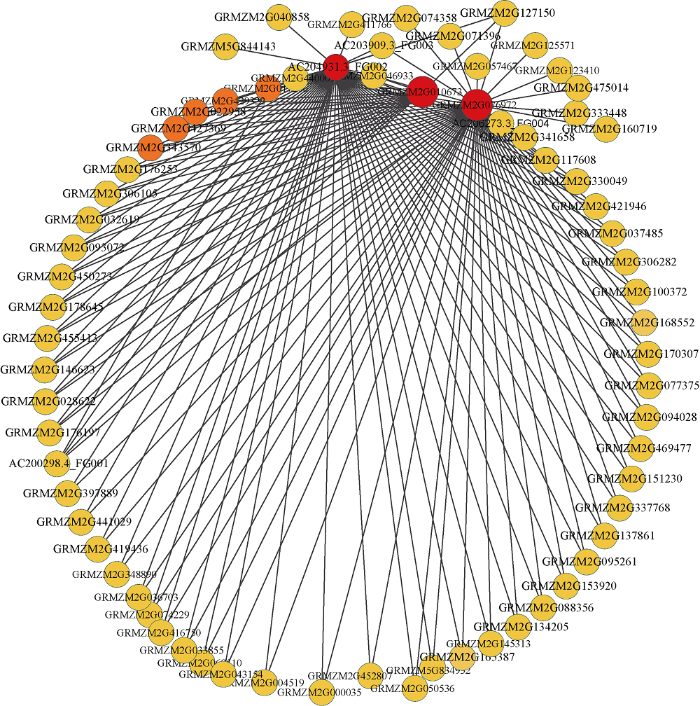 新窗口打开|下载原图ZIP|生成PPT
图7Blue模块内的基因共表达网络
Fig. 7Gene co-expression network of the blue module
图8
 新窗口打开|下载原图ZIP|生成PPT
图8Darkmagenta模块内基因共表达网络
Fig. 8Gene co-expression network of the darkmagenta module
2.4 开花基因互作网络构建
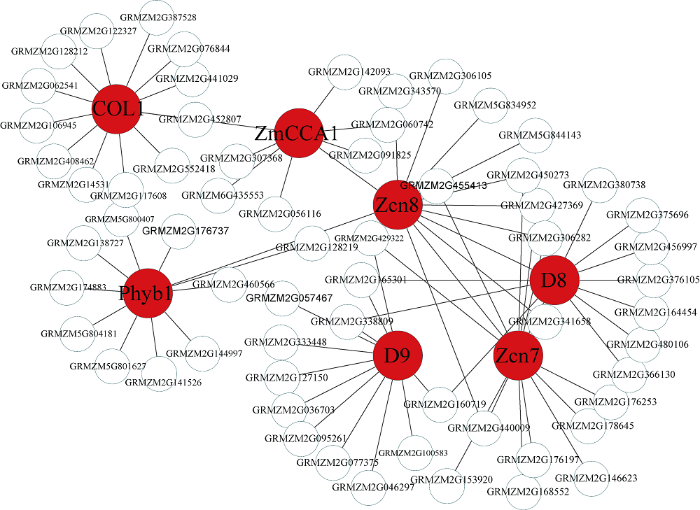
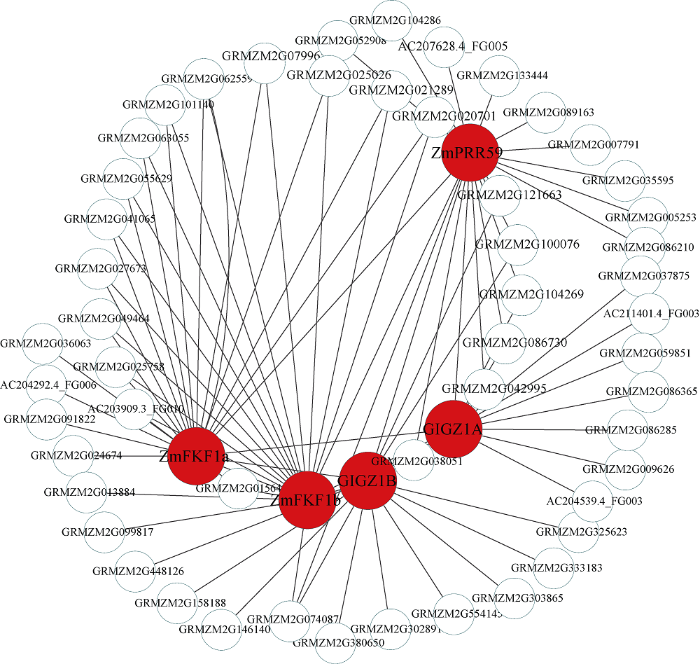
考虑到开花时间调控基因主要分布在Blue和Darkmagenta模块, 因此利用这2个模块中已经报道的开花基因构建基因互作网络。Blue模块中共发现7个报道过的开花基因, 其中ZCN8、ZCN7[25]和COL1[26] 3个基因的连通性在模块排名为前1%, 可以作为模块中的核心基因, ZCN8和ZCN7作为开花促进因子, 是开花调控通 中的重要基因。此外PhyB1[27]、D8[28,29]、D9[30]和ZmCCA1[31]基因在模块中联通性排名靠后, 但是这些基因被证明是玉米开花调控通 中关键基因, 推测WGCNA构建的模块中, 基因的连通性基于基因间表达量, 而基因间表达量受多种因素影响, 导致关键调控基因在模块中的相关性较低。因此, 本研究以ZCN8、ZCN7、COL1、PhyB1、D8、D9、ZmCCA1等基因作为枢纽基因, 筛选与开花基因高连通性的基因, 将其定义为候选开花基因, 利用开花基因和候选花期基因构建局部调控网络(图9), 在该网络中, 每一个节点代表一个基因, 节点间通过连接线相联系, 处于连接线两端的基因被认为具有相同生物功能。与v18雄穗高度关联的Darkmagenta模块包含6个开花调控基因, 即GIGZ1B[32]、PhyC2[33]、GIGZ1A[32]、ZmFKF1b[34]、ZmFKF1a[34]和ZmPRR59[35], 在该模块中有2个基因的连通性排名前10%, 分别是ZmFKF1a和ZmFKF1b, 参照Blue模块的研究思 , 利用Darkmagenta已经报道过的开花基因构建Darkmagenta模块内的局部调控网络(图10)。此外, 检索了候选开花基因在拟南芥中的同源基因, 并借助TAIR (https://www.arabidopsis.org/)网站注释了拟南芥同源基因的功能(表1)。图9
 新窗口打开|下载原图ZIP|生成PPT
图9Blue模块开花相关的基因网络。。。
红色节点是参与开花调控通 的基因。
Fig. 9Gene interaction network of blue module
Each node corresponding to a gene, the red node is the hub gene of the network and is the flowering time gene which had reported.
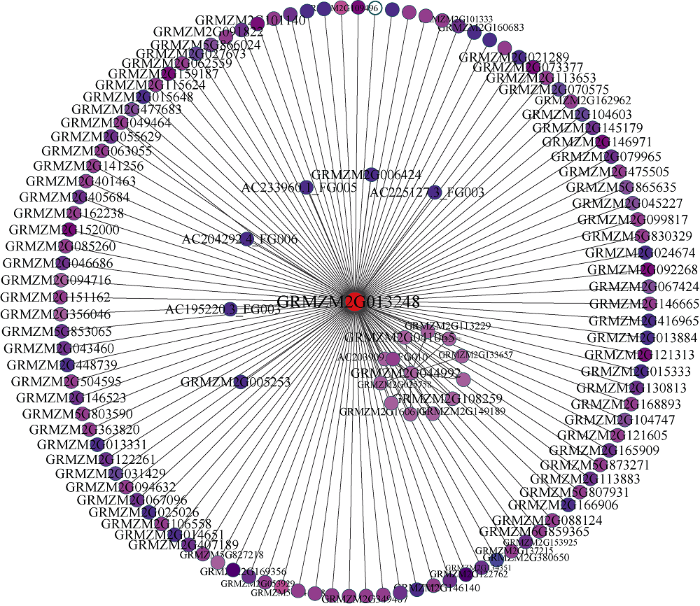
图10
 新窗口打开|下载原图ZIP|生成PPT
图10Darkmagenta模块的开花相关的基因网络
红色节点基因参与开花调控通 。
Fig. 10The gene interaction network of darkmagenta module
Each node corresponding to a gene, the red node is the hub gene of the network and is the flowering time gene which had reported.
Table 1
表1
表1Darkmagenta模块和Blue模块中候选开花基因的功能注释。
Table 1
| 模块 Module | 开花基因 Flowering gene | 候选开花基因 Candidate flowering gene | 候选基因在拟南 芥同源基因 Homologous gene in A. thaliana | 基因功能 Gene function |
|---|---|---|---|---|
| Blue | ZCN8 | GRMZM2G450273 | FPF1 | 编码调节开花的小蛋白质并参与赤霉素信号传导途径, 在开花的光周期诱导后, 在顶端分生组织中表达 Encodes a small protein that regulates flowering and is involved in gibberellin signalling pathway. It is expressed in apical meristems immediately after the photoperiodic induction of flowering |
| ZCN7 | GRMZM2G455413 | PSBA | 编码叶绿素结合蛋白D1, 属于光系统II反应中心 Encodes chlorophyll binding protein D1, belonging to photosystem II reaction center core | |
| COL1 | GRMZM2G128212 | ZFP8 | 编码锌指蛋白 Encodes a zinc finger protein | |
| PhyB1 | GRMZM5G800407 | PMAT2 | 编码消除酚类毒素的丙二酰转移酶 Encodes a malonyltransferase that may play a role in phenolic xenobiotic detoxification | |
| D8 | GRMZM2G338809 | AMT2 | 编码高亲和性的铵转运蛋白 Encodes a high-affinity ammonium transporter | |
| D9 | GRMZM2G429322 | LHT1 | 编码一个在细胞间转运氨基酸的高亲和力蛋白 Encoding a high affinity protein that translocation amino acids between cells | |
| ZmCCA1 | GRMZM6G435553 | PMI1 | 响应蓝光和渗透压胁迫 Response to blue light and osmotic stress | |
| Darkmagenta | GIGZ1B | GRMZM2G333183 | ABCB1 | ATP结合蛋白, 调节生长素转运 ATP-binding protein, regulates the transport of auxin |
| PhyC2 | GRMZM2G038846 | AT1G19320 | 与发病机制相关的超家族蛋白 Pathogenesis-related thaumatin superfamily protein | |
| GIGZ1A | GRMZM2G104269 | OASC | 参与花粉管生长和受精 Involved in pollen tube growth and fertilization | |
| ZmFKF1b | GRMZM2G041065 | ATAVP3 | 无机H焦磷酸酶家族蛋白, 在分生组织和花器官原基表达 Inorganic H pyrophosphatase family protein. Expressed in meristems and floral organ primordium | |
| ZmFKF1a | GRMZM2G027673 | FAB2 | 植物硬脂酰酰基载体蛋白去饱和酶家族蛋白 Plant stearoyl-acyl-carrier-protein desaturase family protein | |
| ZmPRR59 | GRMZM2G107945 | FKF1 | 编码黄素结合的F-box蛋白, 调节花期转变 Encodes flavin-binding F-box protein, regulates transition to flowering | |
| ZmPRR59 | GRMZM2G106363 | LKP2 | 编码F-box蛋白, 响应红光和蓝光, 参与光周期途径 Encodes a member of F-box proteins, response to red and blue light, involved in photoperiod pathway |
新窗口打开|下载CSV
3 讨论
传统的生物学研究侧重于从分子水平阐释单个功能元件(如DNA、mRNA和蛋白质)对生命活动的影响, 虽然该方法对于揭示具体性状的遗传机理具有非常重要的意义, 但只能局部地解释某一生命活动发生的原因。随着测序技术的快速发展, 传统的生物学研究不能充分有效地挖掘海量数据中蕴含的生物学意义。网络作为系统生物学的一种研究手段, 借助基因组、转录组和代谢组的数据, 广泛地应用于生命科学的探索中。相比于其他调控网络, WGCNA可以特异地筛选出与性状相关的基因, 并进行模块化分类, 得到具有高度生物学意义的共表达模块, 已经被证明是一种高效的数据挖掘手段[36]。本研究通过对14个组织特异性模块进行富集分析, 发现这14个模块均可以得到具有生物学意义的调控通 (附表1)。例如在与根高度关联的Darkgrey模块, 富集分析的GO term包含水转运(GO:0006833)、流体运输(GO:0042044)等通 , 这些通 和根部所具有的生物功能高度吻合, 该结果证明了共表达网络构建模块的特异性。本研究直接利用转录组数据对应的组织, 例如根、叶片和花药等作为研究的性状, 该方法在前人的研究中已有过相关报道, 如在黄瓜(Cucumis sativus L.) 10个组织的共表达网络构建中, 研究人员成功鉴定到数个与黄瓜苦味合成代谢相关的模块[18]。
Supplementary table 1
附表1
附表1组织特异性模块的GO富集分析结果(部分)
Supplementary table 1
| 模块 Module | GO条目 GO term | 本体 Ontology | 描述 Description | P值 P-value | |
|---|---|---|---|---|---|
| Darkorange2 | GO: 0009889 | BP | 生物合成过程调节Regulation of biosynthetic process | 6.90E-07 | |
| Darkorange2 | GO: 0006355 | BP | DNA依赖的转录调节Regulation of transcription, DNA-dependent | 4.40E-07 | |
| Darkorange2 | GO: 0015267 | MF | 通道活性Channel activity | 0.00068 | |
| Darkorange2 | GO: 0022838 | MF | 底物特异性通道活性Substrate-specific channel activity | 0.00068 | |
| Blue | GO: 0009628 | BP | 非生物刺激的反应Response to abiotic stimulus | 3.60E-10 | |
| Blue | GO: 0009416 | BP | 光刺激响应Response to light stimulus | 1.60E-08 | |
| Blue | GO: 0003700 | MF | 转录因子活性Transcription factor activity | 0.00017 | |
| Blue | GO: 0009535 | CC | 叶绿体类囊体膜Chloroplast thylakoid membrane | 0.00022 | |
| Darkred | GO: 0051186 | BP | 辅因子代谢过程Cofactor metabolic process | 1.20E-19 | |
| Darkred | GO: 0004252 | MF | 丝氨酸型肽链内切酶活性Serine-type endopeptidase activity | 0.00015 | |
| Darkred | GO: 0009543 | CC | 叶绿体类囊体腔 Chloroplast thylakoid lumen | 4.40E-13 | |
| Darkslateblue | GO: 0016051 | BP | 碳水化合物生物合成过程Carbohydrate biosynthetic process | 5.60E-05 | |
| Darkslateblue | GO: 0016830 | MF | 碳-碳裂解酶活性Carbon-carbon lyase activity | 3.40E-06 | |
| Darkslateblue | GO: 0042651 | CC | 类囊体膜Thylakoid membrane | 0.00013 | |
| Turquoise | GO: 0060560 | BP | 形态发生发育Developmental growth involved in morphogenesis | 1.70E-11 | |
| Turquoise | GO: 0015299 | MF | 溶质: 氢反向转运蛋白活性Solute: hydrogen antiporter activity | 4.60E-05 | |
| Turquoise | GO: 0031224 | CC | 内膜Intrinsic to membrane | 8.50E-06 | |
| Darkmagenta | GO: 0010927 | BP | 涉及形态发生的内膜组装 Cellular component assembly involved in morphogenesis | 4.10E-09 | |
| Darkmagenta | GO: 0004553 | MF | 水解酶活性, 水解O-糖基化合物 Hydrolase activity, hydrolyzing O-glycosyl compounds | 7.60E-06 | |
| Darkmagenta | GO: 0030312 | CC | 高尔基体Golgi apparatus | 0.0004 | |
| Bisque4 | GO: 0042180 | BP | 细胞酮代谢过程Cellular ketone metabolic process | 3.00E-08 | |
| Bisque4 | GO: 0044281 | BP | 小分子代谢过程Small molecule metabolic process | 9.90E-06 | |
| Bisque4 | GO: 0042221 | BP | 相应化学刺激Response to chemical stimulus | 0.00032 | |
| Darkgrey | GO: 0010033 | BP | 对有机物质的反应Response to organic substance | 1.60E-07 | |
| Darkgrey | GO: 0004553 | MF | 水解酶活性, 水解O-糖基化合物 Hydrolase activity, hydrolyzing O-glycosyl compounds | 4.40E-10 | |
| Darkgrey | GO: 0005740 | CC | 线粒体包膜Mitochondrial envelope | 7.40E-05 | |
| Floralwhite | GO: 0006412 | BP | 蛋白质翻译Translation | 9.10E-07 | |
| Floralwhite | GO: 0005198 | MF | 结构分子活性Structural molecule activity | 5.80E-08 | |
| Floralwhite | GO: 0043227 | CC | 膜有界细胞器Membrane-bounded organelle | 0.0085 | |
| Darkolivegreen | GO: 0010022 | BP | 分生组织决定Meristem determinacy | 6.10E-07 | |
| 模块 Module | GO条目 GO term | 本体 Ontology | 描述 Description | P值 P-value | |
| Darkolivegreen | GO: 0003700 | MF | 转录因子活性Transcription factor activity | 5.50E-05 | |
| Orange | GO: 0042542 | BP | 过氧化氢反应Response to hydrogen peroxide | 2.90E-05 | |
| Orange | GO: 0009526 | CC | 质体Plastid | 9.60E-09 | |
| Yellow | GO: 0009605 | BP | 响应外界刺激Response to external stimulus | 8.40E-10 | |
| Yellow | GO: 0022892 | MF | 底物特异性转运体活性Substrate-specific transporter activity | 0.00013 | |
| Plum2 | GO: 0048437 | BP | 花器官发育Floral organ development | 9.20E-05 | |
| Plum2 | GO: 0005576 | CC | 胞外区Extracellular region | 9.70E-05 | |
| Greenyellow | GO: 0034220 | BP | 离子跨膜转运Ion transmembrane transport | 5.00E-13 | |
| Greenyellow | GO: 0032561 | MF | 鸟苷酸核糖核酸结合Guanyl ribonucleotide binding | 2.40E-10 | |
| Greenyellow | GO: 0043231 | CC | 内细胞器膜Organelle inner membrane | 1.20E-17 | |
新窗口打开|下载CSV
本研究重点关注了开花这个重要的农艺性状。开花作为玉米生命活动的中心环节, 对其遗传机制的解析虽然取得了一定的进展, 例如通过数量性状位点定位和关联分析等方法鉴定了许多重要的开花基因, 但是这些研究手段都有一定的局限性, 例如数量性状定位不能反映参考群体较为广泛的遗传异质性[37], 此外, 许多复杂的农艺性状是一个与群体结构存在高度相关的性状, 例如开花, 而且利用关联分析鉴定控制目标性状相关的调控基因容易受到群体结构的影响[38]。权重基因共表达网络则通过共表达模块化处理, 将成千上万的基因分配到模块中, 通过研究模块蕴含的生物学意义进一步挖掘相应基因的功能, 因此较好地解决了对复杂性状解析能力不足的问题, 被广泛地应用于基因组学的研究之中。
在本研究中的富集分析结果中, 8个组织特异性模块包含开花的调控通 (图6), 例如Blue模块中的响应光刺激调控通 (GO:0009416), Darkolivegreen模块中的顶端分生组织形态维持(GO:0010022)和Plum2模块的花器官发育(GO:0048437)。此外, 结合已经报道过的开花基因, 进一步发现Blue模块和Darkmagenta模块含有较多开花相关的调控基因, 而且这些开花基因的连通性在模块中很高, 处于枢纽地位, 例如Blue模块中的ZCN8和ZCN7基因是开花激活因子, Darkmagenta模块中的GIGZ1A和GIGZ1B基因, 是时钟通 的重要参与基因。通过对模块中基因的局部网络化, 挖掘到了与开花基因连接程度较高的基因, 这些基因可以作为开花候选基因被进一步研究。例如在Blue模块中, 与ZCN8高连通性的基因GRMZM2G450273, 其在拟南芥中的同源基因是FPF1, FPF1基因编码一个调节开花的小蛋白质, 并且参与赤霉素调控通 , 在光照诱导后该基因在顶端分生组织表达, ZCN7的高连接度基因GRMZM2G455413在拟南芥中的同源基因是PSBA, 通过功能注释发现这个基因编码叶绿素结合蛋白D1, 属于光系统II反应中心, 参与光周期调控通 。在Darkmagenta模块中, ZmPRR59的高连接度基因是GRMZM2G106363, 其在拟南芥中的同源基因是LKP2, 该基因编码一个F-box蛋白, 响应光照刺激, 参与光周期途径; GRMZM2G104269是GIGZ1A的高连接度基因, 该基因在拟南芥中的同源基因是OASC, 主要参与花粉管生长和受精。以上结果表明, 在WGCNA中, 与目标基因存在高连通性的基因具有与其相似的生物学意义, 这可以为挖掘目标基因提供新的研究思 。在本研究中, 重点关注了Blue和Darkmagenta两个开花相关的调控模块, 其余6个开花相关的基因模块虽然没有被详细的论述, 但是其包含开花富集通 , 可进一步挖掘其蕴含的生物学意义。
本研究鉴定到的组织特异性模块对应的组织都是玉米开花调控和发育的重要参与器官, 因此, 利用共表达网络解析具体的农艺性状, 分析模块的生物功能, 挖掘模块中的目标基因, 将为解析复杂的农艺性状提供重要的参考依据。
4 结论
构建了与性状相关联的权重基因共表达网络, 得到了14个组织特异性模块。揭示了组织特异性模块蕴含的生物学意义, 鉴定了开花相关的调控基因, 并用其构建了局部的具有生物学意义的网络。本研究结果可为后续解析玉米发育的遗传机理提供重要的实验数据和理论基础。参考文献 原文顺序
文献年度倒序
文中引用次数倒序
被引期刊影响因子
DOI:10.1126/science.1087447URL [本文引用: 1]
DOI:10.1038/35075138URLPMID:11333967 [本文引用: 1]

In this paper we present the first mathematical analysis of the protein interaction network found in the yeast, S. cerevisiae. We show that, (a) the identified protein network display a characteristic scale-free topology that demonstrate striking similarity to the inherent organization of metabolic networks in particular, and to that of robust and error-tolerant networks in general. (b) the likelihood that deletion of an individual gene product will prove lethal for the yeast cell clearly correlates with the number of interactions the protein has, meaning that highly-connected proteins are more likely to prove essential than proteins with low number of links to other proteins. These results suggest that a scale-free architecture is a generic property of cellular networks attributable to universal self-organizing principles of robust and error-tolerant networks and that will likely to represent a generic topology for protein-protein interactions.Jeong, H; Mason, S P; Barab si, A L; Oltvai, Z N
DOI:10.1186/1752-0509-1-5URLPMID:17408512 [本文引用: 1]
pAbstract/p pBackground/p pOne central goal of computational systems biology is the mathematical modelling of complex metabolic reaction networks. The first and most time-consuming step in the development of such models consists in the stoichiometric reconstruction of the network, i. e. compilation of all metabolites, reactions and transport processes relevant to the considered network and their assignment to the various cellular compartments. Therefore an information system is required to collect and manage data from different databases and scientific literature in order to generate a metabolic network of biochemical reactions that can be subjected to further computational analyses./p pResults/p pThe computer program METANNOGEN facilitates the reconstruction of metabolic networks. It uses the well-known database of biochemical reactions KEGG of biochemical reactions as primary information source from which biochemical reactions relevant to the considered network can be selected, edited and stored in a separate, user-defined database. Reactions not contained in KEGG can be entered manually into the system. To aid the decision whether or not a reaction selected from KEGG belongs to the considered network METANNOGEN contains information of SWISSPROT and ENSEMBL and provides Web links to a number of important information sources like METACYC, BRENDA, NIST, and REACTOME. If a reaction is reported to occur in more than one cellular compartment, a corresponding number of reactions is generated each referring to one specific compartment. Transport processes of metabolites are entered like chemical reactions where reactants and products have different compartment attributes. The list of compartmentalized biochemical reactions and membrane transport processes compiled by means of METANNOGEN can be exported as an SBML file for further computational analysis. METANNOGEN is highly customizable with respect to the content of the SBML output file, additional data-fields, the graphical input form, highlighting of project specific search terms and dynamically generated Web-links./p pConclusion/p pMETANNOGEN is a flexible tool to manage information for the design of metabolic networks. The program requires Java Runtime Environment 1.4 or higher and about 100 MB of free RAM and about 200 MB of free HD space. It does not require installation and can be directly Java-webstarted from urlhttp://3d-alignment.eu/metannogen//url./p
DOI:10.1038/nrg1272URL [本文引用: 2]
DOI:10.1101/gr.217463.116URLPMID:28687705 [本文引用: 1]
An international, peer-reviewed genome sciences journal featuring outstanding original research that offers novel insights into the biology of all organisms
DOI:10.7554/eLife.29655URLPMID:5628015 [本文引用: 1]
10.7554/eLife.29655.001The dynamics of local climates make development of agricultural strategies challenging. Yield improvement has progressed slowly, especially in drought-prone regions where annual crop production suffers from episodic aridity. Underlying drought responses are circadian and diel control of gene expression that regulate daily variations in metabolic and physiological pathways. To identify transcriptomic changes that occur in the crop Brassica rapa during initial perception of drought, we applied a co-expression network approach to associate rhythmic gene expression changes with physiological responses. Coupled analysis of transcriptome and physiological parameters over a two-day time course in control and drought-stressed plants provided temporal resolution necessary for correlation of network modules with dynamic changes in stomatal conductance, photosynthetic rate, and photosystem II efficiency. This approach enabled the identification of drought-responsive genes based on their differential rhythmic expression profiles in well-watered versus droughted networks and provided new insights into the dynamic physiological changes that occur during drought.
DOI:10.1104/pp.114.237529URLPMID:24828307 [本文引用: 1]
Flowers are reproductive organs and precursors to fruits and seeds. While the basic tenets of the ABCE model of flower development are conserved in angiosperms, different flowering plants exhibit different and sometimes unique characteristics. A distinct feature of strawberry (Fragaria spp.) flowers is the development of several hundreds of individual apocarpous (unfused) carpels. These individual carpels are arranged in a spiral pattern on the subtending stem tip, the receptacle. Therefore, the receptacle is an integral part of the strawberry flower and is of significant agronomic importance, being the precursor to strawberry fruit. Taking advantage of next-generation sequencing and laser capture microdissection, we generated different tissue- and stage-transcriptomic profiling of woodland strawberry (Fragaria vesca) flower development. Using pairwise comparisons and weighted gene coexpression network analysis, we identified modules of coexpressed genes and hub genes of tissue-specific networks. Of particular importance is the discovery of a developing receptacle-specific module exhibiting similar molecular features to those of young floral meristems. The strawberry homologs of a number of meristem regulators, including LOST MERISTEM and WUSCHEL, are identified as hub genes operating in the developing receptacle network. Furthermore, almost 25% of the F-box genes in the genome are transiently induced in developing anthers at the meiosis stage, indicating active protein degradation. Together, this work provides important insights into the molecular networks underlying strawberry unique reproductive developmental processes. This extensive floral transcriptome data set is publicly available and can be readily queried at the project Web site, serving as an important genomic resource for the plant biology research community.
DOI:10.1017/S0016672399004012URLPMID:10511573 [本文引用: 1]
Quantitative trait locus (QTL) mapping has detected two linked QTL in the 8L chromosome arm segment introgressed from Gasp Flint (a Northern Flint open-pollinated population) into the background of N28 (a Corn Belt Dent inbred line). Homozygous recombinant lines, with a variable length of the introgressed segment, confirmed the presence of the two previously identified, linked QTL. In the N28 background, Gasp Flint QTL alleles at both loci induce a reduction in node number, height, and days to anthesis (pollen shed). Given the determinate growth pattern of maize, the phenotypic effects indicate that the two QTL are involved in the transition of the apical meristem from vegetative to generative structures. Relative to the effects of the two QTL in the background of N28, we distinguish two general developmental factors affecting the timing of pollen shed. The primary factor is the timing of the transition of the apical meristem. The second, derivative factor is the global extent of internode elongation. Having separated the two linked QTL, we have laid the foundation for the positional cloning of the QTL with a larger effect.
[本文引用: 1]
DOI:10.1104/pp.106.088815URLPMID:17071646 [本文引用: 1]
Separation of the life cycle of flowering plants into two distinct growth phases, vegetative and reproductive, is marked by the floral transition. The initial floral inductive signals are perceived in the leaves and transmitted to the shoot apex, where the vegetative shoot apical meristem is restructured into a reproductive meristem. In this study, we report cloning and characterization of the maize (Zea mays) flowering time gene delayed flowering1 (dlf1). Loss of dlf1 function results in late flowering, indicating dlf1 is required for timely promotion of the floral transition. dlf1 encodes a protein with a basic leucine zipper domain belonging to an evolutionarily conserved family. Three-dimensional protein modeling of a missense mutation within the basic domain suggests DLF1 protein functions through DNA binding. The spatial and temporal expression pattern of dlf1 indicates a threshold level of dlf1 is required in the shoot apex for proper timing of the floral transition. Double mutant analysis of dlf1 and indeterminate1 (id1), another late flowering mutation, places dlf1 downstream of id1 function and suggests dlf1 mediates floral inductive signals transmitted from leaves to the shoot apex. This study establishes an emergent framework for the genetic control of floral induction in maize and highlights the conserved topology of the floral transition network in flowering plants.
DOI:10.1534/genetics.109.110304URL [本文引用: 1]
Variation in maize for response to photoperiod is related to geographical adaptation in the species. Maize possesses homologs of many genes identified as regulators of flowering time in other species, but their relation to the natural variation for photoperiod response in maize is unknown. Candidate gene sequences were mapped in four populations created by crossing two temperate inbred lines to two photoperiod-sensitive tropical inbreds. Whole-genome scans were conducted by high-density genotyping of the populations, which were phenotyped over 3 years in both short- and long-day environments. Joint multiple population analysis identified genomic regions controlling photoperiod responses in flowering time, plant height, and total leaf number. Four key genome regions controlling photoperiod response across populations were identified, referred to as ZmPR1 4. Functional allelic differences within these regions among phenotypically similar founders suggest distinct evolutionary trajectories for photoperiod adaptation in maize. These regions encompass candidate genes CCA/LHY, CONZ1, CRY2, ELF4, GHD7, VGT1, HY1/SE5, TOC1/PRR7/PPD-1, PIF3, ZCN8, and ZCN19.
DOI:10.1111/j.1365-313X.2011.04527.xURLPMID:21299659 [本文引用: 1]
Maize is an important model species and a major constituent of human and animal diets. It has also emerged as a potential feedstock and model system for bioenergy research due to recent worldwide interest in developing plant biomass-based, carbon-neutral liquid fuels. To understand how the underlying genome sequence results in specific plant phenotypes, information on the temporal and spatial transcription patterns of genes is crucial. Here we present a comprehensive atlas of global transcription profiles across developmental stages and plant organs. We used a NimbleGen microarray containing 80 301 probe sets to profile transcription patterns in 60 distinct tissues representing 11 major organ systems of inbred line B73. Of the 30 892 probe sets representing the filtered B73 gene models, 91.4% were expressed in at least one tissue. Interestingly, 44.5% of the probe sets were expressed in all tissues, indicating a substantial overlap of gene expression among plant organs. Clustering of maize tissues based on global gene expression profiles resulted in formation of groups of biologically related tissues. We utilized this dataset to examine the expression of genes that encode enzymes in the lignin biosynthetic pathway, and found that expansion of distinct gene families was accompanied by divergent, tissue-specific transcription patterns of the paralogs. This comprehensive expression atlas represents a valuable resource for gene discovery and functional characterization in maize.
DOI:10.4137/CIN.S14022URLPMID:4214596 [本文引用: 1]
QuaCRS (QualityControl forRNA-Seq) is an integrated, simplified quality control (QC) system for RNA-seq data that allows easy execution of several open-source QC tools, aggregation of their output, and the ability to quickly identify quality issues by performing meta-analyses on QC metrics across large numbers of samples in different studies. It comprises two main sections. First is the QC Pack wrapper, which executes three QC tools: FastQC, RNA-SeQC, and selected functions from RSeQC. Combining these three tools into one wrapper provides increased ease of use and provides a much more complete view of sample data quality than any individual tool. Second is the QC database, which displays the resulting metrics in a user-friendly web interface. It was designed to allow users with less computational experience to easily generate and view QC information for their data, to investigate individual samples and aggregate reports of sample groups, and to sort and search samples based on quality. The structure of the QuaCRS database is designed to enable expansion with additional tools and metrics in the future. The source code for not-for-profit use and a fully functional sample user interface with mock data are available athttp://bioserv.mps.ohio-state.edu/QuaCRS/.
DOI:10.1038/nprot.2016.095URLPMID:27560171 [本文引用: 1]
Abstract High-throughput sequencing of mRNA (RNA-seq) has become the standard method for measuring and comparing the levels of gene expression in a wide variety of species and conditions. RNA-seq experiments generate very large, complex data sets that demand fast, accurate and flexible software to reduce the raw read data to comprehensible results. HISAT (hierarchical indexing for spliced alignment of transcripts), StringTie and Ballgown are free, open-source software tools for comprehensive analysis of RNA-seq experiments. Together, they allow scientists to align reads to a genome, assemble transcripts including novel splice variants, compute the abundance of these transcripts in each sample and compare experiments to identify differentially expressed genes and transcripts. This protocol describes all the steps necessary to process a large set of raw sequencing reads and create lists of gene transcripts, expression levels, and differentially expressed genes and transcripts. The protocol's execution time depends on the computing resources, but it typically takes under 45 min of computer time. HISAT, StringTie and Ballgown are available from http://ccb.jhu.edu/software.shtml.
URL [本文引用: 1]
URL [本文引用: 1]
DOI:10.3969/j.issn.1674-7968.2015.09.001URL [本文引用: 2]
Co-expression analysis is an important approach to explore the genes responsible for different traits in large biological data set. In this study, we calculated the expression abundance of genes in 10 different tissues of cucumber (Cucumis sativus L.) using RNA-Seq data and removed the genes whose maximal fragments per kilobase of exon per million fragments mapped (FPKM) values were less than 5 across 10 different tissues. Then, co-expression modules were detected according to the correlation and TO (Topological Overlap) value between genes by applying WGCNA package in R project. Finally, 1 134 modules were obtained including 16 924 genes, of which 839 modules were selected for their mean correlation coefficients more than 0.9, getting 11 844 genes in total. The great functional and morphological variation in plant tissue types arises from the differential regulation of a finite set of genomic transcripts. The relationship analysis between modules and tissue types found 323 tissue-correlated modules including 5 784 genes. These modules highly correlated with tissues (r 0.65). Using the topGO package in R project, we identified Gene Ontology (GO) terms that appeared in modules more frequently than expected. Nine of the 10 tissues had correlated-modules highly enriched in GO biological processes respectively (Fisher's exact test, P 0.000 1), except tendril. GO enrichment analysis (Fisher's exact test, P 0.000 1) of tissue-specific modules showed some specific genes were related to different tissues. The overrepresented GO biological processes in tissue-specific modules was often consistent with known tissue attributes. Positional clusters were also found in the modules with size ranging from 2 to 5 genes, most of which contained 2 genes. The physical distance between clustered genes in one module on the chromosome was less than 25 kb. The clustered genes often had similar structure or function. As an example, we got 3 modules in leaf and 1 module in stem correlated to the biosynthesis pathway of cucurbitacin, and 10 genes were published in previous research. These 4 modules were enriched in the biological process of terpenoid and isoprenoid which were the precursors of cucurbitacin. We also found that module M107 collected most of genes (7/10) associated with biosynthesis pathway of cucurbitacin which were in 2 clusters, which indicated that genes having similar function were often adjacently located on the chromosome. This study identified some important co-expression modules in cucumber through transcriptome and network analysis and provided a reference for similar studies in the future.
DOI:10.1093/nar/gki475URLPMID:15980575 [本文引用: 1]
Abstract High-throughput technologies have led to the rapid generation of large-scale datasets about genes and gene products. These technologies have also shifted our research focus from 'single genes' to 'gene sets'. We have developed a web-based integrated data mining system, WebGestalt (http://genereg.ornl.gov/webgestalt/), to help biologists in exploring large sets of genes. WebGestalt is composed of four modules: gene set management, information retrieval, organization/visualization, and statistics. The management module uploads, saves, retrieves and deletes gene sets, as well as performs Boolean operations to generate the unions, intersections or differences between different gene sets. The information retrieval module currently retrieves information for up to 20 attributes for all genes in a gene set. The organization/visualization module organizes and visualizes gene sets in various biological contexts, including Gene Ontology, tissue expression pattern, chromosome distribution, metabolic and signaling pathways, protein domain information and publications. The statistics module recommends and performs statistical tests to suggest biological areas that are important to a gene set and warrant further investigation. In order to demonstrate the use of WebGestalt, we have generated 48 gene sets with genes over-represented in various human tissue types. Exploration of all the 48 gene sets using WebGestalt is available for the public at http://genereg.ornl.gov/webgestalt/wg_enrich.php.
DOI:10.1186/1471-2105-9-559URLPMID:19114008 [本文引用: 1]
Correlation networks are increasingly being used in bioinformatics applications. For example, weighted gene co-expression network analysis is a systems biology method for describing the correlation patterns among genes across microarray samples. Weighted correlation network analysis (WGCNA) can be used for finding clusters (modules) of highly correlated genes, for summarizing such clusters using the module eigengene or an intramodular hub gene, for relating modules to one another and to external sample traits (using eigengene network methodology), and for calculating module membership measures. Correlation networks facilitate network based gene screening methods that can be used to identify candidate biomarkers or therapeutic targets. These methods have been successfully applied in various biological contexts, e.g. cancer, mouse genetics, yeast genetics, and analysis of brain imaging data. While parts of the correlation network methodology have been described in separate publications, there is a need to provide a user-friendly, comprehensive, and consistent software implementation and an accompanying tutorial. The WGCNA R software package is a comprehensive collection of R functions for performing various aspects of weighted correlation network analysis. The package includes functions for network construction, module detection, gene selection, calculations of topological properties, data simulation, visualization, and interfacing with external software. Along with the R package we also present R software tutorials. While the methods development was motivated by gene expression data, the underlying data mining approach can be applied to a variety of different settings. The WGCNA package provides R functions for weighted correlation network analysis, e.g. co-expression network analysis of gene expression data. The R package along with its source code and additional material are freely available at http://www.genetics.ucla.edu/labs/horvath/CoexpressionNetwork/Rpackages/WGCNA .
DOI:10.1104/pp.112.213231URLPMID:23388120 [本文引用: 1]
Here, we present a genome-wide overview of transcriptional circuits in the agriculturally significant crop species maize (Zea mays). We examined transcript abundance data at 50 developmental stages, from embryogenesis to senescence, for 34,876 gene models and classified genes into 24 robust coexpression modules. Modules were strongly associated with tissue types and related biological processes. Sixteen of the 24 modules (67%) have preferential transcript abundance within specific tissues. One-third of modules had an absence of gene expression in specific tissues. Genes within a number of modules also correlated with the developmental age of tissues. Coexpression of genes is likely due to transcriptional control. For a number of modules, key genes involved in transcriptional control have expression profiles that mimic the expression profiles of module genes, although the expression of transcriptional control genes is not unusually representative of module gene expression. Known regulatory motifs are enriched in several modules. Finally, of the 13 network modules with more than 200 genes, three contain genes that are notably clustered (P < 0.05) within the genome. This work, based on a carefully selected set of major tissues representing diverse stages of maize development, demonstrates the remarkable power of transcript-level coexpression networks to identify underlying biological processes and their molecular components.
DOI:10.1093/nar/gkq310URLPMID:20435677 [本文引用: 1]
Gene Ontology (GO), the de facto standard in gene functionality description, is used widely in functional annotation and enrichment analysis. Here, we introduce agriGO, an integrated web-based GO analysis toolkit for the agricultural community, using the advantages of our previous GO enrichment tool (EasyGO), to meet analysis demands from new technologies and research objectives. EasyGO is valuable for its proficiency, and has proved useful in uncovering biological knowledge in massive data sets from high-throughput experiments. For agriGO, the system architecture and website interface were redesigned to improve performance and accessibility. The supported organisms and gene identifiers were substantially expanded (including 38 agricultural species composed of 274 data types). The requirement on user input is more flexible, in that user-defined reference and annotation are accepted. Moreover, a new analysis approach using Gene Set Enrichment Analysis strategy and customizable features is provided. Four tools, SEA (Singular enrichment analysis), PAGE (Parametric Analysis of Gene set Enrichment), BLAST4ID (Transfer IDs by BLAST) and SEACOMPARE (Cross comparison of SEA), are integrated as a toolkit to meet different demands. We also provide a cross-comparison service so that different data sets can be compared and explored in a visualized way. Lastly, agriGO functions as a GO data repository with search and download functions; agriGO is publicly accessible at http://bioinfo.cau.edu.cn/agriGO/.
DOI:10.1371/journal.pone.0043450URLPMID:3422250 [本文引用: 1]
The transition from the vegetative to reproductive development is a critical event in the plant life cycle. The accurate prediction of flowering time in elite germplasm is important for decisions in maize breeding programs and best agronomic practices. The understanding of the genetic control of flowering time in maize has significantly advanced in the past decade. Through comparative genomics, mutant analysis, genetic analysis and QTL cloning, and transgenic approaches, more than 30 flowering time candidate genes in maize have been revealed and the relationships among these genes have been partially uncovered. Based on the knowledge of the flowering time candidate genes, a conceptual gene regulatory network model for the genetic control of flowering time in maize is proposed. To demonstrate the potential of the proposed gene regulatory network model, a first attempt was made to develop a dynamic gene network model to predict flowering time of maize genotypes varying for specific genes. The dynamic gene network model is composed of four genes and was built on the basis of gene expression dynamics of the two late floweringid1anddlf1mutants, the early flowering landrace Gaspe Flint and the temperate inbred B73. The model was evaluated against the phenotypic data of theid1 dlf1double mutant and theZMM4overexpressed transgenic lines. The model provides a working example that leverages knowledge from model organisms for the utilization of maize genomic information to predict a whole plant trait phenotype, flowering time, of maize genotypes.
DOI:10.1101/gr.1239303URL [本文引用: 1]
DOI:10.1104/pp.15.00535URLPMID:26084920 [本文引用: 1]
Abstract The activity of the maize (Zea mays) florigen gene ZEA CENTRORADIALIS8 (ZCN8) is associated with the floral transition in both day-neutral temperate maize and short-day (SD)-requiring tropical maize. We analyzed transcription and chromatin modifications at the ZCN8 locus and its nearly identical paralog ZCN7 during the floral transition. This analysis was performed with day-neutral maize (Zea mays ssp. mays), where flowering is promoted almost exclusively via the autonomous pathway through the activity of the regulatory gene indeterminate1 (id1), and tropical teosinte (Zea mays ssp. parviglumis) under floral inductive and noninductive photoperiods. Comparison of ZCN7/ZCN8 histone modification profiles in immature leaves of nonflowering id1 mutants and teosinte grown under floral inhibitory photoperiods reveals that both id1 floral inductive activity and SD-mediated induction result in histone modification patterns that are compatible with the formation of transcriptionally competent chromatin environments. Specific histone modifications are maintained during leaf development and may represent a chromatin signature that favors the production of processed ZCN7/ZCN8 messenger RNA in florigen-producing mature leaf. However, whereas id1 function promotes histone H3 hyperacetylation, SD induction is associated with increased histone H3 dimethylation and trimethylation at lysine-4. In addition, id1 and SD differently affect the production of ZCN7/ZCN8 antisense transcript. These observations suggest that distinct mechanisms distinguish florigen regulation in response to autonomous and photoperiod pathways. Finally, the identical expression and histone modification profiles of ZCN7 and ZCN8 in response to floral induction suggest that ZCN7 may represent a second maize florigen. 2015 American Society of Plant Biologists. All Rights Reserved.
DOI:10.1186/1471-2229-10-126URLPMID:3095283 [本文引用: 1]
pAbstract/p pBackground/p pThe plant circadian clock orchestrates 24-hour rhythms in internal physiological processes to coordinate these activities with daily and seasonal changes in the environment. The circadian clock has a profound impact on many aspects of plant growth and development, including biomass accumulation and flowering time. Despite recent advances in understanding the circadian system of the model plant itArabidopsis thaliana/it, the contribution of the circadian oscillator to important agronomic traits in itZea mays /itand other cereals remains poorly defined. To address this deficit, this study investigated the transcriptional landscape of the maize circadian system./p pResults/p pSince transcriptional regulation is a fundamental aspect of circadian systems, genes exhibiting circadian expression were identified in the sequenced maize inbred B73. Of the over 13,000 transcripts examined, approximately 10 percent displayed circadian expression patterns. The majority of cycling genes had peak expression at subjective dawn and dusk, similar to other plant circadian systems. The maize circadian clock organized co-regulation of genes participating in fundamental physiological processes, including photosynthesis, carbohydrate metabolism, cell wall biogenesis, and phytohormone biosynthesis pathways./p pConclusions/p pCircadian regulation of the maize genome was widespread and key genes in several major metabolic pathways had circadian expression waveforms. The maize circadian clock coordinated transcription to be coincident with oncoming day or night, which was consistent with the circadian oscillator acting to prepare the plant for these major recurring environmental changes. These findings highlighted the multiple processes in maize plants under circadian regulation and, as a result, provided insight into the important contribution this regulatory system makes to agronomic traits in maize and potentially other C4 plant species./p
DOI:10.1111/j.1365-313X.2006.02962.xURLPMID:17181778 [本文引用: 1]
Phytochromes are the primary red/far-red photoreceptors of higher plants, mediating numerous developmental processes throughout the life cycle, from germination to flowering. In seed plants, phytochromes are encoded by a small gene family with each member performing both distinct and redundant roles in mediating physiological responses to light cues. Studies in both eudicot and monocot species have defined a central role for phytochrome B in mediating responses to light in the control of several agronomically important traits, including plant height, transitions to flowering and axillary branch meristem development. Here we characterize Mutator -induced alleles of PhyB1 and a naturally occurring deletion allele of PhyB2 in Zea mays (maize). Using single and double mutants, we show that the highly similar PhyB1 and PhyB2 genes encode proteins with both overlapping and non-redundant functions that control seedling and mature plant traits. PHYB1 and PHYB2 regulate elongation of sheath and stem tissues of mature plants and contribute to the light-mediated regulation of PhyA and Cab gene transcripts. However, PHYB1 and not PHYB2 contributes significantly to the inhibition of mesocotyl elongation under red light, whereas PHYB2 and to a lesser extent PHYB1 mediate the photoperiod-dependent floral transition. This sub functionalization of PHYB activities in maize has probably occurred since the tetraploidization of maize, and may contribute to flowering time variation in modern-day varieties.
DOI:10.1038/90135URLPMID:11431702 [本文引用: 1]
Abstract Historically, association tests have been used extensively in medical genetics, but have had virtually no application in plant genetics. One obstacle to their application is the structured populations often found in crop plants, which may lead to nonfunctional, spurious associations. In this study, statistical methods to account for population structure were extended for use with quantitative variation and applied to our evaluation of maize flowering time. Mutagenesis and quantitative trait locus (QTL) studies suggested that the maize gene Dwarf8 might affect the quantitative variation of maize flowering time and plant height. The wheat orthologs of this gene contributed to the increased yields seen in the 'Green Revolution' varieties. We used association approaches to evaluate Dwarf8 sequence polymorphisms from 92 maize inbred lines. Population structure was estimated using a Bayesian analysis of 141 simple sequence repeat (SSR) loci. Our results indicate that a suite of polymorphisms associate with differences in flowering time, which include a deletion that may alter a key domain in the coding region. The distribution of nonsynonymous polymorphisms suggests that Dwarf8 has been a target of selection.
DOI:10.1371/journal.pgen.1003246URLPMID:23437002 [本文引用: 1]
Abstract The strengths of association mapping lie in its resolution and allelic richness, but spurious associations arising from historical relationships and selection patterns need to be accounted for in statistical analyses. Here we reanalyze one of the first generation structured association mapping studies of the Dwarf8 (d8) locus with flowering time in maize using the full range of new mapping populations, statistical approaches, and haplotype maps. Because this trait was highly correlated with population structure, we found that basic structured association methods overestimate phenotypic effects in the region, while mixed model approaches perform substantially better. Combined with analysis of the maize nested association mapping population (a multi-family crossing design), it is concluded that most, if not all, of the QTL effects at the general location of the d8 locus are from rare extended haplotypes that include other linked QTLs and that d8 is unlikely to be involved in controlling flowering time in maize. Previous independent studies have shown evidence for selection at the d8 locus. Based on the evidence of population bottleneck, selection patterns, and haplotype structure observed in the region, we suggest that multiple traits may be strongly correlated with population structure and that selection on these traits has influenced segregation patterns in the region. Overall, this study provides insight into how modern association and linkage mapping, combined with haplotype analysis, can produce results that are more robust.
DOI:10.1093/pcp/pcq153URLPMID:20937610 [本文引用: 1]
DELLA proteins are nuclear-localized negative regulators of gibberellin signaling found ubiquitously throughout higher plants. Dominant dwarfing mutations of DELLA proteins have been primarily responsible for the dramatic increases in harvest index of the 'green revolution'. Maize contains two genetic loci encoding DELLA proteins, dwarf plant8 (d8) and dwarf plant 9 (d9). The d8 gene and three of its dominant dwarfing alleles have been previously characterized at the molecular level. Almost 20 years after the initial description of the mutant, this investigation represents the first molecular characterization of d9 and its gibberellin-insensitive mutant, D9-1. We have molecularly, subcellularly and phenotypically characterized the gene products of five maize DELLA alleles in transgenic Arabidopsis. In dissecting the molecular differences in D9-1, a critical residue for normal DELLA function has been uncovered, corresponding to E600 of the D9 protein. The gibberellin-insensitive D9-1 was found to produce dwarfing and, notably, earlier flowering in Arabidopsis. Conversely, overexpression of the D9-1 allele delayed flowering in transgenic maize, while overexpression of the d9 allele led to earlier flowering. These results corroborate findings that DELLA proteins are at the crux of many plant developmental pathways and suggest differing mechanisms of flowering time control by DELLAs in maize and Arabidopsis.
[本文引用: 1]
DOI:10.1007/s00425-008-0709-1URLPMID:18301915 [本文引用: 2]
Maize (Zea mays ssp. mays L.) was domesticated from teosinte (Z. mays L. ssp. parviglumis Iltis & Doebley), a plant requiring short day photoperiods to flower. While photoperiod sensitive landraces of maize exist, post-domestication breeding included efforts to grow maize in a broad range of latitudes. Thus, modern maize is often characterized as day-neutral because time to flower is relatively unaffected by photoperiod. We report the first identification of maize constans of Zea mays1 (conz1), a gene with extensive sequence homology to photoperiod genes CONSTANS (CO) in Arabidopsis (Arabidopsis thaliana (L.) Heynh.) and Heading date1 (Hd1) in rice (Oryza sativa L.). conz1 maps to a syntenous chromosomal location relative to Hd1. Additionally, conz1 and two maize homologs of another photoperiod gene exhibit diurnal expression patterns notably similar to their Arabidopsis and rice homologs. The expression pattern of conz1 in long days is distinct from that observed in short days, suggesting that maize is able to discern variations in photoperiod and respond with differential expression of conz1. We offer models to reconcile the differential expression of conz1 with respect to the photoperiod insensitivity exhibited by temperate inbreds.
DOI:10.1534/genetics.103.026096URLPMID:15280251 [本文引用: 1]
To begin the study of phytochrome signaling in maize, we have cloned and characterized the phytochrome gene family from the inbred B73. Through DNA gel blot analysis of maize genomic DNA and BAC library screens, we show that the PhyA, PhyB, and PhyC genes are each duplicated once in the genome of maize. Each gene pair was positioned to homeologous regions of the genome using recombinant inbred mapping populations. These results strongly suggest that the duplication of the phytochrome gene family in maize arose as a consequence of an ancient tetraploidization in the maize ancestral lineage. Furthermore, sequencing of Phy genes directly from BAC clones indicates that there are six functional phytochrome genes in maize. Through Northern gel blot analysis and a semiquantitative reverse transcriptase polymerase chain reaction assay, we determined that all six phytochrome genes are transcribed in several seedling tissues. However, expression from PhyA1, PhyB1, and PhyC1 predominate in all seedling tissues examined. Dark-grown seedlings express higher levels of PhyA and PhyB than do light-grown plants but PhyC genes are expressed at similar levels under light and dark growth conditions. These results are discussed in relation to phytochrome gene regulation in model eudicots and monocots and in light of current genome sequencing efforts in maize.
DOI:10.1371/journal.pone.0012887URLPMID:20886102 [本文引用: 2]
Abstract BACKGROUND: Plant diurnal rhythms are vital environmental adaptations to coordinate internal physiological responses to alternating day-night cycles. A comprehensive view of diurnal biology has been lacking for maize (Zea mays), a major world crop. METHODOLOGY: A photosynthetic tissue, the leaf, and a non-photosynthetic tissue, the developing ear, were sampled under natural field conditions. Genome-wide transcript profiling was conducted on a high-density 105 K Agilent microarray to investigate diurnal rhythms. CONCLUSIONS: In both leaves and ears, the core oscillators were intact and diurnally cycling. Maize core oscillator genes are found to be largely conserved with their Arabidopsis counterparts. Diurnal gene regulation occurs in leaves, with some 23% of expressed transcripts exhibiting a diurnal cycling pattern. These transcripts can be assigned to over 1700 gene ontology functional terms, underscoring the pervasive impact of diurnal rhythms on plant biology. Considering the peak expression time for each diurnally regulated gene, and its corresponding functional assignment, most gene functions display temporal enrichment in the day, often with distinct patterns, such as dawn or midday preferred, indicating that there is a staged procession of biological events undulating with the diurnal cycle. Notably, many gene functions display a bimodal enrichment flanking the midday photosynthetic maximum, with an initial peak in mid-morning followed by another peak during the afternoon/evening. In contrast to leaves, in developing ears as few as 47 gene transcripts are diurnally regulated, and this set of transcripts includes primarily the core oscillators. In developing ears, which are largely shielded from light, the core oscillator therefore is intact with little outward effect on transcription.
DOI:10.1534/genetics.104.032375URLPMID:15611184 [本文引用: 1]
Genetic architecture of flowering time in maize was addressed by synthesizing a total of 313 quantitative trait loci (QTL) available for this trait. These were analyzed first with an overview statistic that highlighted regions of key importance and then with a meta-analysis method that yielded a synthetic genetic model with 62 consensus QTL. Six of these displayed a major effect. Meta-analysis led in this case to a twofold increase in the precision in QTL position estimation, when compared to the most precise initial QTL position within the corresponding region. The 62 consensus QTL were compared first to the positions of the few flowering-time candidate genes that have been mapped in maize. We then projected rice candidate genes onto the maize genome using a synteny conservation approach based on comparative mapping between the maize genetic map and japonica rice physical map. This yielded 19 associations between maize QTL and genes involved in flowering time in rice and in Arabidopsis. Results suggest that the combination of meta-analysis within a species of interest and synteny-based projections from a related model plant can be an efficient strategy for identifying new candidate genes for trait variation.
DOI:10.1080/10543400903572753URLPMID:20309759 [本文引用: 1]
Weighted gene coexpression network analysis (WGCNA) has been applied to many important studies since its introduction in 2005. WGCNA can be used as a data exploratory tool or as a gene screening method; WGCNA can also be used as a tool to generate testable hypothesis for validation in independent data sets. In this article, we review key concepts of WGCNA and some of its applications in gene expression analysis of oncology, brain function, and protein interaction data.
DOI:10.1016/j.pbi.2007.01.003URLPMID:17291822 [本文引用: 1]
Genetic architecture refers to the numbers and genome locations of genes that affect a trait, the magnitude of their effects, and the relative contributions of additive, dominant, and epistatic gene effects. Quantitative trait locus (QTL) mapping techniques are commonly used to investigate genetic architectures, but the scope of inferences drawn from QTL studies are often restricted by the limitations of the experimental designs. Recent advances in experimental and statistical procedures, including the simultaneous analysis of QTL that segregate in diverse germplasm, should improve genetic architecture studies. High-resolution QTL mapping methods are being developed that may define the specific DNA sequence variants underlying QTL. Studies of genetic architecture, combined with improved knowledge of the structure of plant populations, will impact our understanding of plant evolution and the design of crop improvement strategies.
DOI:10.1534/genetics.105.048603URLPMID:16415370 [本文引用: 1]
To investigate the genetic basis of maize adaptation to temperate climate, collections of 375 inbred lines and 275 landraces, representative of American and European diversity, were evaluated for flowering time under short- and long-day conditions. The inbred line collection was genotyped for 55 genomewide simple sequence repeat (SSR) markers. Comparison of inbred line population structure with that of landraces, as determined with 24 SSR loci, underlined strong effects of both historical and modern selection on population structure and a clear relationship with geographical origins. The late tropical groups and the early orthern Flint group from the northern United States and northern Europe exhibited different flowering times. Both collections were genotyped for a 6-bp insertion/deletion in the Dwarf8 (D8idp) gene, previously reported to be potentially involved in flowering time variation in a 102 American inbred panel. Among-group D8idp differentiation was much higher than that for any SSR marker, suggesting diversifying selection. Correcting for population structure, D8idp was associated with flowering time under long-day conditions, the deletion allele showing an average earlier flowering of 29 degree days for inbreds and 145 degree days for landraces. Additionally, the deletion allele occurred at a high frequency (>80%) in Northern Flint while being almost absent (<5%) in tropical materials. Altogether, these results indicate that Dwarf8 could be involved in maize climatic adaptation through diversifying selection for flowering time.
