 ,1,**, 张立武,1,2,**, 赵捷1, 徐益1,2, 祁建民1, 张列梅,1,*
Evaluation and characteristic analysis of SSRs from the whole genome of jute (Corchorus capsularis)
YAO Jia-Yu,1,**, ZHANG Li-Wu,1,2,**, ZHAO Jie1, XU Yi1,2, QI Jian-Min1, ZHANG Lie-Mei,1,*通讯作者:
第一联系人:
收稿日期:2018-05-18接受日期:2018-08-20网络出版日期:2018-09-14
| 基金资助: |
Received:2018-05-18Accepted:2018-08-20Online:2018-09-14
| Fund supported: |

摘要
关键词:
Abstract
Keywords:
PDF (2854KB)元数据多维度评价相关文章导出EndNote|Ris|Bibtex收藏本文
本文引用格式
姚嘉瑜, 张立武, 赵捷, 徐益, 祁建民, 张列梅. 黄麻全基因组SSR鉴定与特征分析[J]. 作物学报, 2019, 45(1): 10-17. doi:10.3724/SP.J.1006.2019.84072
YAO Jia-Yu, ZHANG Li-Wu, ZHAO Jie, XU Yi, QI Jian-Min, ZHANG Lie-Mei.
黄麻为锦葵科(Malvaceae)黄麻属(Corchorus spp.)一年生次生韧皮部纤维作物, 其纤维产量占世界麻类纤维总产量的80%。黄麻属有100多个种, 具有栽培价值的有圆果种(C. capsularis)和长果种(C. olitorius), 两者具有不同生长习性, 存在生殖隔离, 皆为二倍体(2n = 14), 主要在孟加拉、印度和中国等国家种植[1,2,3]。在世界范围内, 黄麻的产量和种植面积仅次于棉花, 是麻纺工业的重要原料, 每年黄麻生产产值达到23亿美元[3]。
开发重复性和稳定性好的SSR分子标记, 对于黄麻遗传多样性研究、重要性状的遗传基础剖析等具有重要意义。然而, 相对于水稻等模式作物, 黄麻分子标记开发与其他作物差距很大, 目前国内外报道较少[2,3,4,5,6]。这些研究报道主要集中在RAPD、AFLP、SSR、ISSR等分子标记, 少量基于二代测序获得的RAD[7,8]或SLAF[9]等分子标记。如Nishat等[5]用抗寒性有差别的2个亲本O-9897和Acc.1805, 创建了F2代作图群体, 用8个ISSR引物构建了总长度为87.3 cM的包括3个连锁群的长果种黄麻遗传连锁图谱, 3个连锁群的大小在4.8~ 52.9 cM之间, 相邻标记平均距离为8.73 cM, 该图谱远远不能满足基因定位、基因克隆等研究的要求。Das等[6]用纤维品质有差别的2个亲本JRO524和PPO4, 创建了F6代RIL作图群体, 用36个SSR标记构建长果种黄麻遗传连锁图谱, 但其只有6条连锁群, 标记密度达21.8 cM。由于SSR标记具有高效、高共显性等优点, 尤其是重复性好, 不同研究间可互比较, 是物种的起源与进化、遗传连锁图谱构建等研究优先考虑的分子标记[10]。国内外****开发了水稻[11]、大麦[12]、玉米[13]、油菜[14,15,16]等作物的SSR标记, 为研究该作物的遗传多样性、遗传连锁图谱构建、关联分析等打下了基础。
最近, Islam等[3]发表了黄麻基因组草图(draft)。该研究利用二代测序技术Roche/454对黄麻基因组测序, 经组装发现, 圆果种CVL-1基因组大小为338 M (13.69 Gb raw data, Scaffold N50为4.1 Mb)。这表明已获得黄麻基因组草图, 但还没有组装到染色体水平。然而, 对于黄麻全基因组SSR鉴定尚未见报道。本研究旨在分析圆果种黄麻CVL-1基因组、基因、CDS和cDNA中SSR信息, 发掘SSR位点并分析其特征, 为黄麻遗传育种研究提供SSR信息。
1 材料与方法
通过NCBI公共数据库(https://www.ncbi.nlm. nih.gov/)获得圆果种CVL-1基因组、基因、CDS和cDN A序列(Sequence Read Archive [SRA]: SRP053213)。利用SSR Primer工具(http://hornbill. cspp.latrobe.edu.au/ ssrdiscovery.html)搜索这些序列所包含的SSR。筛选SSR的标准为, 二核苷酸重复次数>6次, 三核苷酸重复次数>4次, 四核苷酸重复次数>3次, 五核苷酸重复次数>2次。利用Primer 3软件查找SSR位点。2 结果与分析
2.1 黄麻SSR分布的总体特征
分析了黄麻重复基元为2~6 bp, 且重复长度不短于12 bp的SSR分类和分布情况, 如表1所示。黄麻全基因组大小为338 Mb, 共开发了153,242个完整的SSR, 平均密度为467.20个SSR Mb-1。其中, I类(重复序列长度 ≥ 20 bp) SSR有38,917个(25.40%), 平均密度为118.65个SSRs Mb-1; 而II类(重复序列长度 ≥ 12 bp和<20 bp) SSR有114,325 (74.60%), 平均密度为348.55个SSR Mb-1。黄麻所有基因的cDNA大小为41.20 Mb, 共开发了10,747个SSR, 平均密度为260.85 SSR Mb-1, 包括1251个 (11.64%) I类SSR和9496 (88.36%) II类SSR, 其平均密度分别为30.36个SSR Mb-1和230.49个SSR Mb-1。Table 1
表1
表1黄麻SSR的分布特征
Table 1
| 序列类型 Sequence type | 大小 Size (Mb) | GC含量 GC content (%) | I类SSR Class I SSR | II类SSR Class II SSR | 总SSR Total SSR | |||
|---|---|---|---|---|---|---|---|---|
| 数目 Number | 密度 Density (SSR Mb-1) | 数目 Number | 密度 Density (SSR Mb-1) | 数目 Number | 密度 Density (SSR Mb-1) | |||
| cDNA | 41.20 | 57.79 | 1251 | 30.36 | 9496 | 230.49 | 10747 | 260.85 |
| CDS | 29.80 | 59.33 | 592 | 19.87 | 4862 | 163.15 | 5454 | 183.02 |
| Gene | 96.30 | 54.39 | 7865 | 81.67 | 28428 | 295.20 | 36293 | 376.87 |
| Genome | 330.00 | 54.03 | 38917 | 118.65 | 114325 | 348.55 | 153242 | 467.20 |
新窗口打开|下载CSV
经过比较可以发现: 与基因组序列相比, cDNA序列具有较低的SSR密度, 而且具有较高的GC含量(57.79%)。I类SSR分布密度低于II类SSR。I类SSR在基因组、基因、CDS和cDNA中平均密度为118.65、81.67、19.87和30.36个SSR Mb-1, 而II类SSR相应的平均密度显著偏高, 分别348.55、295.20、163.15与230.49个SSR Mb-1。这表明I类SSR分布密度低于II类SSR。
2.2 黄麻SSR不同重复类型的频率分布
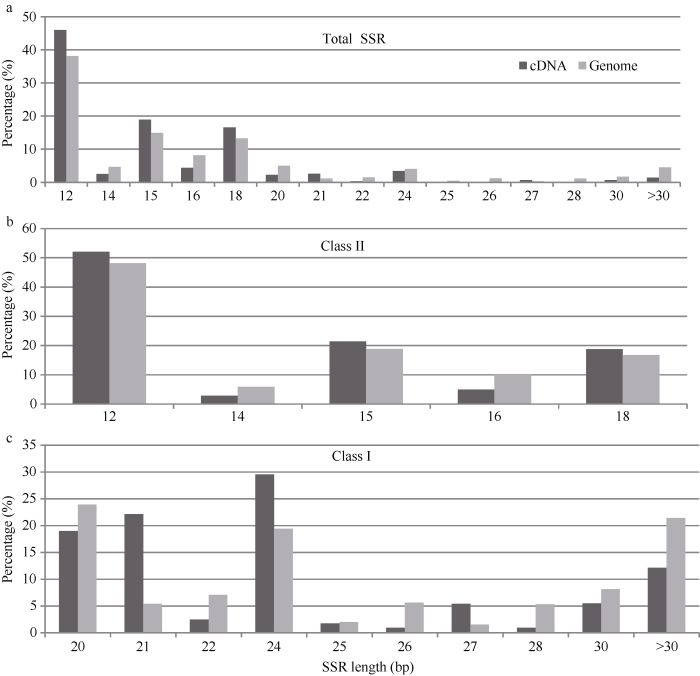
对于II类SSR来说, 全基因组和cDNA中比例最多的SSR重复序列平均长度是12 bp, 分别占全基因组和cDNA中的45.98%和38.14% (图1-a), 占全基因组和cDNA中II类SSR的52.03%和48.19% (图1-b)。比例较多的SSR重复序列平均长度是15 bp, 分别占全基因组和cDNA中的18.90%和14.91%, 占全基因组和cDNA中II类SSR的21.39%和18.83%。图1
 新窗口打开|下载原图ZIP|生成PPT
图1黄麻SSR重复序列长度的频率分布
Fig. 1Freguency distribution of SSRs in the genome-wide and cDNA by the repeat length of total SSRs (a), class II SSRs (b), and class I SSRs (c), respectively
与II类SSR相比, 全基因组和cDNA中I类SSR的比例最多重复序列平均长度表现不同(图1-c)。全基因组中I类SSR比例最多的重复序列平均长度是20 bp, 具有7646个SSR; 而cDNA序列中I类SSR比例最多的重复序列平均长度是24 bp, 占29.58%, 其次是21 bp重复序列平均长度。
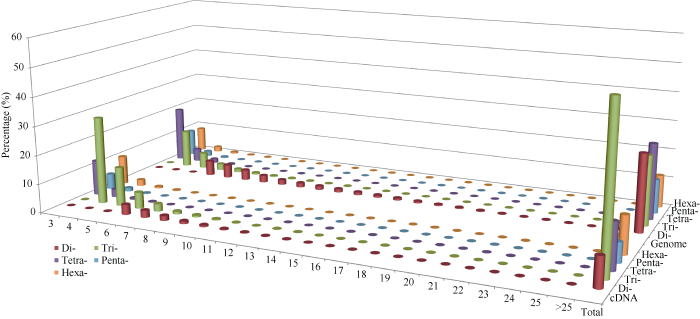
SSR重复基元在全基因组中比例较多的SSR重复基元是二核苷酸、三核苷酸、四核苷酸, 分别占22%、19%和23%。经比较, 不同重复基元的频率高低与核苷酸数量没有严格的相关性。如全基因组中四核苷酸重复基元的SSR总数略多于三核苷酸。同样地, 在cDNA中, 三核苷酸重复所占比例最多, 为43%, 其次是四核苷酸重复, 占13.3%, 二核苷酸重复和五核苷酸重复比较少, 分别占9.7%和7.1% (图2-a)。
图2
 新窗口打开|下载原图ZIP|生成PPT
图2黄麻基因组、基因、CDS和cDNA的SSR重复基元的频率分布
Fig. 2Frequency distribution of total SSRs (a), class II SSRs (b), and class I SSRs (c) according to the length of repeat motif in cDNA, CDS, genes and the whole genome, respectively
按不同类型SSR来统计各重复基元的分布频率(图2-b和图2-c)。cDNA中I类SSR, 三核苷酸重复基元远远高于其他类型; cDNA中II类SSR呈现类似的特点, 推测作为蛋白质遗传密码子模板的cDNA, 三核苷酸重复基元在cDNA_SSR中数量比较突出。而基因组中I类SSR, 二核苷酸重复基元远远高于其他类型; 基因组中II类SSR, 二、三、四核苷酸重复基元均较多。
图3列出了黄麻SSR重复基元及平均重复序列长度的频率分布。随着分析的五种重复基元(2~6 bp)的数量增加, SSR分布的频率逐步降低, 特别是对于较长重复基元(如四至六核苷酸), 其频率降低最显著。
图3
 新窗口打开|下载原图ZIP|生成PPT
图3黄麻基因组和cDNA的SSR重复基元及平均重复序列长度的频率分布
Fig. 3Frequency distribution of mean motif length and repeat types in SSRs identified from cDNA and the whole genome of jute
2.3 黄麻SSR重复基元种类及其频率分布
如表2所示, 重复基元的重复次数对于不同重复基元种类而言是不同的, 如三核苷酸重复基元的重复次数在基因组和cDNA中分别是二核苷酸的0.9倍和5.4倍, 分别是四核苷酸的0.9倍和3.5倍, 体现出三核苷酸重复基元在cDNA中较频繁地发生。对比黄麻SSR重复基元在全基因组和cDNA中的分布频率, 可以发现, SSR在基因组中, 二、三核苷酸的平均重复序列长度比其他种类要长, 显示出二、三核苷酸重复在黄麻基因组SSR中较频繁地发生, 且其重复基元数量在基因组SSR中比例也最多。统计黄麻SSR, 黄麻最长的平均重复序列长度为三核苷酸重复基元。其中, 重复基元AAT重复次数达2511, 重复序列长度达到7533 bp; 其次重复基元AAG, 重复次数达2246。Karaoglu等[17]研究显示, 较长的重复序列长度通常倾向于具有较高的突变率, 这与SSR的多态性息息相关。Table 2
表2
表2黄麻与不同物种间SSR重复类型的频率分布比较
Table 2
| 序列类型 Sequence type | 黄麻 Jute | 其他植物物种的SSR密度 Density of SSRs in other plant species (SSR Mb-1) | |||||||
|---|---|---|---|---|---|---|---|---|---|
| 识别SSR数 Number of SSRs identified | 相对频率 Relative frequency (%) | 平均重复次数 Mean repeat number | 密度 (SSR Mb-1) | 水稻 Oryza sativa (Os) | 高粱 Sorghum bicolor (Sb) | 拟南芥Arabidopsis thaliana (At) | 黄瓜 Cucumis sativus (Cs) | 葡萄 Vitis vinifera (Vv) | |
| cDNA | |||||||||
| Di- | 1082 | 10.07 | 7.99 | 26.26 | 57.9 | 52.1 | 54.8 | 40.7 | |
| Tri- | 5862 | 54.55 | 5.12 | 142.28 | 485.7 | 366.3 | 179.7 | 108.4 | |
| Tetra- | 1674 | 15.58 | 3.47 | 40.63 | 107.3 | 125.5 | 69.3 | 53.3 | |
| Penta- | 729 | 6.78 | 3.56 | 17.69 | 41.6 | 44.1 | 23.3 | 17.4 | |
| Hexa- | 1400 | 13.03 | 3.64 | 33.98 | 44.6 | 56.5 | 36.1 | 22.1 | |
| Total/mean | 10747 | 100.00 | 23.78 | 260.85 | 737.1 | 644.5 | 363.2 | 241.9 | |
| Genome | |||||||||
| Di- | 40863 | 26.67 | 10.38 | 124.58 | 100.1 | 51.6 | 78.7 | 146.0 | 117.2 |
| Tri- | 36836 | 24.04 | 5.35 | 112.30 | 220.1 | 108.5 | 146.6 | 141.1 | 115.8 |
| Tetra- | 40144 | 26.20 | 3.61 | 122.39 | 132.7 | 105.4 | 93.2 | 164.2 | 171.3 |
| Penta- | 18098 | 11.81 | 3.61 | 55.18 | 45.8 | 22.5 | 32.0 | 54.4 | 58.0 |
| Hexa- | 17301 | 11.29 | 3.64 | 52.75 | 27.4 | 27.5 | 13.6 | 31.0 | 29.3 |
| Total/mean | 153242 | 100.00 | 26.59 | 467.20 | 526.1 | 315.5 | 364.1 | 536.7 | 491.6 |
新窗口打开|下载CSV
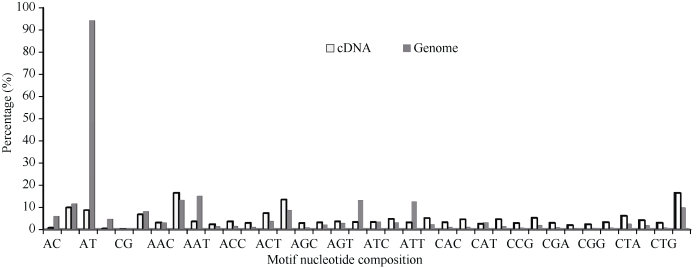
考虑到二、三核苷酸重复在黄麻基因组SSR中比重大, 进一步分析其优势重复基元, 如图4所示。二核苷酸重复基元的SSR在基因组中, 以AT为主, 占75.88%。而CG重复基元则相当罕见, 仅占0.04%; 在cDNA中, 以AT和AG重复基元较多, 分别占32.9%和37.6%。三核苷酸重复基元的SSR在基因组中, AAT、AAG、ATA和ATT所占比例较多, 分别占13.4%、11.8%、11.7%和11.1%; 在cDNA中, AAG、AGA、CTT所占比例较多, 分别占13.4%、11.5%、9.4%和11.5%。
图4
 新窗口打开|下载原图ZIP|生成PPT
图4黄麻SSR二核苷酸和三核苷酸序列的优势重复基元的频率分布
Fig. 4Frequency distribution of predominant repeat motifs for di- and tri-nucleotide SSRs in jute
2.4 不同物种间SSR重复类型的频率分布比较
为了比较不同物种间SSR重复类型的频率分布特征, 我们选取基因组大小差不多的5个物种, 分别为2个单子叶植物(水稻Oryza sativa和高粱Sorghum bicolor)和3个双子叶植物(拟南芥Arabidopsis thaliana、黄瓜Cucumis sativus L.和葡萄Vitis vinifera)。应用相同的标准来研究这6个物种基因组SSR分布特征, 即统计重复基元为2~6 bp, 重复长度不短于12 bp的SSR。表2列出黄麻和这5个物种SSR分布的总体特征。从SSR分布密度来看, 这6个物种的SSR分布密度变异范围从315.5 SSR Mb-1到738.5 SSR Mb-1。黄麻在分析的6个物种中SSR分布密度中等(467.2 SSR Mb-1)。高粱的SSRs密度最低, 仅为315.5 SSR Mb-1, 略低于拟南芥(364.1 SSR Mb-1)。3 讨论
SSR标记对植物的遗传学、生态学、分类学、进化等研究至关重要。分析黄麻SSR在基因组、基因、CDS和cDNA中不同层面的重复基元分布频率和平均重复序列长度等信息, 有助于黄麻基因组的遗传研究, 并提供SSR位点信息。3.1 黄麻SSR的分类及其频率分布
本研究从公共数据库获得黄麻基因组草图序列, 共开发了153,242个基因组SSR; 基于cDNA序列开发了10,747个SSR。结果表明, 大部分重复基元为二至五核苷酸, 其中cDNA序列中三核苷酸重复基元数量较多而基因组序列中二核苷酸重复基元数量较多。这与在大多数植物基因组中三核苷酸重复的分布频率较高的结果是一致的[14,15,16]。Hong等[19]分析白菜中SSR重复基元发现, 三核苷酸重复出现的频率是37%。Goff等[20]在水稻中, 也发现基因组SSR中三核苷酸重复占59%。本研究中, 黄麻SSR的分析结果显示, 二、三、四核苷酸中所有的重复基元类型都有, 但不同重复基元的比例存在显著差异。其中二核苷酸重复中AT类型最丰富, 三核苷酸重复中AAT和AAG最多。二核苷酸重复基元的SSR在基因组中, 以AT为主, 这与课题组前期利用公共数据库数据得出的结论类似[18]。Temnykh等[11]研究发现, SSR长度大于或等于20 bp的SSR具有较高的多态性。为此, 将SSR划分为两类, 即I类SSR指重复序列长度大于20 bp, 而II类SSR指重复序列长度大于12 bp且小于20 bp。在黄麻全基因组和cDNA中, 较短的II类SSR比I类更为丰富。这种趋势可能是由于较长的I类重复是由较短的II类重复不对称配对产生的, 也可能是较长的I类重复具有不稳定性, 而较短的II类重复可能更耐受突变和保留。
3.2 黄麻SSR重复基元类型及其平均重复序列长度
在黄麻基因组中, 大多数SSR是二、三和四核苷酸重复序列, 它们占所有SSR的76.91%, 且三者的量相对比较平均。对于不同类型的SSR重复基元, 随着重复单元的数量增加, 其在基因组和cDNA的SSR分布频率呈现逐步降低; 随着重复次数的增加, 较长的重复基元, 五核苷酸和六核苷酸的分布频率会显著降低。3.3 黄麻与不同物种间SSR特征比较
Morgante等[21]报道, 基因组大小与SSR密度或SSR数量之间呈现负相关。研究黄麻和另外5个物种基因组SSR分布特征印证这一点, 具有最大基因组(739 Mb)的高粱, SSR密度最低。在大豆(1115 Mb)和玉米(2365 Mb)基因组中也观察到类似的趋势[22]。在这6种植物的cDNA中, 三核苷酸SSR是最丰富的, 其次是四核苷酸和二核苷酸。作为蛋白质遗传密码子模板的cDNA, 三核苷酸重复基元在SSR中数量比较突出, 较频繁地发生, 可能具有类似于简并密码子的作用。黄麻基因组中的SSR密度高于基因组的转录区域cDNA, 这种现象与黄瓜和葡萄相一致, 而与拟南芥、高粱相反。4 结论
黄麻全基因组大小约为338 Mb, 开发了153,242个SSR, 平均密度为467.20个SSR Mb-1。黄麻所有基因的cDNA大小为41.20 Mb, 开发了10,747个SSR, 平均密度为260.85 SSR Mb-1。大部分重复基元为二至四核苷酸, 占76.91%, 其中cDNA序列SSR中三核苷酸重复基元数量较多而基因组SSR中二核苷酸重复基元数量较多。不同物种间, 黄麻具中等SSR分布密度(467.2 SSR Mb-1)。参考文献 原文顺序
文献年度倒序
文中引用次数倒序
被引期刊影响因子
[本文引用: 1]
[本文引用: 1]
URL [本文引用: 2]

关于黄麻的起源和进化,历来存在不同的见解。本文综述了该领域的研究结果,并根据现代生物学关于种的概念,应用大陆漂移学说、植物地理学理论及作物进化理论,结合历史学及现代黄麻地理分布证据,提出黄麻起源和进化的新观点:1)非洲东南部地区为黄麻属野生种的世界起源和分化中心;2)非洲东南部地区为野生长果种的起源和第一分化中心;印度-缅甸-中国毗联地区为野生长果种的第二分化中心,也是长果栽培种的演变中心;3)中国南部地区为野生圆果种的起源和分化中心,也是圆果栽培种的演变中心。
URL [本文引用: 2]
关于黄麻的起源和进化,历来存在不同的见解。本文综述了该领域的研究结果,并根据现代生物学关于种的概念,应用大陆漂移学说、植物地理学理论及作物进化理论,结合历史学及现代黄麻地理分布证据,提出黄麻起源和进化的新观点:1)非洲东南部地区为黄麻属野生种的世界起源和分化中心;2)非洲东南部地区为野生长果种的起源和第一分化中心;印度-缅甸-中国毗联地区为野生长果种的第二分化中心,也是长果栽培种的演变中心;3)中国南部地区为野生圆果种的起源和分化中心,也是圆果栽培种的演变中心。
DOI:10.1038/nplants.2016.223URLPMID:28134914 [本文引用: 4]
High-quality draft genomes have been generated for the two commercially cultivated jute species, Corchorus olitorius and Corchorus capsularis.
DOI:10.2135/cropsci2004.6780URL [本文引用: 1]
Genetic improvement of the cultivars of jute (Corchorus olitorius L. and Corchorus capsularis L.) is needed to broaden the genetic base of new cultivars. All the cultivars in use have been evolved through pure line selection from a few common accessions. The objective of this study was to evaluate the genetic diversity available in the cultivated species of jute. Genetic diversity was evaluated by simple sequence repeat (SSR) marker loci and an AFLP assay. A total of 305 polymorphic products were detected by AFLP analysis using 10 pairs of primers (EcoRI and MseI) to amplify template DNA from 49 genotypes of the two jute species. Additionally, polymorphism with two to four allelic lengths was detected with each pair of chloroplast microsatellite primers developed from Nicotiana tabacum L. Results from both evaluations showed that the level of variation between species is high. The two species indeed are distantly related and their maternal origins may be different. On the contrary, genetic variability present at the intraspecific level is low. The resulting dendrogram showed common ancestral origin for many accessions. A few major Indian cultivars of both the species, used as an internal check, were closely related to the wild accessions. Nevertheless, RG, an Indian accession and two Kenyan accessions, KEN/BL/17 and KEN/DS/35C, among the C. olitorius genotypes and CHN/FJ/69 of C. capsularis revealed phenetic distinctiveness from the rest of the genotypes studied. The results indicate that enough diversity exists to broaden the genetic base of new jute cultivars.
DOI:10.3923/ajps.2006.758.762URL [本文引用: 2]
DOI:10.1007/s12041-012-0151-9URL [本文引用: 2]
DOI:10.1007/s11032-015-0311-8URL [本文引用: 1]
Jute is the most important bast fibre crop of the world. Stem rot disease caused by Macrophomina phaseolina is a major constraint of jute cultivation. Recent advances in genomics and bioinformatics have enabled the development of high-throughput genotyping, allowing the construction of saturated linkage maps for identification of resistant lines. In the present study, single nucleotide polymorphism (SNP) markers associated with expressed sequence tags (ESTs) were developed and were used to generate comprehensive linkage maps for Corchorus capsularis . From a set of 43,335 variant nucleotide positions detected through in silico analysis, 768 SNPs were selected for genotyping of a recombinant inbred line population. A total of 705 SNPs (91.702%) successfully detected segregating polymorphisms. In addition to EST–SNPs, genomic simple sequence repeats were assigned to the genetic map in order to obtain an evenly distributed genome-wide coverage. Nine linkage groups were constructed from genetic maps with estimated cumulative total map length of 201602cM and average inter-locus interval of 4.202cM. SNP assay and linkage mapping are important set of tools for marker-assisted selection, and it could be used for identifying resistance to M. phaseolina in jute cultivars. This is the first report of developing SNP markers and SNP-based linkage map in jute.
DOI:10.1007/s11032-015-0249-xURL [本文引用: 1]
We used RAD (restriction-site-associated DNA) sequencing to detect genome-wide SNPs and construct a dense linkage map using an intercross F 2 population in jute ( Corchorus olitorius ). The linkage map comprising a total of 503 RAD markers in seven linkage groups spanned 358.502cM with an average marker interval of 0.7202cM and covered 87.002% of the genome. Genome-wide segregation distortion of the mapped loci (34.402%) was non-random across the linkage map, with a directional bias mostly towards the female genotypes. Jute had maximum syntenic relationships with cocoa (47.502% homology) and diploid cotton (29.202% homology). However, synteny and collinearity were not conserved. Histological fibre content (FC; total number of fibre cell bundles in a stem cross section) was positively correlated with fibre yield (FY), plant height (PH), root weight (RW) and stem-base diameter (SBD). Broad-sense heritability estimates were high for all traits, with FC and FY showing maximum heritability (~9302%). QTL mapping based on the F 2:3 phenotypes detected nine QTL across the two environments. The QTL for FC was coincident with one QTL each for FY, PH, RW and SBD on top of a single-SNP (C/T) marker at 40.202cM on LG1, each accounting for ~7–1102% of the phenotypic variance. Two QTL linked in repulsion one each for PH and SBD, with varying degrees of overdominance, were associated with two single-SNP (C/T) markers on LG2, each accounting for ~17–1802% of the phenotypic variance. Few candidate genes were identified within the QTL regions. Our results would enable development of tools for marker-assisted selection in jute.
DOI:10.1186/s12864-017-3712-8URLPMID:28482802 [本文引用: 1]
Genetic mapping and quantitative trait locus (QTL) detection are powerful methodologies in plant improvement and breeding. White jute (Corchorus capsularisL.) is an important industrial raw material fiber crop because of its elite characteristics. However, construction of a high-density genetic map and identification of QTLs has been limited in white jute due to a lack of sufficient molecular markers. The specific locus amplified fragment sequencing (SLAF-seq) strategy combines locus-specific amplification and high-throughput sequencing to carry outde novosingle nuclear polymorphism (SNP) discovery and large-scale genotyping. In this study, SLAF-seq was employed to obtain sufficient markers to construct a high-density genetic map for white jute. Moreover, with the development of abundant markers, genetic dissection of fiber yield traits such as plant height was also possible. Here, we present QTLs associated with plant height that were identified using our newly constructed genetic linkage groups. An F8population consisting of 100 lines was developed. In total, 69,446 high-quality SLAFs were detected of which 5,074 SLAFs were polymorphic; 913 polymorphic markers were used for the construction of a genetic map. The average coverage for each SLAF marker was 43-fold in the parents, and 9.8-fold in each F8individual. A linkage map was constructed that contained 913 SLAFs on 11 linkage groups (LGs) covering 1621.402cM with an average density of 1.6102cM per locus. Among the 11 LGs, LG1 was the largest with 210 markers, a length of 406.3402cM, and an average distance of 1.9302cM between adjacent markers. LG11 was the smallest with only 25 markers, a length of 29.6602cM, and an average distance of 1.1902cM between adjacent markers. ‘SNP_only’ markers accounted for 85.54% and were the predominant markers on the map. QTL mapping based on the F8phenotypes detected 11 plant height QTLs including one major effect QTL across two cultivation locations, with each QTL accounting for 4.14–15.63% of the phenotypic variance. To our knowledge, the linkage map constructed here is the densest one available to date for white jute. This analysis also identified the first QTL in white jute. The results will provide an important platform for gene/QTL mapping, sequence assembly, genome comparisons, and marker-assisted selection breeding for white jute.
DOI:10.1007/s00122-012-1861-3URLPMID:22487878 [本文引用: 1]
One putative quantitative trait locus (QTL) for seeds per silique ( SS ), cqSS .A8, was identified using a double haploid (DH) population in Brassica napus , and near-isogenic lines (NILs; BC 3 F 1 ) for cqSS .A8 were developed. However, the flanking markers from cqSS .A8 showed no significant difference using single-marker analysis, even though the frequency distribution of SS in the BC 3 F 1 was bimodal, suggesting that one novel locus existed. In this study, we characterized the effects of this locus in the NILs and used a published linkage map to determine its location. A three-step approach was designed for mapping the locus in the NILs (BC 3 F 2 ): (1) determining the individual BC 3 F 2 genotype at the locus using a progeny test; (2) identifying amplified fragment length polymorphism (AFLP) markers linked to the locus using a combination of AFLP and bulked segregant analysis; and (3) determining the location and effects of this locus. QTL analysis in the BC 3 F 2 revealed that this locus explained 85.8 and 55.7 % of phenotypic variance for SS and SL , respectively. Its additive and dominant effects on SS were 6.1 and 5.7, respectively. The locus was validated using a DH population by composite interval mapping and located to linkage group C9 (designated as qSS .C9). Mapping qSS .C9 was undertaken using 230 extremely low- SS plants of a BC 4 F 1 population containing 807 plants. We found that qSS .C9 delimited a 1.005-Mb interval including 218 predicted genes in the reference Brassica rapa (Chiifu-401). These results will greatly facilitate map-based cloning of qSS .C9 and seed yield improvement in rapeseed.
[本文引用: 2]
DOI:10.1007/s001220050617URL [本文引用: 1]
RFLPs, AFLPs, RAPDs and SSRs were used to determine the genetic relationships among 18 cultivated barley accessions and the results compared to pedigree relationships where these were available. All of the approaches were able to uniquely fingerprint each of the accessions. The four assays differed in the amount of polymorphism detected. For example, all 13 SSR primers were polymorphic, with an average of 5.7 alleles per primer set, while nearly 54% of the fragments generated using AFLPs were monomorphic. The highest diversity index was observed for AFLPs (0.937) and the lowest for RFLP (0.322). Principal co-ordinate analysis (PCoA) clearly separated the spring types from the winter types using RFLP and AFLP data with the two-row winter types forming an intermediate group. Only a small group of spring types clustered together using SSR data with the two-row and six-row winter varieties more widely dispersed. Direct comparisons between genetic similarity (GS) estimates revealed by each of the assays were measured by a number of approaches. Spearman rank correlation ranked over 70% of the pairwise comparisons between AFLPs and RFLPs in the same order. SSRs had the lowest values when compared to the other three assays. These results are discussed in terms of the choice of appropriate technology for different aspects of germplasm evaluation.
DOI:10.1007/s001220051017 [本文引用: 1]
DOI:10.1007/s00122-009-0967-8URLPMID:19190889 [本文引用: 2]
Microsatellite or simple sequence repeat (SSR) markers are routinely used for tagging genes and assessing genetic diversity. In spite of their importance, there are limited numbers of SSR markers available for Brassica crops. A total of 627 new SSR markers (designated BnGMS) were developed based on publicly available genome survey sequences and used to survey polymorphisms among six B. napus cultivars that serve as parents for established populations. Among these SSR markers, 591 (94.3%) successfully amplified at least one fragment and 434 (73.4%) detected polymorphism among the six B. napus cultivars. No correlation was observed between SSR motifs, repeat number or repeat length with polymorphism levels. A linkage map was constructed using 163 newly developed BnGMS marker loci and anchored with 164 public SSRs in a doubled haploid population. These new markers are evenly distributed over all linkage groups (LGs). Given that the majority of these SSRs are derived from bacterial artificial chromosome (BAC) end sequences, they will be useful in the assignment of their cognate BACs to LGs and facilitate the integration of physical maps with genetic maps for genome sequencing in B. napus .
DOI:10.1007/s11032-010-9509-yURL [本文引用: 2]
AbstractThe availability of whole genome shotgun sequences (WGSs) in Brassica oleracea provides an unprecedented opportunity for development of microsatellite or simple sequence repeat (SSR) markers for genome analysis and genetic improvement in Brassica species. In this study, a total of 56,465 non-redundant SSRs were identified from the WGSs in B. oleracea, with dinucleotide repeats being the most abundant, followed by tri-, tetra- and pentanucleotide repeats. From these, 1,398 new SSR markers (designated as BoGMS) with repeat length 25 bp were developed and used to survey polymorphisms with a panel of six rapeseed varieties, which is the largest number of SSR markers developed for the C genome in a single study. Of these SSR markers, 752 (69.5%) showed polymorphism among the six varieties. Of these, 266 markers that showed clear scorable polymorphisms between B. napus varieties No. 2127 and ZY821 were integrated into an existing B. napus genetic linkage map. These new markers are preferentially distributed on the linkage groups in the C genome, and significantly increased the number of SSR markers in the C genome. These SSR markers will be very useful for gene mapping and marker-assisted selection of important agronomic traits in Brassica species.
DOI:10.1186/1471-2164-11-594URLPMID:3091739 [本文引用: 2]
The MultinationalBrassica rapaGenome Sequencing Project (BrGSP) has developed valuable genomic resources, including BAC libraries, BAC-end sequences, genetic and physical maps, and seed BAC sequences forBrassica rapa. An integrated linkage map between the amphidiploidB. napusand diploidB. rapawill facilitate the rapid transfer of these valuable resources fromB. rapatoB. napus(Oilseed rape, Canola). In this study, we identified over 23,000 simple sequence repeats (SSRs) from 536 sequenced BACs. 890 SSR markers (designated as BrGMS) were developed and used for the construction of an integrated linkage map for the A genome inB. rapaandB. napus. Two hundred and nineteen BrGMS markers were integrated to an existingB. napuslinkage map (BnaNZDH). Among these mapped BrGMS markers, 168 were only distributed on the A genome linkage groups (LGs), 18 distrubuted both on the A and C genome LGs, and 33 only distributed on the C genome LGs. Most of the A genome LGs inB. napuswere collinear with the homoeologous LGs inB. rapa, although minor inversions or rearrangements occurred on A2 and A9. The mapping of these BAC-specific SSR markers enabled assignment of 161 sequencedB. rapaBACs, as well as the associated BAC contigs to the A genome LGs ofB. napus. The genetic mapping of SSR markers derived from sequenced BACs inB. rapaenabled direct links to be established between theB. napuslinkage map and aB. rapaphysical map, and thus the assignment ofB. rapaBACs and the associated BAC contigs to theB. napuslinkage map. This integrated genetic linkage map will facilitate exploitation of theB. rapaannotated genomic resources for gene tagging and map-based cloning inB. napus, and for comparative analysis of the A genome withinBrassicaspecies.
DOI:10.1093/molbev/msi057URLPMID:15563717 [本文引用: 1]
The use of simple sequence repeats or microsatellites as genetic markers has become very popular because of their abundance and length variation between different individuals. SSRs are tandem repeat units of 1 to 6 base pairs that are found abundantly in many prokaryotic and eukaryotic genomes. This is the first study examining and comparing SSRs in completely sequenced fungal genomes. We analyzed and compared the occurrences, relative abundance, relative density, most common, and longest SSRs in nine taxonomically different fungal species: Aspergillus nidulans, Cryptococcus neoformans, Encephalitozoon cuniculi, Fusarium graminearum, Magnaporthe grisea, Neurospora crassa, Saccharomyces cerevisiae, Schizosaccharomyces pombe, and Ustilago maydis. Our analysis revealed that, in all of the genomes studied, the occurrence, abundance, and relative density of SSRs varied and was not influenced by the genome sizes. No correlation between relative abundance and the genome sizes was observed, but it was shown that N. crassa, the largest genome analyzed had the highest relative abundance of SSRs. In most genomes, mononucleotide, dinucleotide, and trinucleotide repeats were more abundant than the longer repeated SSRs. Generally, in each organism, the occurrence, relative abundance, and relative density of SSRs decreased as the repeat unit increased. Furthermore, each organism had its own common and longest SSRs. Our analysis showed that the relative abundance of SSRs in fungi is low compared with the human genome and that longer SSRs in fungi are rare. In addition to providing new information concerning the abundance of SSRs for each of these fungi, the results provide a general source of molecular markers that could be useful for a variety of applications such as population genetics and strain identification of fungal organisms.
[本文引用: 1]
[本文引用: 1]
[本文引用: 1]
[本文引用: 1]
DOI:10.1063/1.363554URLPMID:11799393 [本文引用: 1]
Abstract Microsatellites are a ubiquitous class of simple repetitive DNA sequence. An excess of such repetitive tracts has been described in all eukaryotes analyzed and is thought to result from the mutational effects of replication slippage. Large-scale genomic and EST sequencing provides the opportunity to evaluate the abundance and relative distribution of microsatellites between transcribed and nontranscribed regions and the relationship of these features to haploid genome size. Although this has been studied in microbial and animal genomes, information in plants is limited. We assessed microsatellite frequency in plant species with a 50-fold range in genome size that is mostly attributable to the recent amplification of repetitive DNA. Among species, the overall frequency of microsatellites was inversely related to genome size and to the proportion of repetitive DNA but remained constant in the transcribed portion of the genome. This indicates that most microsatellites reside in regions pre-dating the recent genome expansion in many plants. The microsatellite frequency was higher in transcribed regions, especially in the untranslated portions, than in genomic DNA. Contrary to previous reports suggesting a preferential mechanism for the origin of microsatellites from repetitive DNA in both animals and plants, our findings show a significant association with the low-copy fraction of plant genomes.
[本文引用: 1]
