 ,1,**, 徐振江,1,**, 饶得花1, 鲁清2,3, 李少雄2,3, 刘海燕2,3, 陈小平2,3, 梁炫强2,3, 洪彦彬,2,3,*1
 Genetic diversity analysis and distinctness identification of peanut cultivars based on morphological traits and SSR markers
LIU Hong,1,**, XU Zhen-Jiang,1,**, RAO De-Hua1, LU Qing2,3, LI Shao-Xiong2,3, LIU Hai-Yan2,3, 2,3, LIANG Xuan-Qiang2,3, HONG Yan-Bin,2,3,*1 2
3
通讯作者:
第一联系人:
收稿日期:2018-04-27接受日期:2018-08-20网络出版日期:2018-09-19
| 基金资助: |
Received:2018-04-27Accepted:2018-08-20Online:2018-09-19
| Fund supported: |

摘要
关键词:
Abstract
Keywords:
PDF (1471KB)元数据多维度评价相关文章导出EndNote|Ris|Bibtex收藏本文
本文引用格式
刘洪, 徐振江, 饶得花, 鲁清, 李少雄, 刘海燕, 陈小平, 梁炫强, 洪彦彬. 基于形态学性状和SSR标记的花生品种遗传多样性分析和特异性鉴定[J]. 作物学报, 2019, 45(1): 26-36. doi:10.3724/SP.J.1006.2019.84060
LIU Hong, XU Zhen-Jiang, RAO De-Hua, LU Qing, LI Shao-Xiong, LIU Hai-Yan, , LIANG Xuan-Qiang, HONG Yan-Bin.
花生栽培种(Arachis hypogaea L.)属落花生属(Arachis)花生区组(Arachis section), 异源四倍体(2n = 4x = 40, AABB), 是世界范围内广泛栽培的重要油料和经济作物。因其适应性广、丰产性好、营养丰富、经济效益高、适于加工, 在促进农民增收和维护国家粮油安全中发挥重要作用。我国不但是花生种植、消费和出口大国, 同时也是花生育种强国。截止2017年7月, 共有409个花生品种申请植物新品种权, 其中授权品种116个[1]。
中国是国际植物新品种保护联盟(UPOV)的成员国, 依据植物新品种保护条例[2]的规定, 植物新品种必需具备特异性(distinctness)、一致性(uniformity)和稳定性(stability) (简称DUS), 才能授予品种权。特异性测试是DUS测试的核心, 而准确筛选近似品种是特异性测试的基本要求。目前花生近似品种筛选仍以形态学鉴定为基础, 虽然该方法简单、直接, 但容易受环境条件和人为因素的影响。此外, 由于过分强调花生品种的丰产性, 育种家通常选用高配合力亲本进行杂交育种, 导致育成品种亲缘关系近, 后代遗传变异停留在近交水平[3], 从而加大了表型筛选近似品种的难度。尤其近几年品种侵权事件不断增加, 同种多名和同名多种等不良现象的涌现, 给花生新品种保护工作和品种管理带来很大困难。
与形态学标记相比, 分子标记能对各发育时期的个体、组织、器官甚至细胞做检测, 既不受环境的影响, 也不受基因表达与否的限制, 数量丰富, 遗传稳定, 对生物体的影响表现为“中性”[4]。分子标记的所有这些特性, 奠定其广泛应用前景, 并成为植物新品种测试审查和品种鉴别的重要技术手段[5,6]。早前Tommasini等[7]利用SSR标记对油菜品种特异性的测试表明, SSR标记可作为油菜DUS测试体系的有效补充。随后, Arens等[8]在番茄上开发8个与抗性高度相关的分子标记, 并用于番茄品种特异性鉴定。结果表明, 该套标记具有满足品种DUS测试要求的潜力, 可作为当前DUS测试中抗性鉴定的补充方法。近期, Jones和Mackay[9]通过高密度SNP标记分析大麦品种的基因型并预测其DUS性状表明, 基因型预测在大麦特异性鉴定上具有一定的可行性。
尽管分子标记在品种鉴别上发挥重要作用, 但目前分子标记仍未能取代形态学性状, 单独用于DUS测试中申请品种的特异性鉴定。这是由于分子标记与形态学性状之间尚不具备足够的相关性。品种之间的DNA指纹即使存在差异, 其形态表现也可能相同; 而在某些情况下, 品种之间形态学上尽管存在很大差异, 也可能具有相同的DNA指纹, 如突变体。此外, 根据UPOV公约的要求, 新品种申请保护除了要求特异性之外, 还必须要求一致性和稳定性, 而关于一致性的分子验证问题, 由于DNA检测技术的灵敏性较高, 难于发现在所有的标记位点都稳定的品种, 因此, 利用分子标记鉴定品种一致性的标准可能较田间表型一致性的标准要低。但是合适的标准和接受概率如何确定, 对于杂交种来说目前仍是一个难题。此外, 对于一致性的确定应该选用多少个体, 是否和DUS 测试需要的田间检测样本相同, 如何判别差异个体的容许误差等, 都仍需在实践中探索[10]。
由于分子标记单独应用于DUS测试仍存在诸多技术难题, 形态学性状和分子标记的结合将是近期DUS测试研究的主要方向。将分子标记和形态指标综合利用起来描述PVP (Plant Variety Protection)当中的品种性状, 既有利于认识品种之间的遗传关系, 也可以满足植物新品种保护中明确分类的需要。
鉴于此, 本研究拟同时利用形态学性状和分子标记分析南方花生区试品种的遗传多样性, 并通过聚类分析鉴定花生品种的特异性, 为花生DUS测试中近似品种的快速筛选以及品种质量管理提供技术支撑。
1 材料与方法
1.1 材料
选用1999—2015年南方花生区试品种(表1), 共101个, 由广东省农业科学院作物研究所提供。Table 1
表1
表1供试品种数量及来源
Table 1
| 品种 Variety | 数量 Number | 育种单位 Breeding unit | 省份 Province |
|---|---|---|---|
| 粤油系列 YY series | 16 | 广东省农业科学院作物研究所 Crops Research Institute, Guangdong Academy of Agricultural Sciences | 广东 Guangdong |
| 航花系列 HH series | 2 | 广东省农业科学院作物研究所 Crops Research Institute, Guangdong Academy of Agricultural Sciences | 广东 Guangdong |
| 汕油系列 SY series | 10 | 汕头市农业科学研究所 Shantou Agricultural Science Research Institute | 广东 Guangdong |
| 仲恺花系列 ZKH series | 8 | 仲恺农业工程学院 Zhongkai University of Agriculture and Engineering | 广东 Guangdong |
| 湛油系列 ZY series | 9 | 湛江市农业科学研究院 Zhanjiang Academy of Agricultural Sciences | 广东 Guangdong |
| 泉花系列 QH series | 8 | 泉州市农业科学研究所 Quanzhou Agricultural Science Research Institute | 福建 Fujian |
| 闽花系列 MH series | 8 | 福建农林大学 Fujian Agriculture and Forestry University | 福建 Fujian |
| 金花系列 JH series | 2 | 福建农林大学 Fujian Agriculture and Forestry University | 福建 Fujian |
| 龙花系列 LH series | 7 | 龙岩市农业科学研究所 Longyan Agricultural Science Research Institute | 福建 Fujian |
| 莆花系列 PH series | 5 | 莆田市农业科学研究所 Putian Agricultural Science Research Institute | 福建 Fujian |
| 福花系列 FH series | 3 | 福建省农业科学院作物研究所 Crops Research Institute, Fujian Academy of Agricultural Sciences | 福建 Fujian |
| 桂花系列 GH series | 11 | 广西农业科学院经济作物研究所 Cash Crops Research Institute, Guangxi Academy of Agricultural Sciences | 广西 Guangxi |
| 贺油系列 HY series | 8 | 贺州市农业科学研究所 Hezhou Agricultural Science Research Institute | 广西 Guangxi |
| 湘花系列 XH series | 2 | 湖南农业大学 Hunan Agricultural University | 湖南 Hunan |
| 云花系列 YH series | 2 | 云南省农业科学院经济作物研究所 Cash Crops Research Institute, Yunnan Academy of Agricultural Sciences | 云南 Yunnan |
新窗口打开|下载CSV
1.2 试验方法
1.2.1 形态学性状调查 2016年3月至2017年8月在华南农业大学五山试验基地按随机区组设计和种植试材, 每个小区畦长3 m, 畦面宽1.4 m, 行距25 cm, 株距20 cm, 重复2次。每个品种以40株为样本, 按农业行业标准NY/T 2237-2012 [11]调查29个形态学性状, 其中质量性状9个、假质量性状3个、数量性状17个。通过目测调查质量性状和假质量性状, 以1/2、1/2/3或者1/9级记录; 用直尺或游标卡尺测量长度, 电子秤测量质量, 对照标准品种, 按1~9级记录。1.2.2 DNA提取方法 取花生幼叶, 采用新型快速植物基因组DNA提取试剂盒(DP3111, BioTeke, 中国)提取花生基因组DNA。以1%琼脂糖凝胶电泳检测DNA质量, 用超微量分光光度计Nanodrop 2000 (Thermo Scientific, USA)检测样本浓度。将所有样本DNA用无菌水统一稀释至25 ng μL-1, -20℃保存备用。
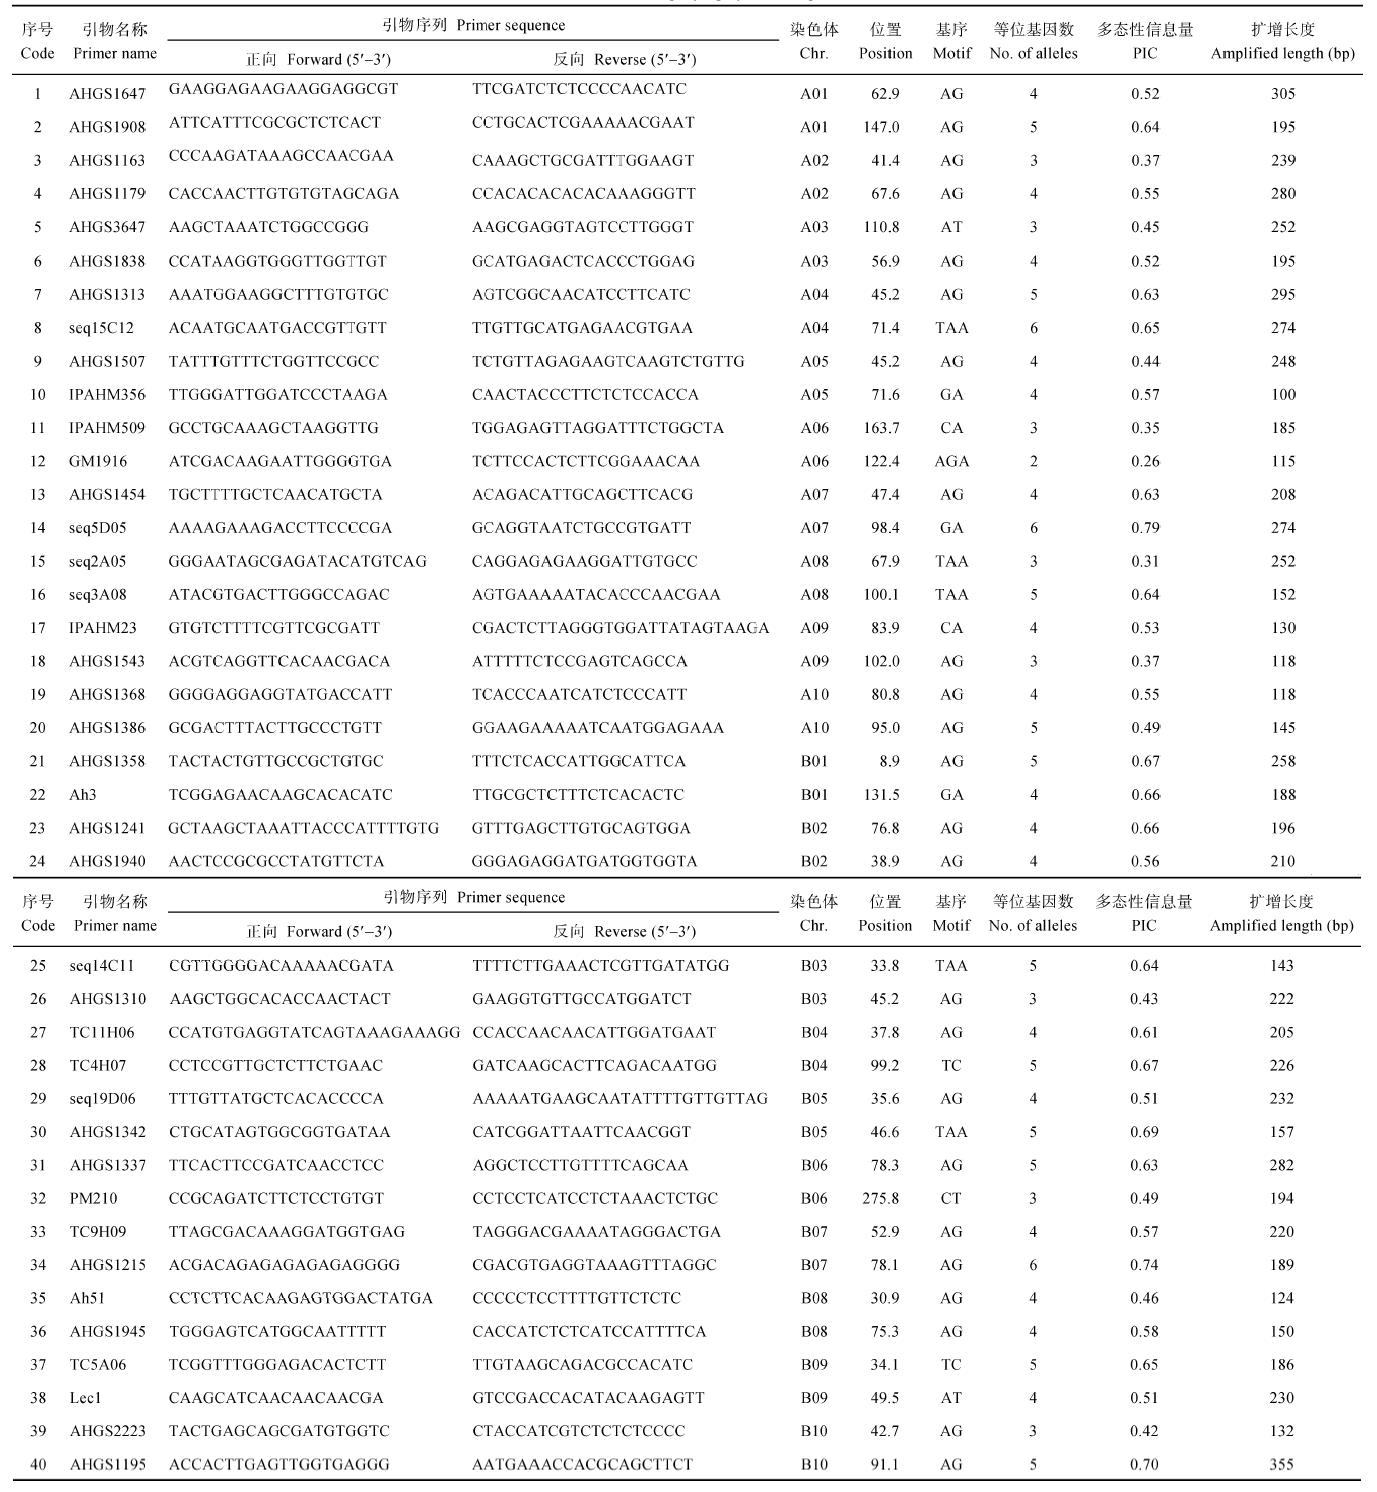
1.2.3 SSR标记选择及PCR检测 从Shirasawa等[12]构建的包含3693个标记的花生栽培种综合遗传图谱中筛选出40个多态性高、扩增稳定、带型清晰的SSR标记(每个染色体2个), SSR引物由北京六合华大基因科技股份有限公司合成。
PCR反应体系为10 μL, 包含DNA模板1 μL、2×Power Taq PCR MasterMix (PR1702, BioTeke, 中国) 5 μL、上下游引物各0.4 μL、无菌水3.2 μL。PCR扩增程序为95℃预变性5 min; 95℃变性30 s, 55℃退火30 s, 72℃延伸30 s, 35个循环; 72℃延伸10 min, 扩增产物经Fragment Analyzer全自动毛细管电泳系统(FSV2-CE, AATI, USA)检测后将数据结果自动存于ProSize 2.0系统软件。
1.3 数据统计与分析
基于形态学性状调查数据构建品种-形态学性状的1-0矩阵, 其中某个性状第i个级别上出现的品种记为1, 反之则记为0。形态学性状的多样性指数计算公式为$D=1-\sum\limits_{i=1}^{k}{P_{i}^{2}}$, 其中D为Simpson多样性指数, Pi为某个性状第i个级别的材料数占总材料数的百分比。基于SSR-PCR扩增数据构建品种-SSR标记的1-0矩阵, 其中SSR扩增谱带在相同迁移率位置上有带记为1、无带记为0。SSR多态性信息量$\text{PIC}=1-\sum\limits_{i=1}^{k}{P_{i}^{2}}$, 其中Pi为基因座位上第i等位基因的频率。
用NTSYS-pc2.11软件分析数据, 在Similarity模块中选择Qualitative data分别对形态学性状和SSR标记的原始矩阵求遗传相似系数(genetic simi larity, GS), 并获得相应的GS矩阵。在Clustering模块中选择SAHN采用UPGMA进行聚类分析, 并通过Tree plot模块生成聚类图。在Graphics模块中选择Matrix comparison plot对形态学性状和SSR标记的相似系数矩阵之间的相关性进行Mantel检验。
2 结果与分析
2.1 形态学性状多样性分析
对101个花生品种29个表型性状进行描述性统计(表2)表明, 有7个形态学性状(植株开花习性、主茎开花习性、小叶性状、花冠颜色、植株生长习性、荚果籽仁数、种皮颜色数量)在供试品种间无多样性, 其余22个性状Simpson多样性指数为0.23~0.77, 平均为0.43, 多样性指数最高的性状为百仁重。Table 2
表2
表2供试品种的形态学性状特征
Table 2
| 序号 No. | 形态学性状 Morphological trait | 性状代码 Code of traits | Simpson指数 Simpson’s index |
|---|---|---|---|
| 1 | 开花期 Flowering stage | 3/4/5 | 0.31 |
| 2 | 植株: 开花习性 Plant: flowering general pattern | 2 | 0 |
| 3 | 主茎: 开花习性 Main stem: flowering general pattern | 3 | 0 |
| 4 | 叶: 小叶形状 Leaflet :shape | 2 | 0 |
| 5 | 叶: 绿色程度 Leaflet: green degree | 5/6/7 | 0.29 |
| 6 | 花: 花冠颜色 Flower: corolla color | 2 | 0 |
| 7 | 植株: 生长习性 Plant: growth habit | 1 | 0 |
| 8 | 叶: 小叶大小 Leaflet: size | 5/6/7 | 0.36 |
| 9 | 主茎: 花青甙显色 Main stem: anthocyanin coloration | 1/9 | 0.32 |
| 10 | 主茎: 茸毛密度 Main stem: pubescence density | 1/2/3/5/6 | 0.37 |
| 11 | 植株: 主茎高度 Plant: main stem height | 4/5/6 | 0.44 |
| 12 | 植株: 分枝数量 Plant: branching | 3/4 | 0.38 |
| 13 | 植株: 侧枝长度 Plant: side branch length | 4/5/6/7 | 0.43 |
| 14 | 成熟期 Mature period | 4/5/6 | 0.31 |
| 15 | 荚果: 籽仁率Pod: rate of seed produced | 2 | 0 |
| 16 | 植株: 荚果数 Plant: pods number | 3/4/5 | 0.61 |
| 17 | 籽仁: 休眠期 Kernel: dormancy period | 2/3/4/5 | 0.41 |
| 18 | 荚果: 长度 Pod: length | 4/5/6 | 0.59 |
| 19 | 荚果: 缢缩程度 Pod: constrictions degree | 3/4/5/6 | 0.48 |
| 20 | 荚果: 果嘴明显程度 Pod: prominence of beak | 1/2/3/4/5/6 | 0.73 |
| 21 | 荚果: 果嘴形状 Pod: beak shape | 1/2 | 0.24 |
| 22 | 荚果: 表面质地 Pod: surface texture | 2/3/4/5 | 0.46 |
| 23 | 荚果: 出仁率 Pod: kernel percentage | 3/4/5/6 | 0.67 |
| 24 | 籽仁: 百仁重 Kernel: weight per 100 kernels | 1/2/3/4/5/6/7 | 0.77 |
| 25 | 籽仁: 形状 Kernel: shape | 1/2 | 0.23 |
| 26 | 籽仁: 种皮颜色数量 Kernel: testa color number | 1 | 0 |
| 27 | 籽仁: 种皮颜色 Kernel: testa color | 2/4 | 0.38 |
| 28 | 籽仁: 种皮裂纹 Kernel: testa crack | 1/2/3/4/5 | 0.52 |
| 29 | 籽仁: 种皮内表面颜色 Kernel: endortesta color | 1/2 | 0.23 |
新窗口打开|下载CSV
尽管总体上花生品种的形态学性状存在一定的多样性, 但同一育种机构育成的花生品种表型较相似, 遗传多样性低。例如“粤油”系列品种多数具有植株偏矮、叶色深绿、生育期中等、荚果大、果纹深、籽仁率偏低、荚果缢缩程度弱等特点。
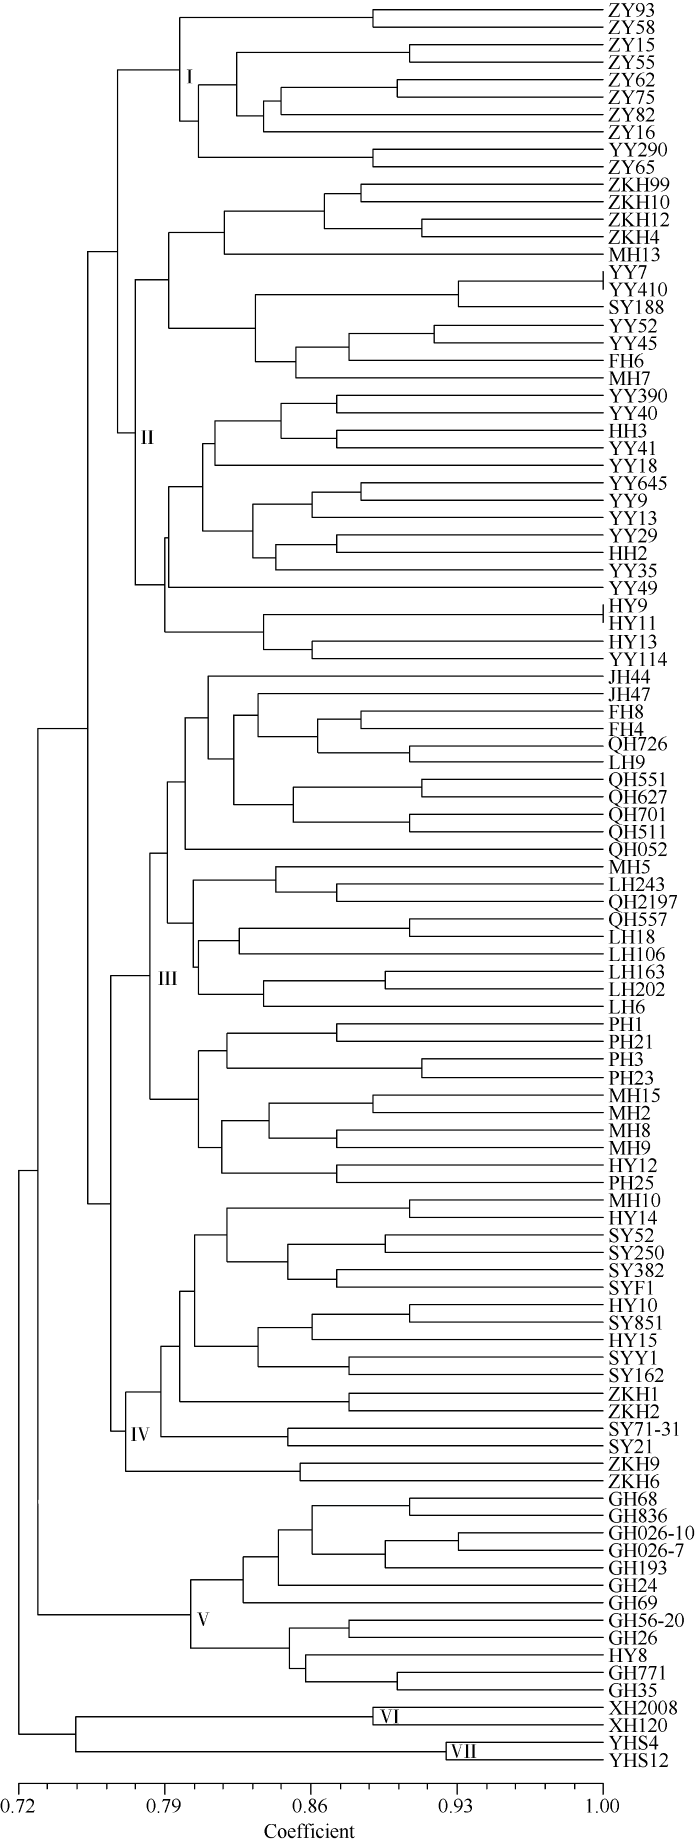
利用22个具有多样性的形态学性状对供试品种进行聚类分析, 从图1可知, 在相似系数为0.76处, 可将供试品种划分为七大类群, 类群I包含10个品种, 其中“湛油”系列品种9个、“粤油”1个。类群II包含28个品种, 其中“粤油”15个、“仲恺花”4个、“贺油”3个、“闽花”和“航花”各2个、“汕油”和“福花”各1个。类群III包含30个品种, 其中“泉花”8个、“龙花”7个、“莆花”和“闽花”各5个、“福花”和“金花”各2个、“贺油”1个。类群IV包含17个品种, 其中“汕油”9个、“仲恺花”4个、“贺油”3个、“闽花”1个。类群V包含12个品种, 其中“桂花”11个、“贺油”1个。类群VI和类群VII各包含2个品种, 分别为“湘花120”、“湘花2008”和“云花生4号”、“云花生12号”。同一育种机构育成的花生品种倾向于聚在一起, 例如湖南农业大学和云南省农业科学院分别育成的“湘花”和“云花生”系列品种均单独聚为一类, 广西农业科学院经济作物研究所育成的11个“桂花”品种均聚在一起, 湛江市农业科学研究院育成的9个“湛油”品种也聚为一类。此外, 同一省份的花生品种也倾向于聚在一起。例如, 类群III包含30个品种, 其中29个来自福建省。类群II包含29个品种, 其中22个来自广东省。
图1
 新窗口打开|下载原图ZIP|生成PPT
图1形态学性状聚类分析图
Fig. 1Cluster dendrogram based on the morphological traits
2.2 SSR多态性分析
利用40个多态性高、带型容易识别的SSR标记对101个供试品种基因组DNA进行扩增, 共检测出167个等位基因, 单个标记检测的等位基因数为2~6个, 平均为4.18个。标记的多态性信息量(PIC)差异较大, 最大为0.79, 最小为0.26, 平均为0.55 (表3)。Table 3
表3
表3SSR引物扩增情况
Table 3
 |
新窗口打开|下载CSV
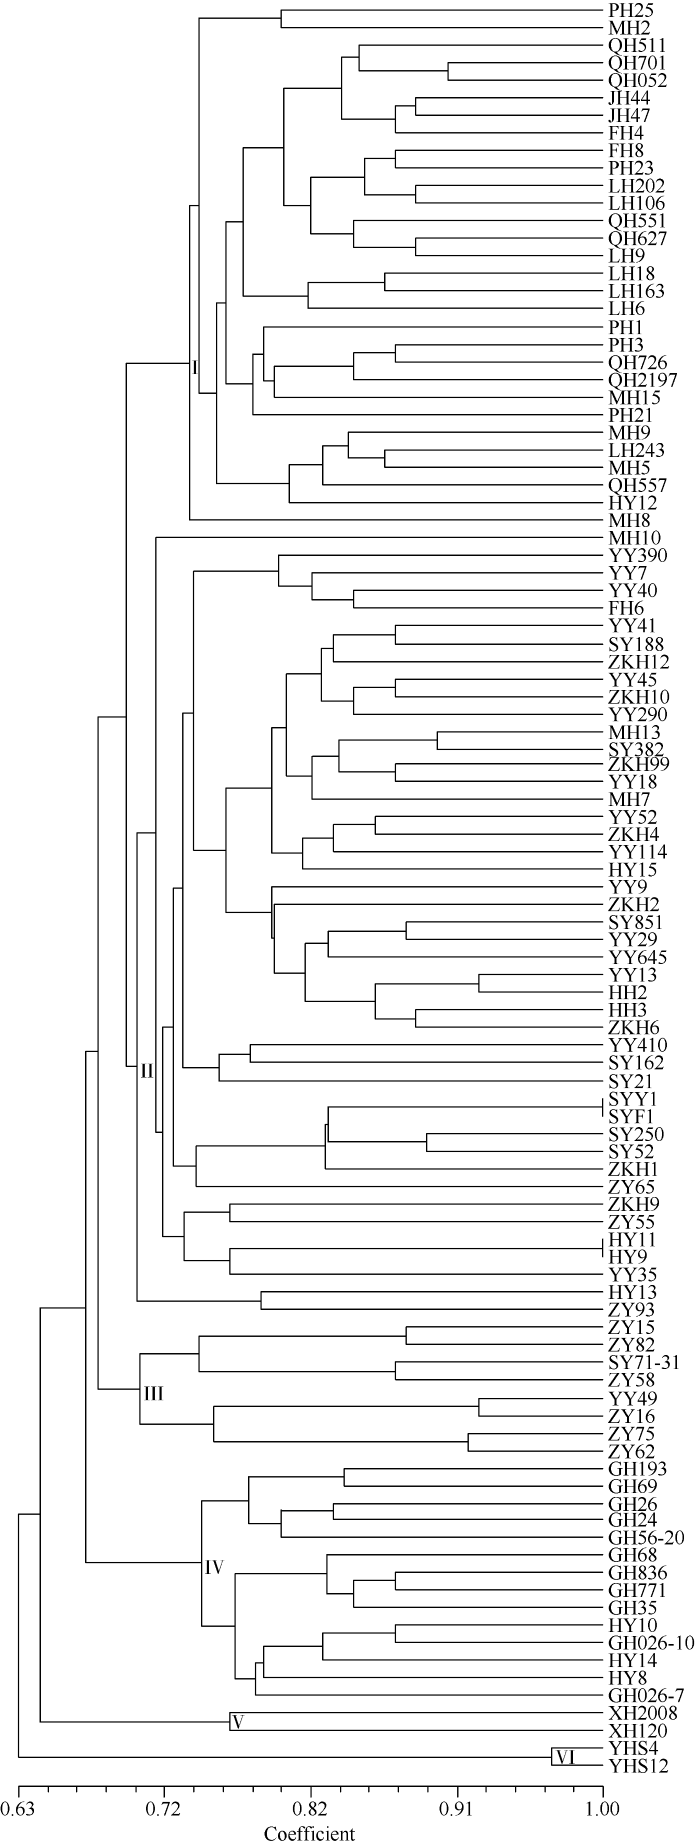
基于40对SSR引物扩增的167个等位基因, 对101个花生品种进行聚类分析。由图3可知, 在相似系数为0.70处, 供试材料可被划分为六大类群。类群Ⅰ包含30个花生品种, 其中“泉花”系列品种8个、“龙花”7个、“莆花”和“闽花”各5个、“福花”和“金花”各2个、“贺油”1个。类群II包含45个品种, 其中“粤油”15个、“汕油”品种9个、“仲恺花”8个、“贺油”4个、“湛油”和“闽花”各3个、“航花”2个、“福花”1个。类群Ⅲ包含8个品种, 其中“湛油”6个、“粤油”和“汕油”各1个。类群IV包含14个品种, 其中“桂花”11个、“贺油”3个。类群V包含2个品种, 分别为“湘花120”和“湘花2008”。类群VI也只包含2个品种, 分别为“云花生4号”和“云花生12号”。同一省份育成的品种倾向于聚为一类。例如类群I有27个品种来自福建省, 类群II有37个品种来自广东省, 而类型III、IV、V、VI中的品种则分别来自广东省、广西壮族自治区、湖南省和云南省。
图3
 新窗口打开|下载原图ZIP|生成PPT
图3形态学性状和SSR标记遗传相似性系数矩阵比较
Fig. 3Comparison of genetic similarity coefficient matrix between morphological traits and SSR markers
2.3 花生品种特异性鉴定
比较形态学性状和SSR标记的聚类结果发现, 两者在总体上倾向一致, 同一地方育种的品种多聚为一类。但具体到品种与品种间的遗传相似性, 两者却存在较大差异。供试品种之间的形态学性状相似系数为0.62~1.00, 平均为0.75, SSR标记相似系数为0.55~1.00, 平均为0.70。经Mantel检验, 供试品种间的形态学性状相似系数与SSR标记相似系数的相关性弱(r = 0.36)(图3), 说明通过形态学和SSR鉴定品种的特异性, 结果将不完全一致。由图1和图2可知, 通过形态学和SSR可区分的品种均为97个, 无法区分的品种为4个。其中“贺油11”与“贺油9号”均无法通过形态学和SSR区分(品种间的相似系数=1.00), 而“粤油7号”和“粤油410”能通过SSR区分, 但不能通过形态学区分, 相反, “汕油诱1号”与“汕油辐1号”能通过形态学区分, 但不能通过SSR标记区分。图2
 新窗口打开|下载原图ZIP|生成PPT
图2SSR标记聚类分析图
Fig. 2Cluster dendrogram based on the SSR markers
由于“贺油11”与“贺油9号”在形态学和SSR标记上均没有显著性差异, 初步推断为同一品种。尽管“粤油7号”和“粤油410”在形态学上相同(“粤油7号”为“粤油410”母本), 但SSR标记存在差异, 共检测出9个差异位点, 品种间的相似系数为0.83, 因此可判断“粤油7号”和“粤油410”为不同花生品种。此外, “汕油诱1号”和“汕油辐1号”是“汕油212”分别通过EMS (甲基磺酸乙酯)化学诱变和Co(钴)辐射诱变选育出来的品种, SSR检测发现2个品种的DNA指纹一致。但由于两者在形态学上存在较大差异, 相似性系数仅为0.73, 通过形态学可区分开来, 因此, 综合SSR和形态学信息, 可判断“汕油诱1号”和“汕油辐1号”是来自“汕油212”的突变体。
3 讨论
3.1 花生品种的遗传多样性
本研究调查供试品种的29个形态学性状, 结果有7个性状无遗传多样性, 其余性状的Simpson多样性指数平均仅为0.43。说明当前培育的品种在表型上存在同质化趋势。相比之下, 40个SSR标记均能在区试品种中检测出多态性, 且多态性信息量平均为0.55, 远高于形态学性状的Simpson多样性指数(两者计算公式一致)。本研究中SSR标记比形态学性状的遗传多样性更丰富, 其原因之一可能是形态学性状在育种过程中受到强烈的人工选择, 而SSR标记无法通过肉眼观察, 在育种过程中受到人工选择的影响较小。形态学聚类显示, 同一单位培育的品种倾向于聚在一起。造成这种局面的原因有2个: (1) 品种存在亲缘关系。分析历年南方花生区试品种的系谱发现, 多数区试品种的亲本之一为参试单位早期培育的品种, 同一单位培育的品种普遍存在亲缘关系。(2) 不同育种单位的选育方法和目标不同。不同育种单位在长期的育种过程中形成了自己的育种经验, 对目标性状的选择存在偏好, 容易培育出自家特色的花生品种。例如汕头市科学研究所倾向于选择株型直立、茎秆纤细、成熟期底部落叶明显、中果型、果多、果纹中等、结荚集中的品种。
3.2 花生品种特异性鉴定
分子标记与形态学性状之间不具备足够的相关性是当前分子标记单独应用于植物新品种特异性鉴定的瓶颈。由于形态学性状多为数量性状, 受微效多基因控制, 而SSR标记通常位于基因组中的非转录区, 被认为是“中性“标记, 不具备明显的生物学功能。因此, 理论上寻找与形态学性状高度相关的SSR标记存在很大难度。本研究通过Mantel检验发现品种间的形态学性状相似系数与SSR标记相似系数的相关性很弱(r = 0.36), 说明供试的SSR标记暂时无法取代形态学性状, 单独用于花生品种的特异性鉴定。近年来有多项研究表明, 分子标记和形态学性状可在植物分类[13]、品种鉴别[14]和遗传多样性分析[15,16]中起到互补作用, 尤其对种子真实性鉴定、同种异名和异种同名鉴别[17,18]。理论上, 常规杂交育种过程中, 亲本染色体的重组、交换使杂交后代在遗传组成上几乎有无限多的可能性。但由于品种的选育多集中在产量、品质、抗性、株型等性状上, 导致与上述性状连锁紧密的DNA标记位点的多态性降低。然而在花生基因组中仍存在着大量与上述性状不在同一染色体上或连锁不紧密的DNA标记位点, 其多态性可以将通过常规杂交育种手段选育出的品种区分开。例如本研究中用形态学性状没法将“粤油7号”和“粤油410”区分开, 但用SSR标记则能清晰地鉴定出来。但DNA标记在品种的特异性鉴定上并非万能, 对于一些突变体, 特别是点突变体, 有时就无法利用DNA标记区分开[17]。相反, 这时根据表型突变性状, 能轻易与其他品种区分开。例如本研究中SSR标记无法区分突变体“汕油诱1号”和“汕油辐1号”, 通过形态学性状则可轻易将其区分开。因此, 综合形态学信息和DNA标记信息能有效提高品种特异性鉴定的准确性。
4 结论
南方花生区试品种形态学性状的遗传多样性比SSR标记低, 同一育种单位或者同一省份的品种倾向于聚在一起。花生SSR标记与形态学性状不具备足够的相关性, 暂时无法取代形态学性状单独用于品种特异性鉴定, 但两者相结合能有效提高花生品种特异性鉴定的准确性。参考文献 原文顺序
文献年度倒序
文中引用次数倒序
被引期刊影响因子
URL [本文引用: 1]
URL [本文引用: 1]
[本文引用: 1]
[本文引用: 1]
DOI:10.7505/j.issn.1007-9084.2017.04.019URL [本文引用: 1]

本文对近十年来南方产区花生生产情况进行归纳总结,深入剖析了南方产区花生生产变化趋势,解析了影响南方产区花生产量增长的主要因素.结合多年来南方产区参试品种的区试数据,从产量、植株性状、荚果性状、抗病性和品质性状多方面分析了我国南方产区花生育种现状;总结了多年来南方产区花生育种存在的主要问题,并针对这些问题,从育种方法和育种亲本寻找原因;最后,对南方产区花生育种提出了一些建议,为今后我国南方花生遗传改良提供参考.
DOI:10.7505/j.issn.1007-9084.2017.04.019URL [本文引用: 1]
本文对近十年来南方产区花生生产情况进行归纳总结,深入剖析了南方产区花生生产变化趋势,解析了影响南方产区花生产量增长的主要因素.结合多年来南方产区参试品种的区试数据,从产量、植株性状、荚果性状、抗病性和品质性状多方面分析了我国南方产区花生育种现状;总结了多年来南方产区花生育种存在的主要问题,并针对这些问题,从育种方法和育种亲本寻找原因;最后,对南方产区花生育种提出了一些建议,为今后我国南方花生遗传改良提供参考.
DOI:10.1007/978-1-4939-1966-6URL [本文引用: 1]
[本文引用: 1]
DOI:10.1007/s00122-012-2024-2URLPMID:23232576 [本文引用: 1]
AbstractDevelopments in high-throughput genotyping provide an opportunity to explore the application of marker technology in distinctness, uniformity and stability (DUS) testing of new varieties. We have used a large set of molecular markers to assess the feasibility of a UPOV Model 2 approach: alibration of threshold levels for molecular characteristics against the minimum distance in traditional characteristics . We have examined 431 winter and spring barley varieties, with data from UK DUS trials comprising 28 characteristics, together with genotype data from 3072 SNP markers. Inter varietal distances were calculated and we found higher correlations between molecular and morphological distances than have been previously reported. When varieties were grouped by kinship, phenotypic and genotypic distances of these groups correlated well. We estimated the minimum marker numbers required and showed there was a ceiling after which the correlations do not improve. To investigate the possibility of breaking through this ceiling, we attempted genomic prediction of phenotypes from genotypes and higher correlations were achieved. We tested distinctness decisions made using either morphological or genotypic distances and found poor correspondence between each method.
DOI:10.1007/s00122-002-1125-8URLPMID:12671758 [本文引用: 1]
To assess the potential of multiplex SSR markers for testing distinctness, uniformity and stability of rape ( Brassica napus L.) varieties, we developed three multiplex SSR sets composed of five markers each. These were used to measure the extent of diversity within and between a set of ten varieties using a fluorescence-based semi-automated detection technology. Also, we evaluated the significance of any correlation between SSRs, pedigree and five of the morphological characters currently used for statutory distinctness, uniformity and stability testing of rape varieties. An assignment test was allowed to identify 99% of the plants examined, with the correct variety based on the analysis of 48 individual plants for each variety. Principal coordinate analysis confirmed that a high degree of separation between varieties could be achieved. Varieties were separated in three groups corresponding to winter, spring and forage types. These results suggested that it should be possible to select a set of markers for obtaining a suitable separation. Diversity within varieties varied considerably, according to the variety and the locus examined. No significant correlation was found between SSR and morphological data. However, genetic distances measured by SSRs were correlated to pedigree. These results suggested that SSRs could be used for pre-screening or grouping of existing and candidate varieties, allowing the number of varieties that need to be grown for comparison to be reduced. Multiplex SSR sets gave high-throughput reproducible results, thus reducing the costs of SSR assessment. Multiplex SSR sets are a promising way forward for complementing the current variety testing system in B. napus .
DOI:10.1007/s00122-009-1183-2URLPMID:19855951 [本文引用: 1]
Molecular markers linked to phenotypically important traits are of great interest especially when traits are difficult and/or costly to be observed. In tomato where a strong focus on resistance...
DOI:10.1007/s00122-015-2601-2URL [本文引用: 1]
Key message Alternative methods for genomic prediction of traits and trait differences are compared and recommendations made. We make recommendation
URL [本文引用: 1]
随着分子生物学技术的发展,植物品种分子指纹图谱的建设逐渐成为当前的重要应用领域。综述了DNA指纹数据库建设及辅助植物新品种保护DUS测试进展,综合分析了DNA指纹图谱和分子标记应用于植物新品种保护的优越性和存在的问题,以便更好地服务于新品种DUS测试工作。
URL [本文引用: 1]
随着分子生物学技术的发展,植物品种分子指纹图谱的建设逐渐成为当前的重要应用领域。综述了DNA指纹数据库建设及辅助植物新品种保护DUS测试进展,综合分析了DNA指纹图谱和分子标记应用于植物新品种保护的优越性和存在的问题,以便更好地服务于新品种DUS测试工作。
[本文引用: 1]
[本文引用: 1]
DOI:10.1093/dnares/dss042URLPMID:1744303 [本文引用: 1]
The complex, tetraploid genome structure of peanut (Arachis hypogaea) has obstructed advances in genetics and genomics in the species. The aim of this study is to understand the genome structure of Arachis by developing a high-density integrated consensus map. Three recombinant inbred line populations derived from crosses between the A genome diploid species, Arachis duranensis and Arachis stenosperma; the B genome diploid species, Arachis ipa??nsis and Arachis magna; and between the AB genome tetraploids, A. hypogaea and an artificial amphidiploid (A. ipa??nsis ?? A. duranensis)4??, were used to construct genetic linkage maps: 10 linkage groups (LGs) of 544 cM with 597 loci for the A genome; 10 LGs of 461 cM with 798 loci for the B genome; and 20 LGs of 1442 cM with 1469 loci for the AB genome. The resultant maps plus 13 published maps were integrated into a consensus map covering 2651 cM with 3693 marker loci which was anchored to 20 consensus LGs corresponding to the A and B genomes. The comparative genomics with genome sequences of Cajanus cajan, Glycine max, Lotus japonicus, and Medicago truncatula revealed that the Arachis genome has segmented synteny relationship to the other legumes. The comparative maps in legumes, integrated tetraploid consensus maps, and genome-specific diploid maps will increase the genetic and genomic understanding of Arachis and should facilitate molecular breeding.<br>
DOI:10.3767/003158517X693174URLPMID:5645187 [本文引用: 1]
Based on molecular and morphological data we investigated the taxonomy and phylogeny of the ectomycorrhizal genusTricholomain northern Europe. Our phylogenetic tree confirmed the presence of at least 72 well circumscribed species within the region. Of these, three species, viz.T. boreosulphurescens,T. bryogenumandT. ilkkaeare described as new to science, based on morphological, distributional, ecological and molecular data. Several other terminal branches represent putative cryptic taxa nested within classical species or species groups. Molecular type studies and/or designation of sequenced neotypes are needed in these groups, before the taxonomy can be settled. In general our phylogenetic analysis supported previous suprageneric classification systems, but with some substantial changes. Most notably,T. virgatumand allies were found to belong to sect.Tricholomarather than sect.Atrosquamosa, whileT. focalewas found to be clearly nested in sect.Genuinarather than in sect.Caligata. In total, ten sections are accepted, with five species remaining unassigned. The combination of morphological and molecular data showed pileus colour, pileipellis structure, presence of clamp connections and spore size to be rather conservative characters within accepted sections, while the presence of a distinct ring, and especially host selection were highly variable within these.
DOI:10.1007/BF03195609URLPMID:18436990 [本文引用: 1]
The distinctness, uniformity and stability (DUS) requirements involve expensive, space- and time-consuming measurements of morphological traits. Moreover, for a majority of traits, interactions between genotype and environment complicate the evaluation. Molecular markers have a potential to facilitate this procedure, increase the reliability of decisions, and substantially save the time and space needed for experiments. We chose 25 varieties of pea ( Pisum sativum L.) from the list of recommended varieties for cultivation in the Czech Republic, and made both a standard classification by 12 morphological descriptors and a classification by biochemical-molecular markers. Two isozyme systems, 10 microsatellite loci, 2 retrotransposons for multilocus inter-retrotransposon amplified polymorphism (IRAP), and 12 retrotransposon-based insertion polymorphism (RBIP) DNA markers were analysed. The main objective of the study was to examine the potential of each method for discrimination between pea varieties. The results demonstrate a high potential and resolving power of DNA-based methods. Superior in terms of high information content and discrimination power were SSR markers, owing to high allelic variation, which was the only biochemical-molecular method allowing clear identification of all varieties. Retrotransposon markers in RBIP format proved to be the most robust and easy to score method, while multilocus IRAP produced informative fingerprint already in a single analysis. Isozyme analysis offered a fast and less expensive alternative. The results showed that molecular identification could be used to assess distinctness and complement morphological assessment, especially in cases where the time frame plays an important role. Currently developed pea marker systems might serve also for germplasm management and genetic diversity studies.
[本文引用: 1]
DOI:10.1007/s12298-017-0419-xURLPMID:28461727 [本文引用: 1]
Faba bean (Vicia faba L.) ; Genetic diversity ; SSR markers ; Population structure
DOI:10.3969/j.issn.1000-6346.2014.06.004URL [本文引用: 2]
利用形态学标记、SSR分子标记技术对市场上广泛种植的甜瓜品种进行分类鉴定。利用形态学聚类分析,得到60份材料间的相似系数为0.73-0.94,在相似系数为0.74处,60份甜瓜材料被分为2类,为薄皮甜瓜和厚皮甜瓜;在相似系数为0.77处,薄皮甜瓜按照单果质量、熟性、果皮底色、芳香气分为4组,实现初步分类。经过SSR标记聚类分析,得到60份材料间的相似系数为0.75-0.95,当相似系数为0.77时,可以将所有供试材料分为6类。利用SSR分子标记技术,为60份不同甜瓜品种构建唯一的指纹图谱。18对SSR引物,每对引物可以检测到4-11条数目不等的多态性条带,平均为8条。多态性信息含量(PIC)平均为0.71,变化范围为0.58-0.88。采用QR编码为60份甜瓜材料构建了唯一的指纹图谱。试验结果表明形态学标记对60份材料实现初步分类,SSR分子标记则能够有效地区别60份材料,并且为建立甜瓜品种的核酸指纹图谱库提供了理论数据,实现对甜瓜品种进行快速、准确的鉴定。
URL [本文引用: 1]
搜集了设施黄瓜嫁接栽培中常用的47份砧用南瓜种质资源,利用63个形态标记和40对南瓜SSR标记,对其进行遗传多样性及亲缘关系鉴定。结果表明,砧用南瓜的8个质量性状(嫩瓜皮色、瓜形、主蔓色、瓜面斑纹、叶面白斑、叶形、嫩瓜斑纹和嫩瓜斑纹色)和23个数量性状的多样性指数大于1.00;SSR标记共检测到167个等位变异,平均每个SSR位点的等位基因数为4.18个,变幅2~8个,平均多样性指数为0.62,变化范围0.16~1.18。非加权算术平均法(UPGMA)聚类分析表明,砧用南瓜63个形态学性状将47份种质划分为4个类群,大部分品种集中于一个类群中;40对多态性SSR标记将所有种质划分为3个类群,大部分品种的分子标记与形态学标记的聚类结果相似。已搜集的47份砧用南瓜种质资源遗传多样性并不丰富,亲缘关系较近;SSR标记CMTm11具有极高的多态性,可用于砧用南瓜种质分子标记辅助选择;嫩瓜皮色等8个质量性状和大部分数量性状都可以作为形态标记辅助种质资源评价及新品种选育。
