全文HTML
--> --> -->基于动态变化的激光散斑宽场照明实现的动态散斑照明荧光显微技术(dynamic speckle illumination fluorescence microscopy, DSIFM)是一种在宽场照明条件下, 快速获取具有高时空分辨率的生物组织和活体细胞三维结构荧光层析图像的有效方法[10-13]. 在使用DSIFM获取荧光层析图像的过程中, 散斑颗粒度和重构层析图像所需采集的原始图像数量是影响图像质量和成像时间的关键因素. 本论文基于DSIFM的成像原理, 理论分析了基于动态变化的散斑宽场照明, 获取待测生物样品高空间分辨率荧光层析图像的过程. 在此基础上, 模拟仿真了在DSIFM技术中不同颗粒度和原始荧光图像数量两个主要的技术参数, 对获取不同尺寸待测样品的荧光层析图像的成像质量, 包括图像对比度和空间分辨率的影响. 模拟仿真结果对于有效提高系统成像质量, 缩短成像时间具有重要的参考价值和指导意义.


通过改变激光光束通过散射体的位置, 即可在显微物镜视场范围内形成一系列光强分布随机变化的照明散斑图案. 随着照明散斑图案的不断变化, 在样品中焦平面上激发产生的荧光信号相比于焦平面以外的离焦荧光信号变化更为剧烈. 在样品中纵向位置zc处, CCD相机的每个像素接收到的荧光信号强度变化可以表示为[14]
为求解(2)式表示的荧光信号强度变化量, 在此引入自相关函数定义为


在实际应用中, 为了实现在动态变化的照明散斑图案全场照明的条件下, 消除离焦荧光信号的干扰, 获取具有高空间分辨的焦平面的荧光层析图像, 需要CCD相机采集对应于不同照明散斑图案激发产生的一系列原始荧光图像. 随后, 利用层析图像提取算法, 对原始荧光图像进行处理, 从而重构均方根图像IRMS, 实现层析成像. 经常采用的荧光层析图像提取算法如(5)式所示:

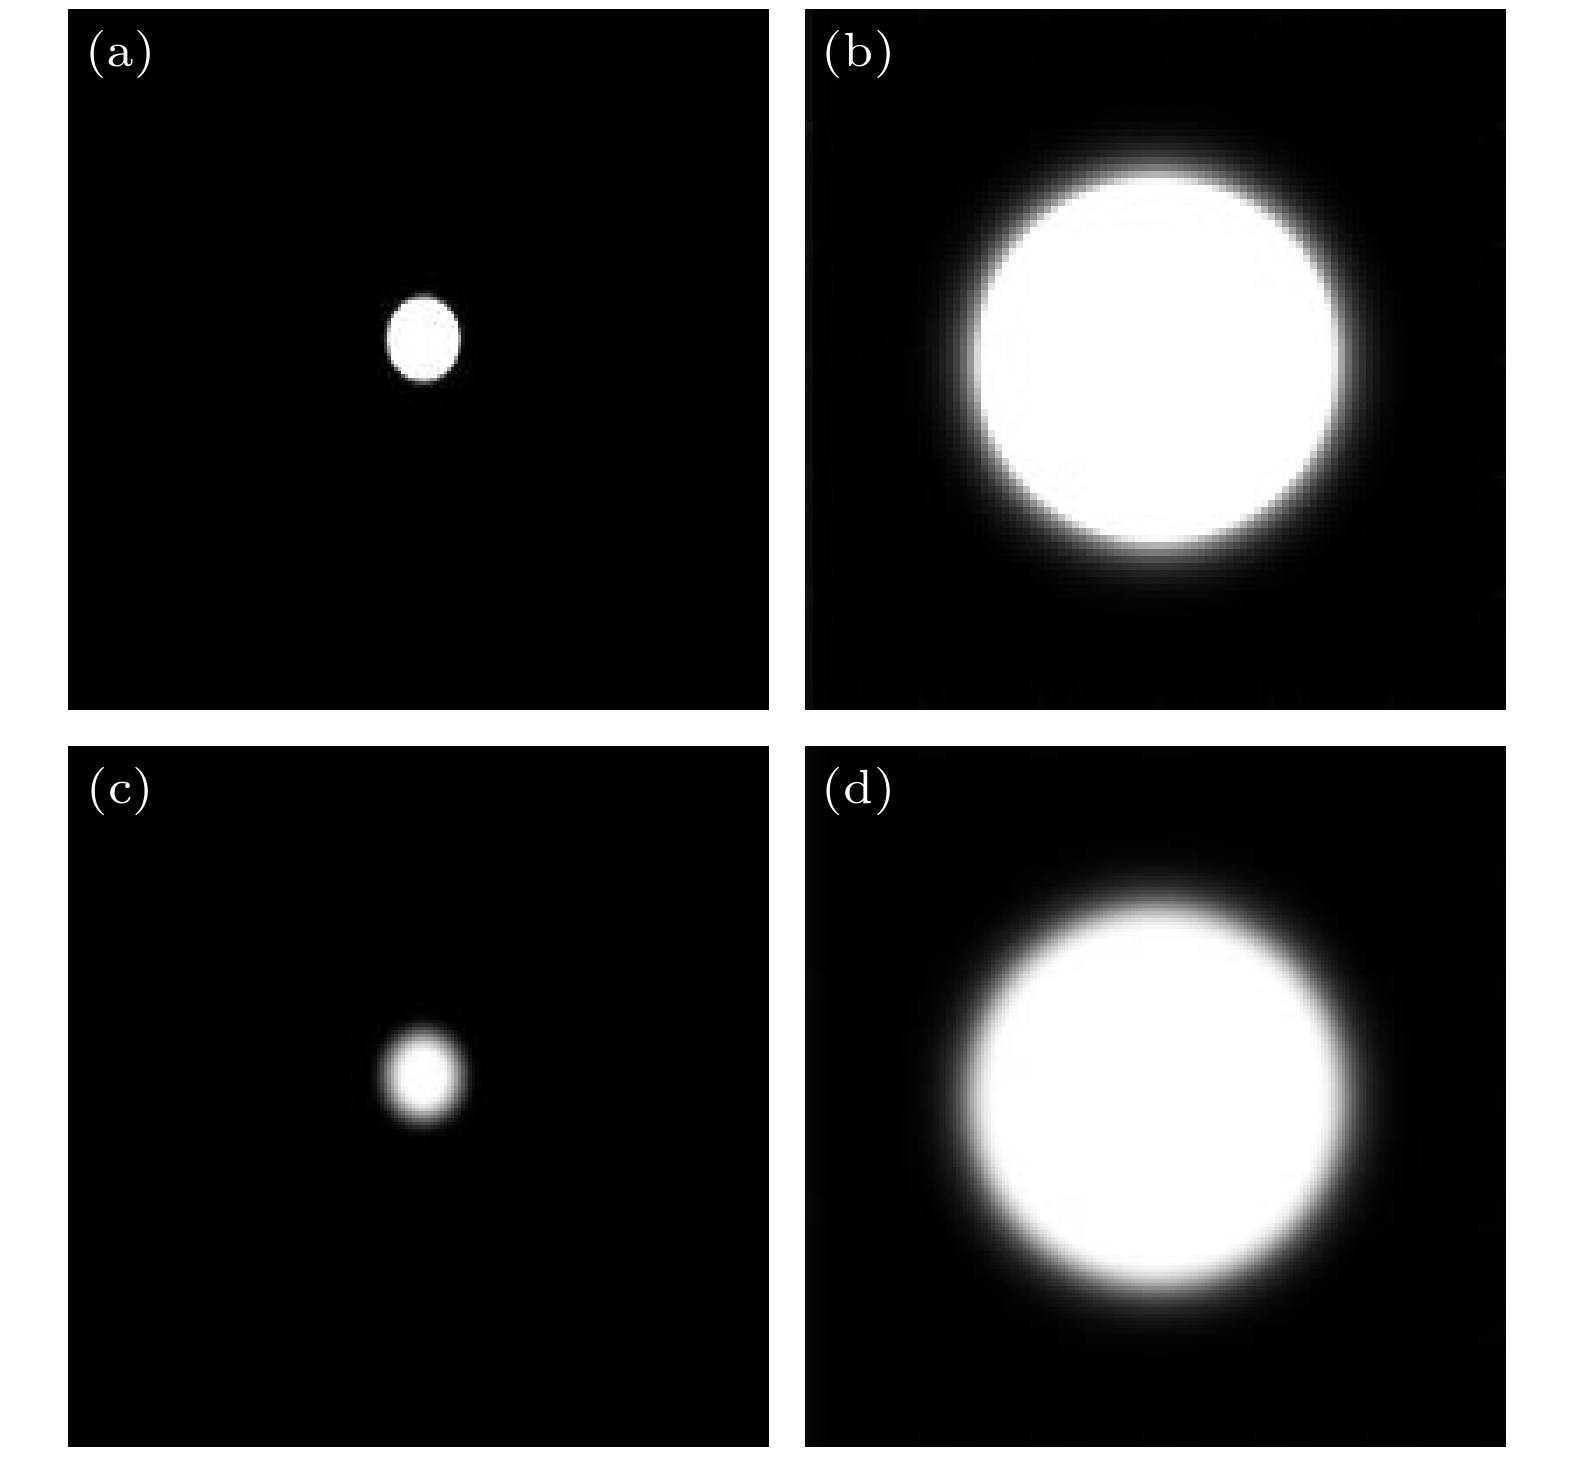 图 1 不同半径的两个小球样品的焦平面荧光图像 R (a), 10R (b) 和离焦荧光图像 R (c), 10R (d)
Figure1. Fluorescence images of focal (a), (b) and defocus (c), (d) planes of two small spherical samples with radii of R and 10R respectively.
当激光光束通过具有不同颗粒度的散射体时, 形成的一系列强度分布不同的照明散斑图案模拟结果如图2所示.
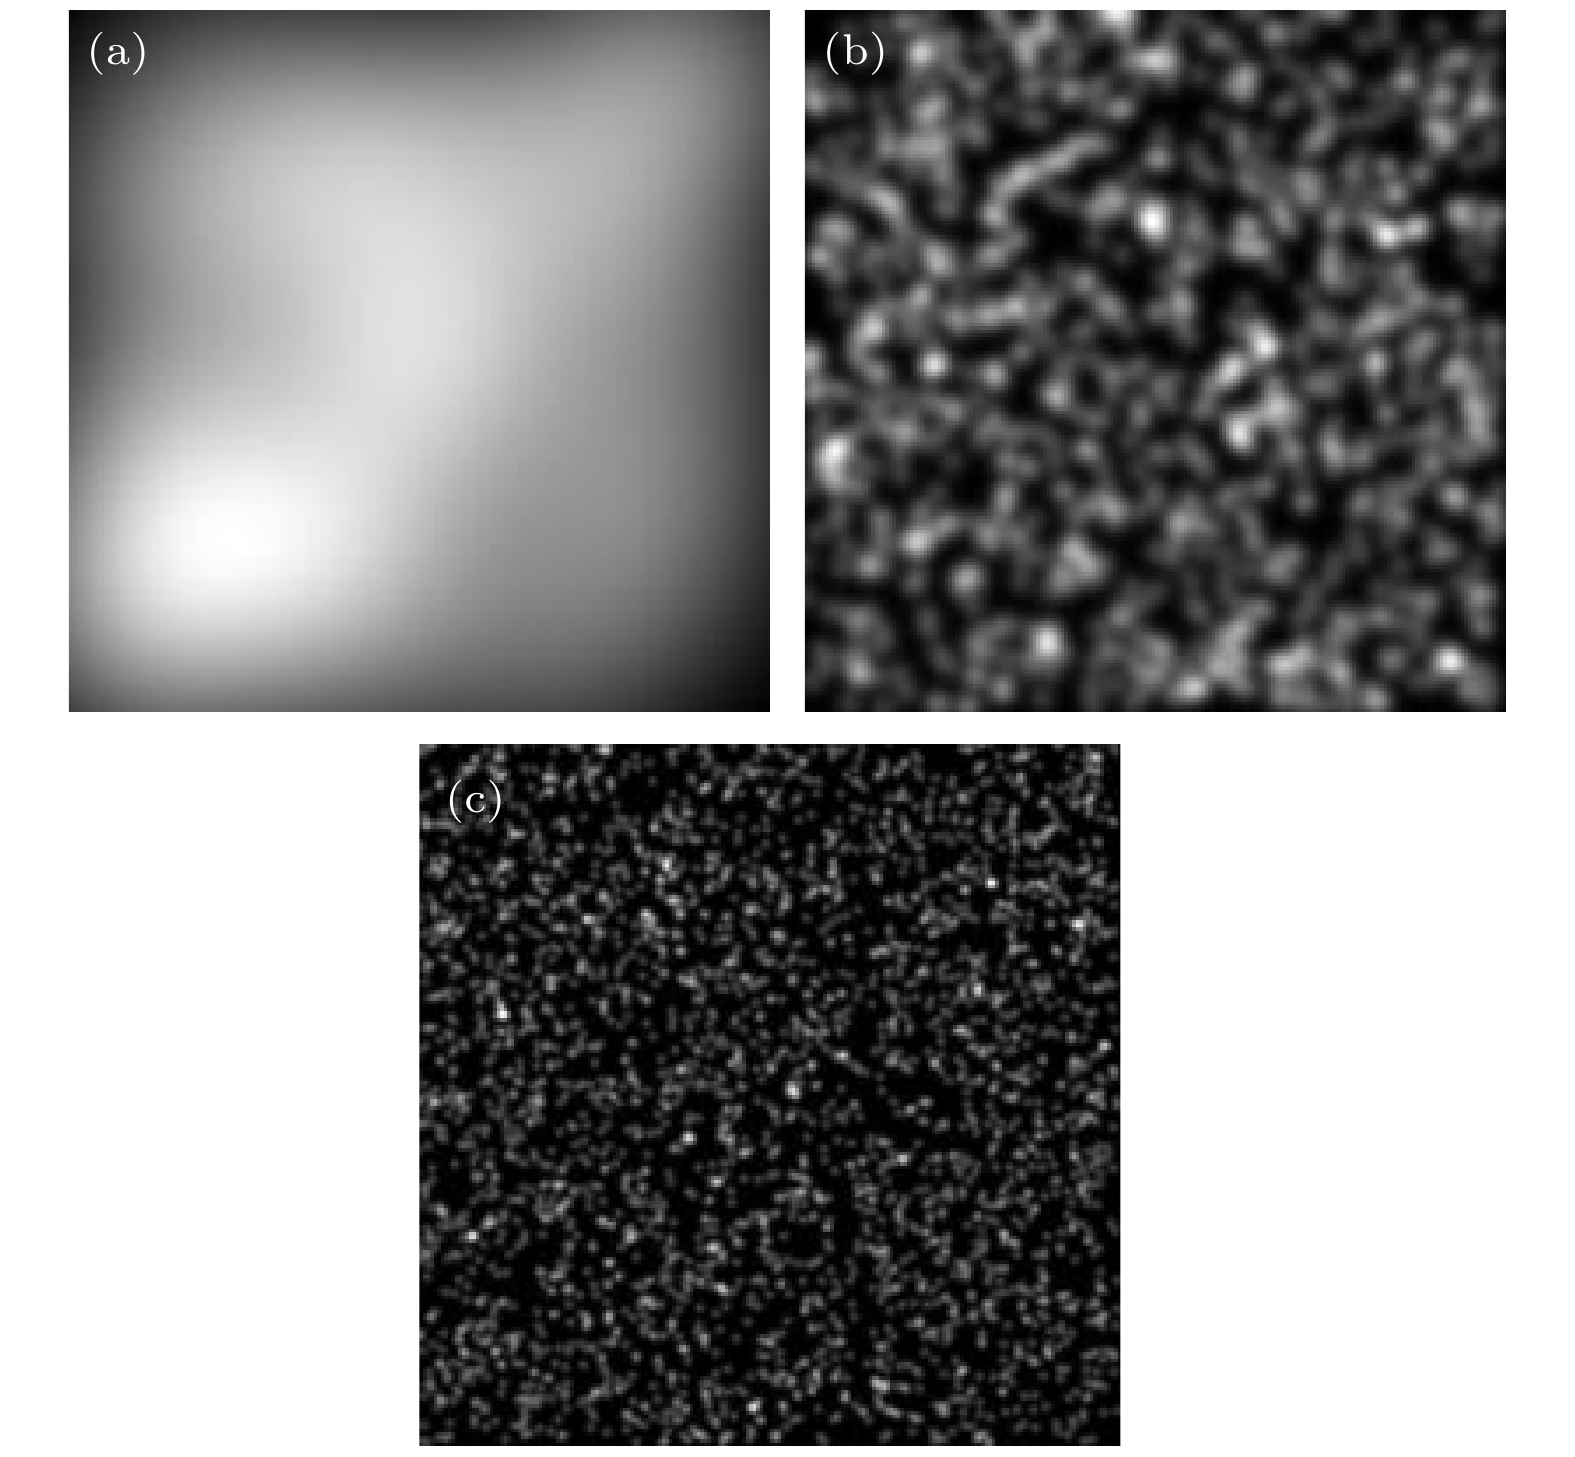 图 2 激光光束通过颗粒度分别为100 (a), 1000 (b)和3000 (c)的散射体形成的照明散斑图案
Figure2. Illumination speckle patterns are formed when a laser beam passes through diffusers with different granularity of 100 (a), 1000 (b) and 3000 (c), respectively.
将模拟仿真生成的不同散斑强度分布的N幅照明散斑图案与具有不同半径的小球样品的离焦图像叠加, 获得照明散斑图案激发小球样品的离焦荧光图像. 随后, 利用层析图像提取算法处理离焦荧光图像, 获得消除离焦背景噪声干扰的荧光层析图像. 利用上述基于动态散斑照明的宽场荧光显微成像技术实现荧光层析成像方法, 分析了当颗粒度为固定值时, 对于不同半径的小球样品, 荧光层析图像的对比度和空间分辨率与原始荧光图像的数量之间的关系. 对于半径为R的小球样品, 当散射体颗粒度固定为G = 1000时, 原始荧光图像的数量N分别为20, 60和200时, 层析图像的模拟仿真结果如图3(a)—(c)所示. 图3(d)—(f)分别为半径为R的小球样品的重构层析图像中心位置处荧光信号归一化强度曲线. 其中, 实线为焦平面上小球样品的荧光信号的归一化强度, 虚线为利用层析图像处理算法处理包含离焦信号的小球样品离焦荧光图像得到的层析图像的荧光信号归一化强度, 即图像对比度. 层析图像的荧光信号归一化强度平均值分别为63.14%, 86.42%和86.21%, 先提高后趋于饱和. 用信号归一化强度曲线的半高全宽(full width at half maximum, FWHM)表示图像的空间分辨率. 由仿真结果可以看出, 重构得到的小球样品的荧光层析图像的空间分辨率与焦平面图像的基本一致.
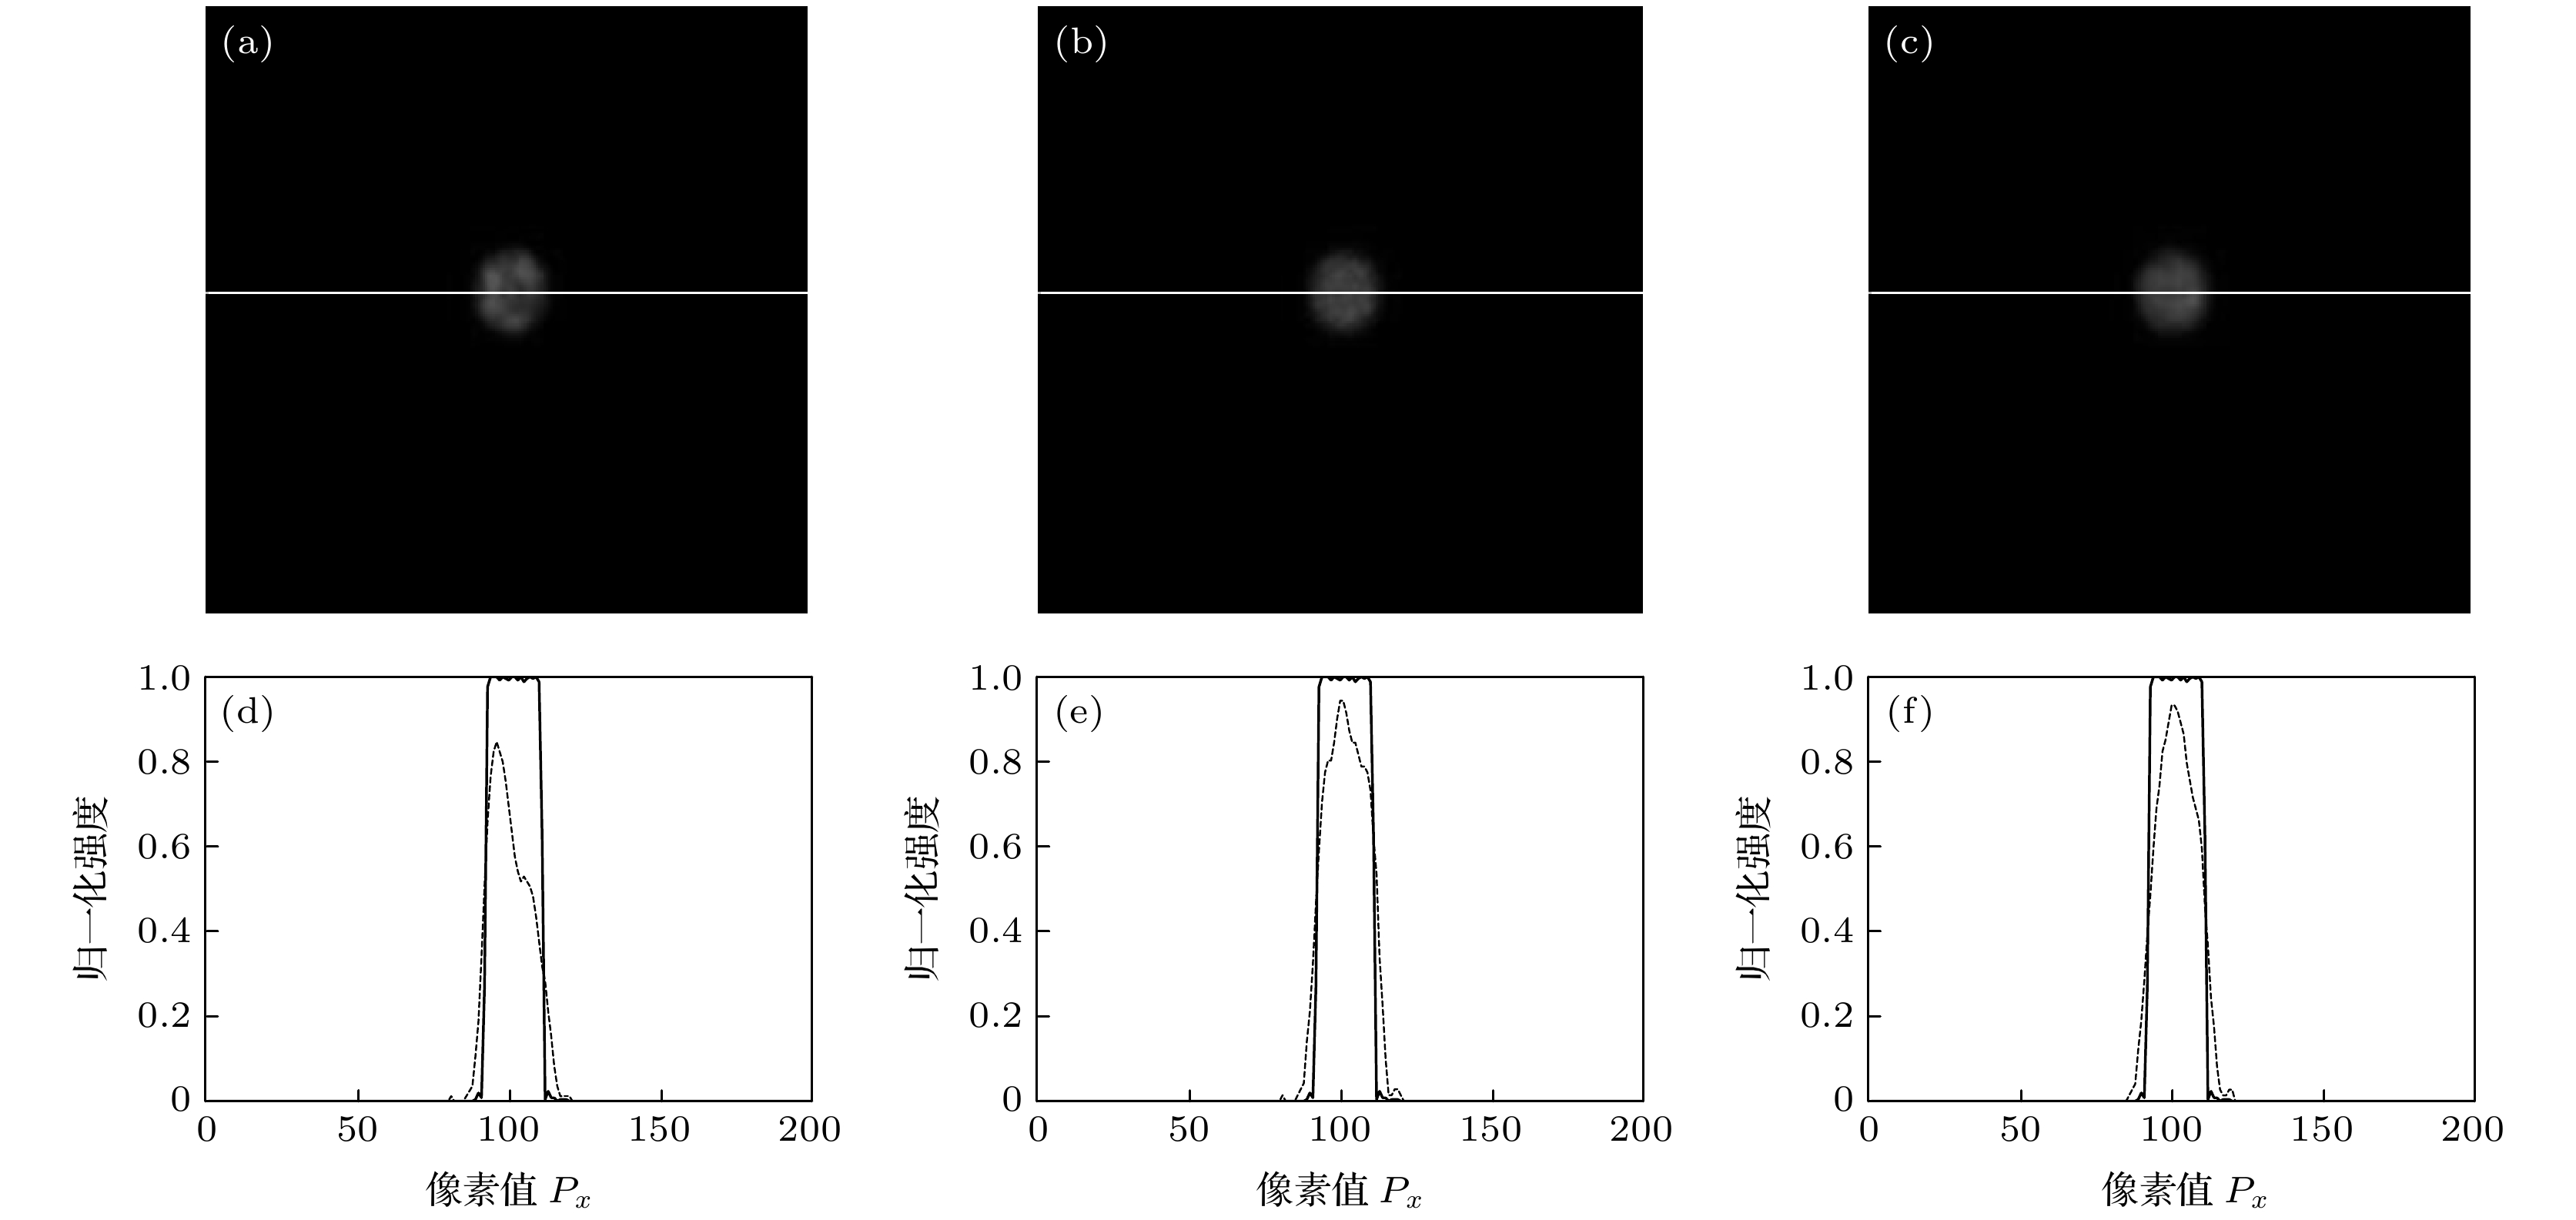 图 3 颗粒度为1000时, 半径为R的小球样品荧光层析图像 (a)—(c)及中心位置处荧光信号归一化强度(d)—(f) (a), (d) N = 20; (b), (e) N = 60; (c), (f) N = 200
Figure3. The fluorescence sectioning images (a)–(c) of a small spherical sample with a radius of R and the normalized intensity (d)–(f) of the fluorescence signal at the center position with the granularity of diffuser being 1000: (a), (d) N = 20; (b), (e) N = 60; (c), (f) N = 200.
对于半径为10R的小球样品而言, 当颗粒度固定为G = 500时, 原始荧光图像的数量N分别为20, 60和200时, 层析成像的模拟仿真结果如图4(a)—(c)所示. 图4(d)—(f)分别为半径为10R的小球样品层析重构图像中心位置处信号归一化强度曲线. 其中, 实线为焦平面上小球样品的荧光信号的归一化强度, 虚线为利用层析图像处理算法处理包含离焦信号的小球样品离焦荧光图像得到的层析图像的荧光信号归一化强度. 层析图像的荧光信号归一化强度平均值分别为50.5%, 81.71%和83.02%, 先提高后趋于饱和. 小球样品的荧光层析图像的空间分辨率与焦平面图像的基本一致.
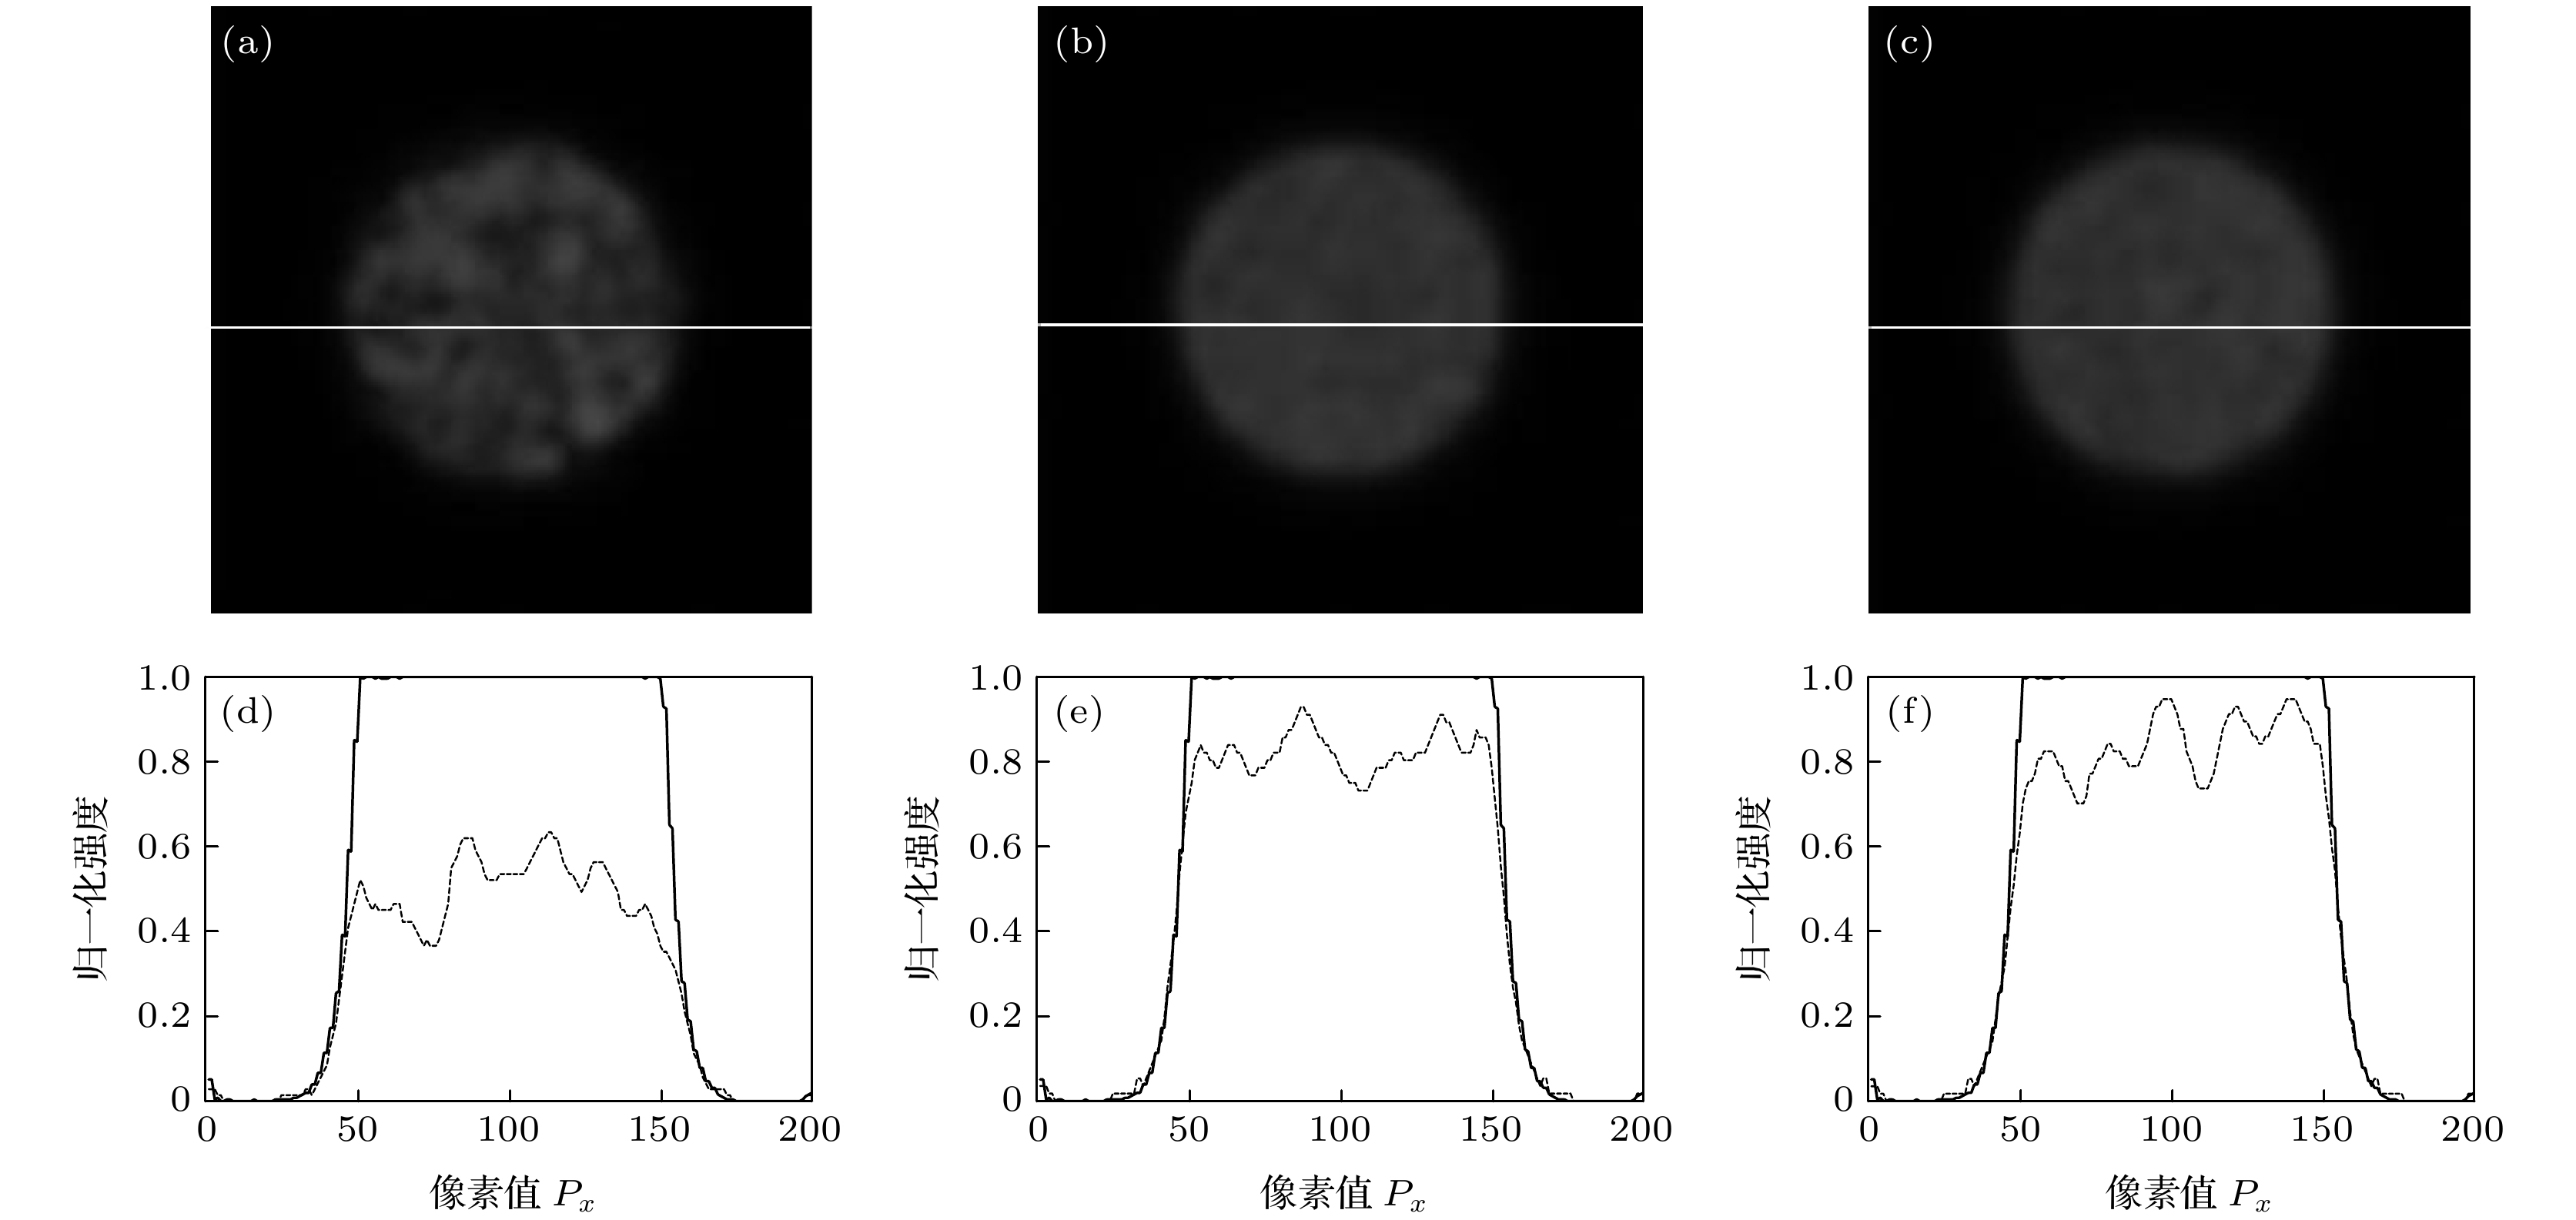 图 4 颗粒度为500时, 半径为10R的小球样品荧光层析图像 (a)—(c)及中心位置处荧光信号归一化强度(d)—(f) (a), (d) N = 20; (b), (e) N = 60; (c), (f) N = 200
Figure4. The fluorescence sectioning images (a)–(c) of a small spherical sample with a radius of 10R and the normalized intensity (d)–(f) of the fluorescence signal at the center position with the granularity of diffuser being 500: (a), (d) N = 20; (b), (e) N = 60; (c), (f) N = 200.
为获得不同颗粒度条件下, 荧光层析图像的图像质量与原始荧光图像数量之间的关系. 利用上述层析图像提取算法进一步分析了在不同散射体的颗粒度G = 20, 100, 500, 1000, 1500, 2000, 3000, 3500条件下, 不同直径的小球样品的层析图像的荧光信号归一化强度平均值与CCD相机记录小球样品的原始荧光图像数量之间的关系, 如图5所示.
 图 5 不同颗粒度条件下, 层析图像荧光信号归一化强度平均值与原始荧光图像数量之间的关系 (a)小球样品; (b)大球样品
Figure5. When the granularities of diffusers are different, the relationships between the average values of the normalized intensity of the fluorescence signals of sectioning images and the numbers of the original fluorescence images: (a) Small ball; (b) large ball.
由图5可知, 对于不同直径的小球样品而言, 当散射体的颗粒度一定时, 荧光层析图像的对比度随着CCD相机记录的原始荧光图像数量的增加而增大, 并逐渐趋于饱和. 根据模拟仿真结果分析可知, 在动态散斑照明条件下, 散斑照明区域随机分布, 激发产生的荧光信号也是随机产生的. 当散射体的颗粒度一定时, 采集的原始荧光图像数量过少, 利用算法提取得到的图像信息有所丢失, 导致获得的荧光层析图像的图像质量较差. 当采集的原始荧光图像达到一定数量后, 即可较完整地恢复焦平面上待测样品的荧光图像, 从而获得高质量的荧光层析图像. 随着原始荧光图像数量的进一步增加, 对图像质量的提升没有影响, 反而会降低系统的成像速度.
此外, 利用这一方法分析了对于不同半径的小球样品, 当CCD记录的原始荧光图像数量为固定值时, 荧光层析图像的对比度和空间分辨率与散射体颗粒度之间的关系. 对于半径为R的小球样品而言, 当原始荧光图像的数量N固定为120, 颗粒度G分别为100, 1000和3000时, 层析成像的模拟仿真结果如图6(a)—(c)所示. 层析图像的荧光信号归一化强度平均值分别为80.03%, 97.22%和76.81%, 先增加后减小, 如图6(d)—(f)所示. 小球样品的荧光层析图像的空间分辨率与焦平面图像的基本一致.
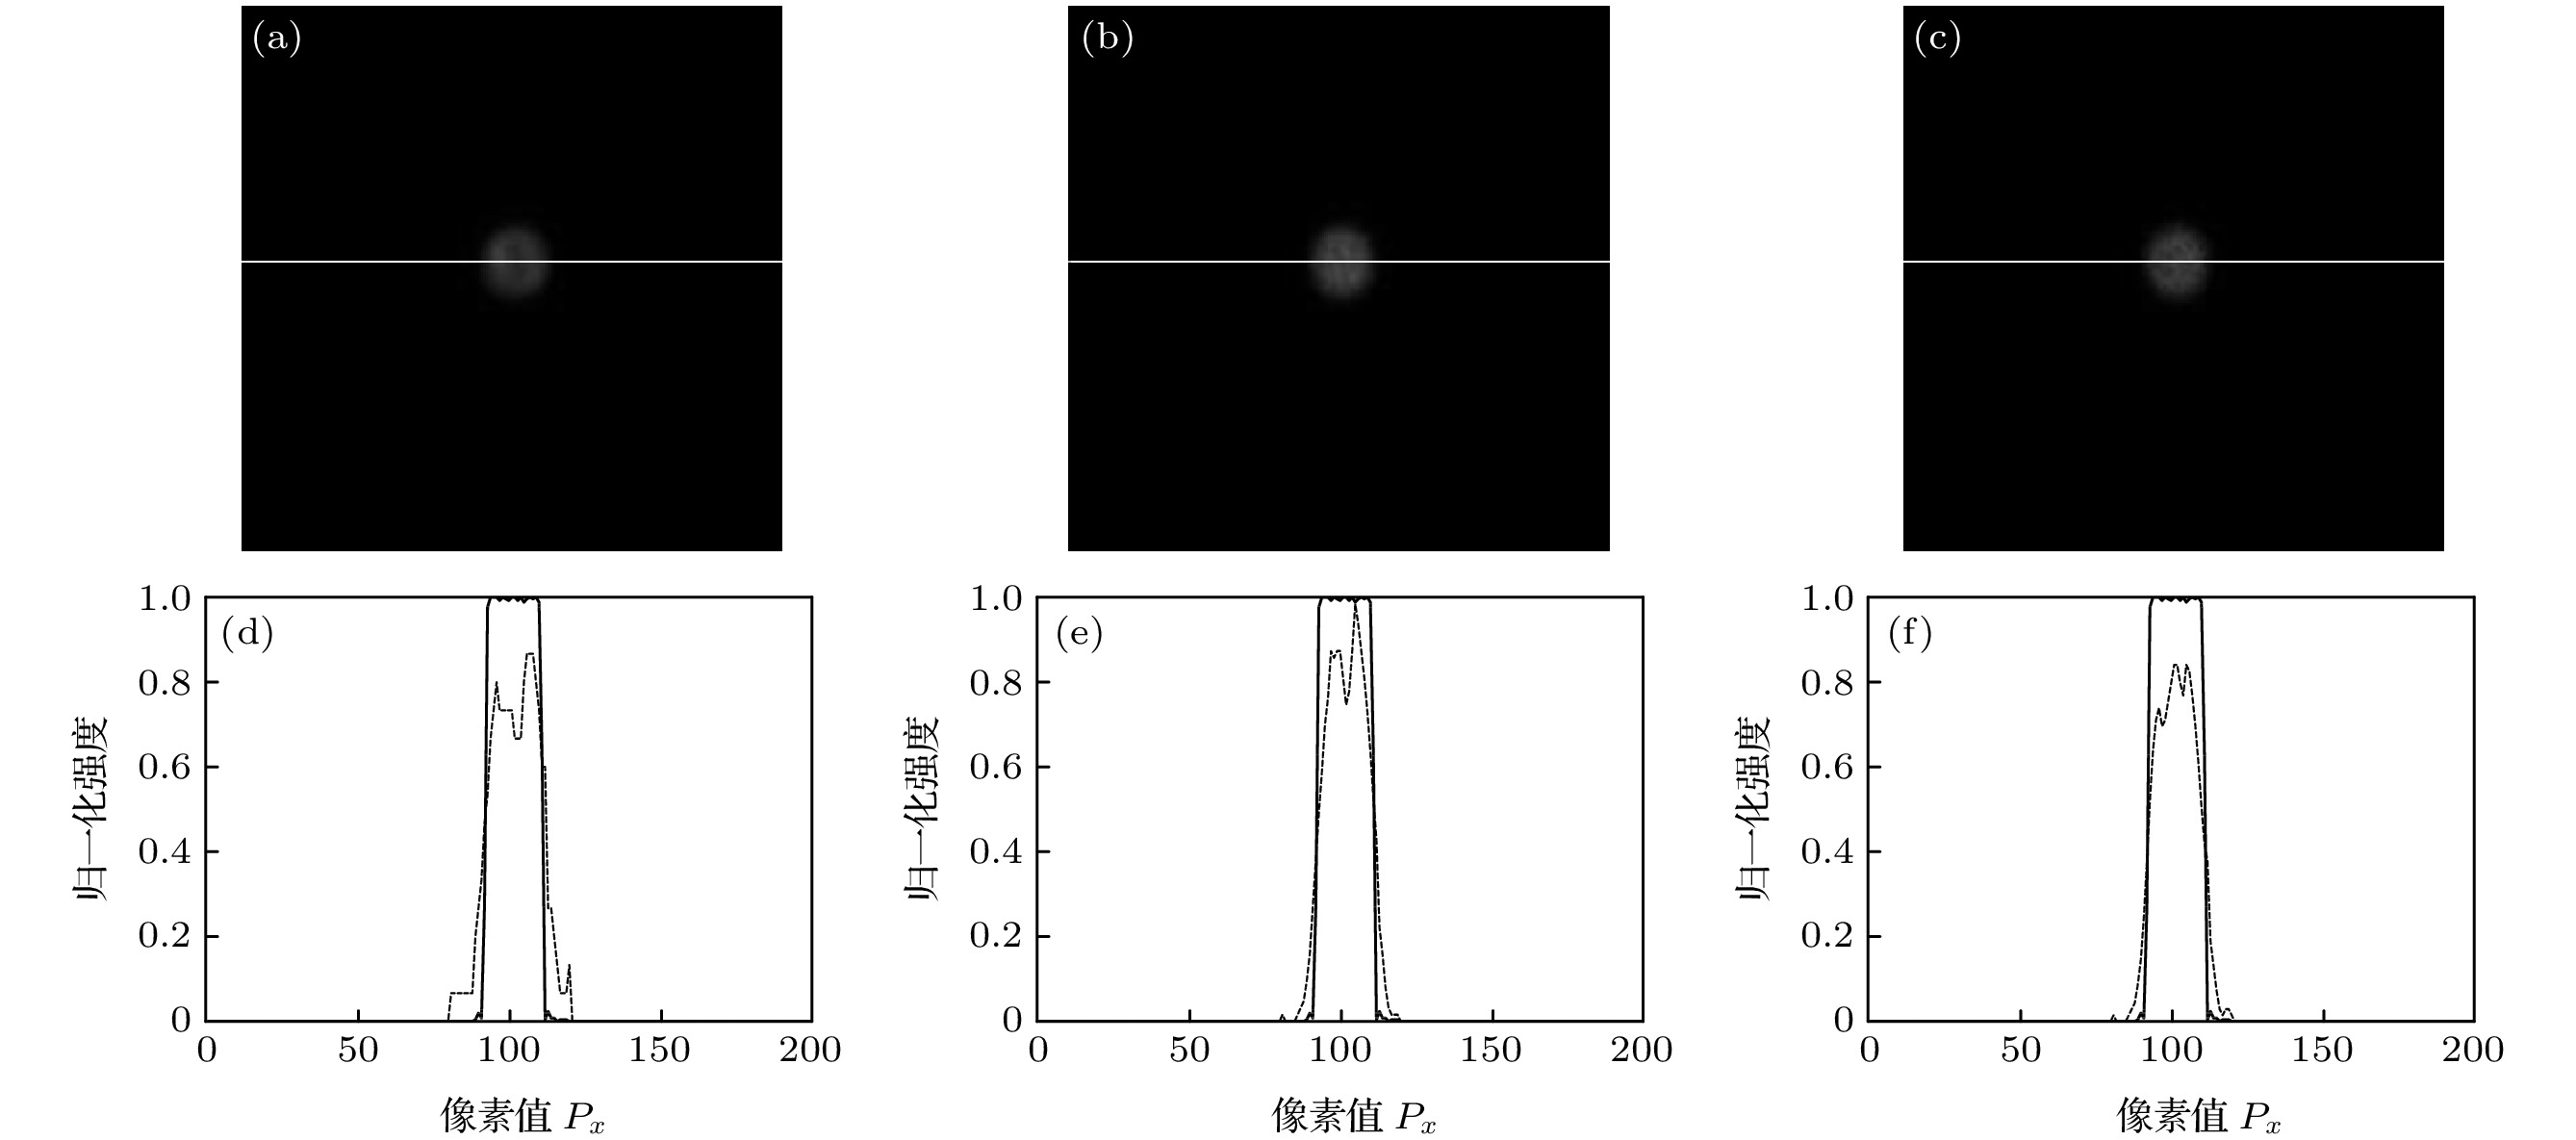 图 6 CCD记录120幅原始荧光图像时, 半径为R的小球样品荧光层析图像 (a)—(c)及中心位置处荧光信号归一化强度 (d)—(f) (a), (d) G =100; (b), (e) G =1000; (c), (f) G = 3000
Figure6. The fluorescence sectioning images (a)–(c) of a small spherical sample with a radius of R and the normalized intensity (d)–(f) of the fluorescence signal at the center position with 120 original fluorescence images being recorded by CCD: (a), (d) G =100; (b), (e) G =1000; (c), (f) G = 3000.
对于半径为10R的小球样品而言, 当原始荧光图像的数量N固定为120, 颗粒度G分别为20, 1000和3000时, 层析成像的模拟仿真结果如图7(a)—(c)所示. 层析图像的荧光信号归一化强度平均值分别为63.27%, 83.28%和73.04%, 如图7(d)—(f)所示, 也是呈现先增大后减小的趋势. 小球样品的荧光层析图像的空间分辨率与焦平面图像的基本一致.
 图 7 CCD记录120幅原始荧光图像时, 半径为10R的小球样品荧光层析图像 (a)—(c)及中心位置处荧光信号归一化强度 (d)—(f) (a), (d) G =20; (b), (e) G =1000; (c), (f) G = 3000
Figure7. When 120 original fluorescence images are recorded by CCD and the different granularity of diffuser, G=20, 1000, 3000, The fluorescence sectioning images (a)–(c) of a small spherical sample with a radius of 10R and the normalized intensity (d)–(f) of the fluorescence signal at the center position with 120 original fluorescence images being recorded by CCD: (a), (d) G =20; (b), (e) G =1000; (c), (f) G = 3000.
由仿真结果还可以看出, 当G = 20时, 由于散射体颗粒度较小, 单位面积内照明的散斑面积较大. 照明散斑图案强度分布变化的过程中, 较大体积的均匀待测样品的中心部分荧光信号强度的变化不大, 而边缘部分的则变化较大. 因此, 荧光层析图像中心位置的对比度低于边缘部分, 如图7(d)所示. 仿真结果说明, 利用小颗粒度的散射体可获取包含均匀介质的大体积样品边界轮廓的荧光层析图像.
为了获得不同原始荧光图像数量条件下, 荧光层析图像的图像质量与散射体颗粒度之间的关系. 利用上述层析图像提取算法分析了在CCD相机记录小球样品的不同原始荧光图像数量N = 20, 40, 60, 80, 100, 120, 160, 200条件下, 不同直径的小球样品的层析图像归一化强度平均值与散射体颗粒度G之间的关系, 如图8所示.
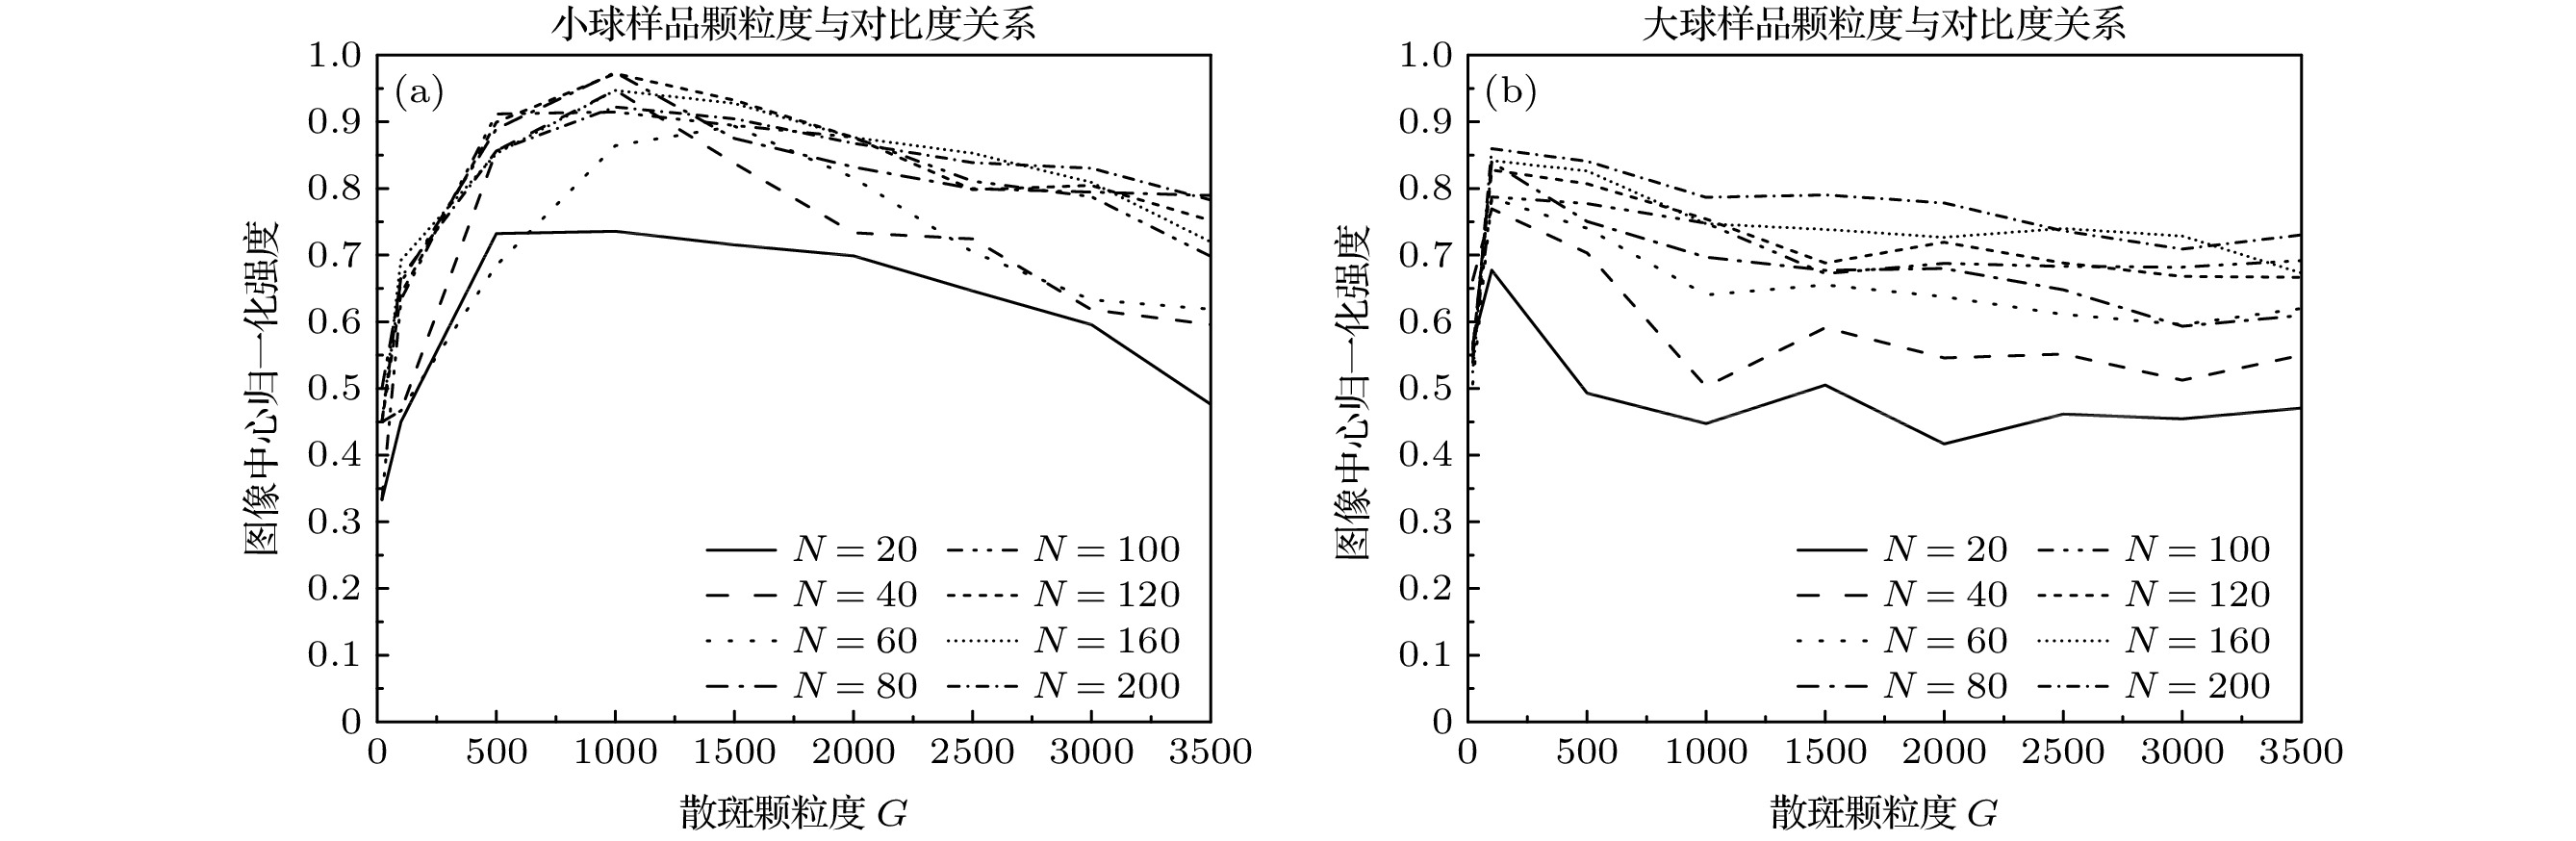 图 8 CCD记录不同原始荧光图像数量时, 层析图像荧光信号归一化强度平均值与散斑颗粒度之间的关系 (a)小球样品; (b)大球样品
Figure8. The relationships between the average values of the normalized intensity of the fluorescence signals of sectioning images and the diffuser granularities with different numbers of the original fluorescence images being recorded by CCD: (a) Small ball; (b) large ball.
由图8可知, 基于动态散斑照明的条件下, 当CCD相机记录的原始荧光图像数量较少时(N = 20), 有较多的荧光信号未被记录, 利用层析图像提取算法得到的不同直径的小球样品焦平面层析图像对比度较低. 当CCD相机记录一定数量的原始荧光图像, N ≥ 60时, 随着散射体颗粒度的增大, 小球样品的焦平面层析图像对比度先增加后下降. 根据模拟仿真结果分析可知, 在动态散斑照明条件下, 散斑照明区域随机分布, 激发产生的荧光信号也是随机产生的. 当采集的原始荧光图像数量一定时, 散射体的颗粒度较小, 激发产生荧光信号的散斑照明区域较大. 而当散射体的颗粒度较大时, 激发产生荧光信号的散斑照明区域密度较大. 因此, 在上述两种情况下, 照明区域内随机激发产生的荧光信号变化不剧烈, 无法分离离焦荧光信号实现荧光层析成像.
