Fund Project:Project supported by the National Natural Science Foundation of China (Grant No. 11362005)
Received Date:16 March 2021
Accepted Date:16 June 2021
Available Online:15 August 2021
Published Online:05 November 2021
Abstract:The lymphatic system plays an important part in the body’s immunity and cell’s internal environment homeostasis. Like a blood circulatory system, the lymphatic system is a piping system throughout the body, which is composed mainly of lymphatic fluid and lymphatic vessels. The spontaneous contraction of the lymphatic vessels drives the flow of lymphatic fluid in the vessels. The spontaneous contraction-relaxation mechanism of lymphatic vessels is determined by the oscillating feedback of Ca2+ concentration and NO concentration. The distribution of NO in the vessels plays an important role in the contraction cycle of lymphatic vessels. The shear force acting on the lymphatic valves due to the flow of fluid is the main source of NO. In a real system, the distribution of NO in a certain section of lymphatic vessel will be affected by other lymphanion connected to it, especially the upstream connecting fragments. Through the lattice Boltzmann method, a multi-segment lymphatic vessel model with valve structure is established, which reproduces the feedback mechanism of Ca2+ and NO, valve change and fluid flow. There are three types of lymphatic vessels in the model, namely the initial lymphatic vessel, the collecting lymphatic vessel, and the outlet lymphatic vessel. The number of lymphatic vessels can be unlimited and inputted by the parameters. The number of lymphatic vessels is 3-5, and there are two pairs of valves in each lymphatic vessel. In this paper studied are the distribution of NO and pressure in multi-segment lymphatic vessel, and the change in the flow of each vessel in the three-segment vessel model over time. Keywords:multi-segment lymphatic vessel/ lattice Boltzmann method/ lymphatic valve/ NO/ flux
4.计算结果与分析本次计算代码使用C++编写, 计算代码在搭载了8个GPU的服务器上执行. GPU型号为NVIDIA Quadro GP100, 每个GPU含有3584个CUDA核心, 处理双精度浮点数的能力为5.2 TFLOP/s, 搭配16 GB HBM2显存, 理论带宽高达717 GB/s. 编译环境为CUDA10.0. 每个GPU用来计算一段淋巴管, 淋巴管数分别为3, 4, 5段. MPI用来交换淋巴管段边界间的数据. 通过量纲转换将实际淋巴管物理参数与格子物理量进行转换, 其详细参数参考文献[22]. 图4表示多段管中的NO浓度分布和压力分布情况, 右侧颜色标尺自下而上的颜色变化表示管内NO浓度和压力强度的增大. 图4(a)、图4(c)和图4(e)分别表示淋巴管的段数为3, 4, 5段时NO的浓度分布情况, 瓣膜是产生NO的主要结构, 瓣膜附近的NO浓度要明显高于其他部分. 随着瓣膜数量的增加, NO在整个管腔内的分布更为复杂, Ca2+的分布变得越来越随机, 进而导致Ca2+的浓度达不到淋巴肌细胞收缩的阈值, 淋巴管整体的收缩情况也变得混乱. 此外, 瓣膜附近NO的浓度还受淋巴管当前收缩阶段的影响. 当淋巴管收缩时, 瓣膜附近处NO的浓度将沿着整个淋巴管, 自上游向下游逐渐升高. 反之, 若淋巴管舒张时, 瓣膜附近处NO的浓度将自上游向下游逐渐降低. 图4(b)、图4(d)和图4(f)分别表示淋巴管的段数为3, 4, 5段时压力的分布情况, 淋巴管外红色点表示组织. 如图4(d)所示, 四段管中的前两段淋巴管管内颜色为红色, 表示这部分压力非常大, 应处于收缩的初始阶段; 后两段淋巴管中压力呈现出逐渐递减的趋势, 证明了淋巴管的自发收缩从上游向下游逐渐过渡的过程. 四段管整体处在收缩周期的初始阶段, 此时淋巴液流动速度较小, 作用在瓣膜和淋巴管壁上的剪切力也较小, 因而管内部NO的浓度整体偏低, 故图4(c)相较于图4(a)和图4(e)没有出现NO浓度较高的红色区域. 图4(b)和图4(f)中, 各管内压力强度偏低, 且管间压力分布也较为均匀. 图 4 淋巴管的段数不同时, (a), (c), (e) NO浓度和(b), (d), (f)压力分布(颜色标尺顶部红色部分最大压强为3.045 × 10³ Pa, 底部蓝色部分最小压强为3.010 × 10³ Pa) (a), (b) 3段; (c), (d) 4段; (e), (f) 5段 Figure4. (a), (c), (e) NO concentration and (b), (d), (f) pressure distribution for different segment lymphatic?vessel (The maximum pressure of the red part at the top of the color scale is 3.045 × 10³ Pa, and the minimum pressure of the blue part at the bottom is 3.010 × 10³ Pa): (a), (b) Three segments; (c), (d) four segments; (e), (f) five segments.
图5表示3—5段淋巴管中的NO平均浓度随时间的变化情况. 当淋巴管开始收缩时, 最左侧瓣膜关闭, 淋巴液的流动使作用在瓣膜处的剪切力变大, NO的平均浓度相应升高. 当淋巴管达到舒张期峰值时, 淋巴液的流速变小, 产生很少的NO, NO的降解或扩散使其平均浓度有所下降. 继而进入下一次收缩-舒张循环, NO的平均浓度呈现出周期性的增减变化, 并且随着循环周期的往复, NO的最低基准浓度持续升高. 特别的是, 3段管中平均浓度的峰值经过多次收缩循环后由最低变成了最高, 5段管中平均浓度的峰值变成了最低. 图 5 NO平均浓度随时间变化 Figure5. Average NO concentration changes with time.


 图 1 D2Q9模型


 图 2 压力边界条件示意图

 图 3 淋巴管示意图


 图 4 淋巴管的段数不同时, (a), (c), (e) NO浓度和(b), (d), (f)压力分布(颜色标尺顶部红色部分最大压强为3.045 × 10³ Pa, 底部蓝色部分最小压强为3.010 × 10³ Pa) (a), (b) 3段; (c), (d) 4段; (e), (f) 5段
 图 5 NO平均浓度随时间变化
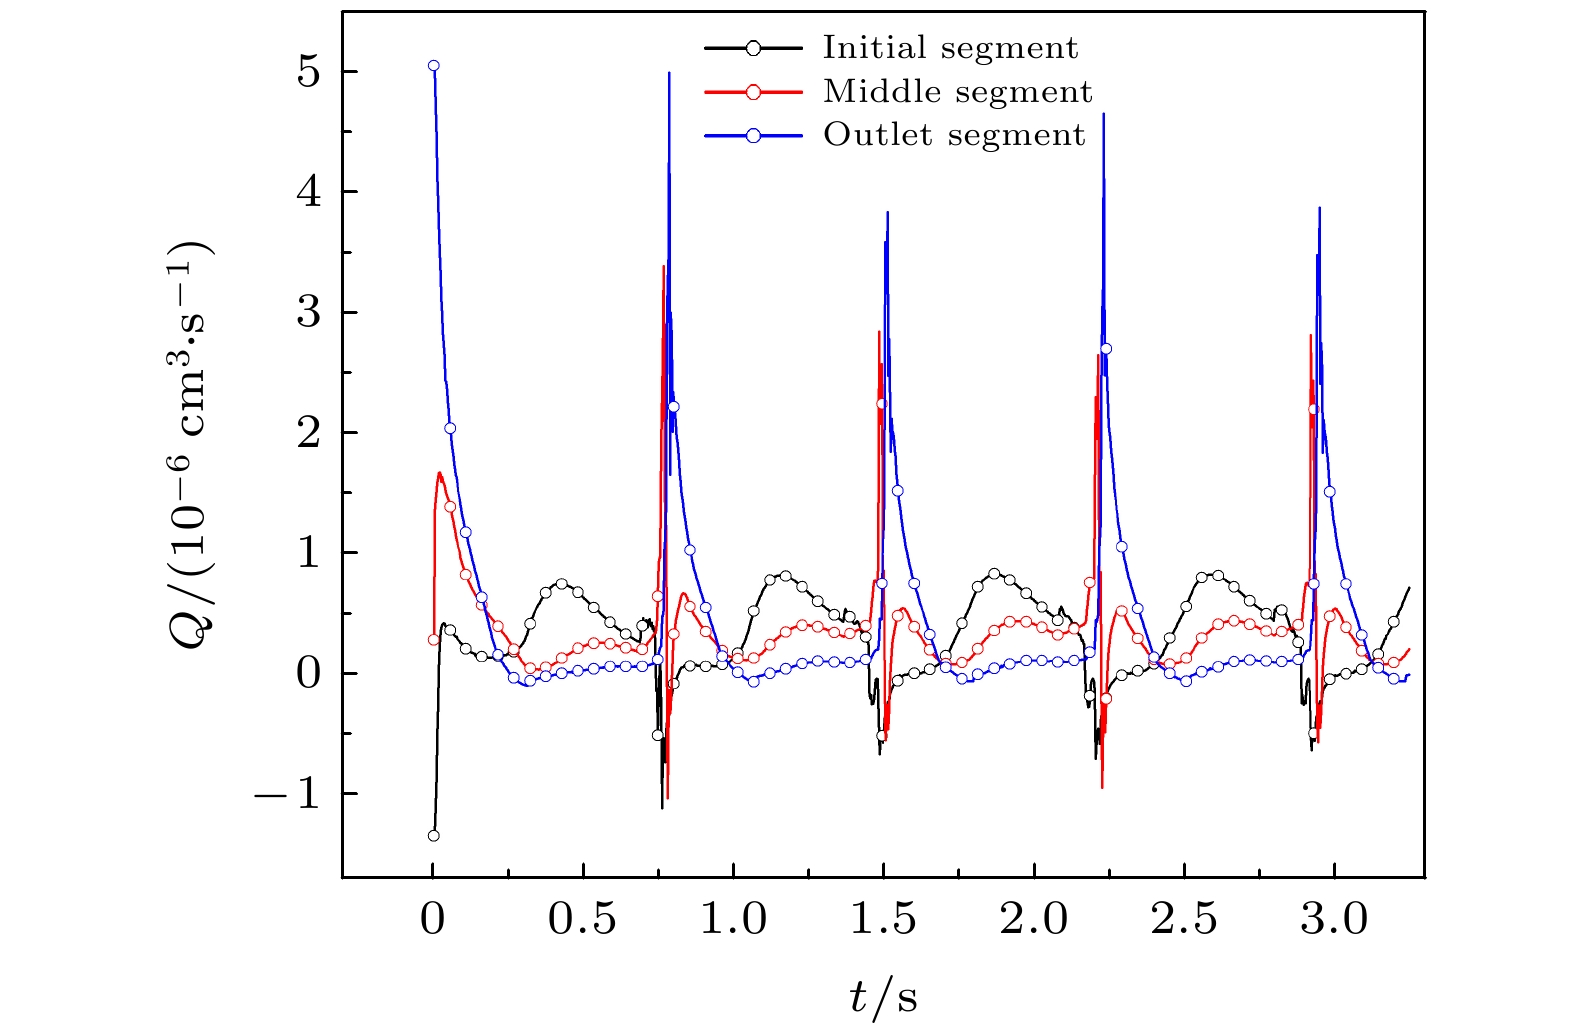 图 6 三段管中流量随时间变化