Fund Project:Project supported by the National Key R&D Program of China (Grant Nos. 2017YFA0305200, 2016YFA0301700) and the Key Areas Research and Development Program of Guangdong Province, China (Grant Nos. 2018B030329001, 2018B030325001)
Received Date:02 March 2021
Accepted Date:15 April 2021
Available Online:07 June 2021
Published Online:20 September 2021
Abstract:Integrated photonics has the advantages of miniaturization, low cost, stability and easy manipulation in comparison with bulk optics. However, as the scale and complexity of the chip increase, the calibration of cascaded phase shifters on-chip will be almost impossible. The time needed to calibrate the cascaded phase shifters with using conventional method increases exponentially with the number of cascades, and the maximum number of cascades achieved so far is only 5. In this paper, we propose a high-speed calibration method by which the calibration time increases only linearly with the number of cascades increasing, achieving an exponential acceleration. For N-cascaded phase shifters, the number of points scanned by each shifter is m, our method only needs to scan $ ({m}^{2}+m+1)N-1 $ points instead of $ {m}^{n} $ with using the proposed method. The main idea of this method is that we can calibrate phase shifters one by one via two-dimensional (2D) scanning. For example, for N-cascaded phase shifter, the calibration of phase shifter N can be realized by calibrating the 2D scanning phase shifter $ N-1 $ and the 2D scanning phase shifter N, and the calibration of phase shifter $ N-1 $ can be achieved by calibrating the 2D scanning phase shifter $ N-2 $ and the 2D scanning phase shifter $ N-1 $, and so on. The 2D scanning phase shifter $ N-1 $ and the 2D scanning phase shifter N scan the phase shifter N by m points and then the current of phase shifter $ N-1 $ is changed to scan the phase shifter N. Whenever changing the current of phase shifter $ N-1 $ once, we can plot a curve of current-transmission. The lowest point of the curve changes with the change of the current phase shifter $ N-1 $. When the lowest point of the curve takes a maximum value, that point is the 0 or π phase of phase shifter N. Similarly, when the lowest point of the curve takes a maximum value, that point is the $ -0.5{\rm{\pi }} $ or $ 0.5{\rm{\pi }} $ phase of phase shifter $ N-1 $. Then we can calibrate all phase shifters by using this method, but each phase shifter has two possibilities. Then we can set a specific current of all phase shifters to finish the calibration. The different parameters are verified to see their effect on fidelity. It is found that small experimental error has little effect on fidelity. When $ m > 20 $, the fidelity becomes approximately a constant. For every 1760 increase in N, the fidelity decreases by about 0.01%. The fidelity of 20-cascaded phase shifters is 99.8%. The splitting ratio of MMI may is not 50∶50 as designed because of chip processing errors. So, different splitting ratios are simulated and it is found that the splitting ratio affects the fidelity more seriously than other parameters. But our method works still well even when the splitting ratio is 45∶55, whose fidelity is 99.95% if we know the splitting ratio. The method will greatly expand the application scope of integrated quantum photonics. Keywords:integrated quantum photonics/ cascaded phase shifters/ calibration method
如图5所示, 通过联合扫描$ {I}_{N-1} $和$ {I}_{N} $, 寻找T的极小值, 可以得到两组$ T=0 $的结果, 即图5中的红色点, 分别对应: 图 5 级联N个移相器的$ 2\times 2 $光芯片分束比与移相器$ N-1 $的相位和移相器N的相位的关系图. 每改变移相器$ N-1 $的相位一次, 都完整扫描一遍$T\text{-}{\theta }_{N}$曲线, 并标记曲线的最低点为黑色. 两个红色点代表$ {T}_{\mathrm{m}\mathrm{i}\mathrm{n}} $取最小值的情况, 白色点代表$ {T}_{\mathrm{m}\mathrm{i}\mathrm{n}} $取最大值的情况, 此时白色点对应的$ {\theta }_{N}=0 $或π Figure5. Splitting ratio $ 2\times 2 $ optical waveguide circuit versus phase shifter $ N-1 $ and phase shifter N. For every change of $ {\theta }_{N-1}, $ we scan a full $T\text{-}{\theta }_{N}$ curve and mark its lowest point black. The two red point represents the minimum of $ {T}_{\mathrm{m}\mathrm{i}\mathrm{n}} $ while the white point represents the maximum of $ {T}_{\mathrm{m}\mathrm{i}\mathrm{n}} $. The white point corresponding to $ {\theta }_{N}=0 $ or π.
其中$ {a}_{i}=0 $或1. 下面要来确定每个移相器$ {a}_{i} $的具体数值. 首先讨论移相器数目为奇数的情况. 如图7(a)所示, 移相器数目$ N =2 P - 1 $ (P为正整数), 共有P个奇数项移相器和$ P-1 $个偶数项移相器. 对移相器$ {a}_{i} $的确定共分为4个步骤. 每个步骤中标黑色的移相器相位均设为0或π, 标红色与标蓝色的移相器相位设为$ 0.4{\text{π}} $或$ 1.4{\text{π}} $. 标蓝色的移相器在执行该步骤后可确定对应$ {a}_{i} $的具体数值. 这里要说明的是选取$ 0.4{\text{π}} $相位用来标定$ {a}_{i} $是为了方便, 实际上可取除0, $ \pm 0.5{\text{π}} $, $ \pm {\text{π}} $以外的任何其他相位用来标定$ {a}_{i} $. 图 7 确定$ {a}_{i} $的标定顺序, 其中颜色为黑色与绿色的移相器相位设为0, 其他颜色的移相器相位设为0.4π, 有下划线步骤可以确定下划线部分的$ {a}_{i}=1 $为奇数或偶数个, 箭头为标定方向, 蓝色移相器和绿色移相器为对应步骤可以完成标定的移相器 (a) 移相器数量为奇数的标定顺序; (b) 移相器数量为偶数的标定顺序 Figure7. Calibration sequence to determine $ {a}_{i} $, where the phase shifters with color black and green are set to phase 0 and the others are set to $ 0.4{\text{π}} $. Steps with underline can determine whether the red underline part of $ {a}_{i}=1 $ is an odd or even number of shifts. The arrow is the calibration direction. Phase shifters in blue color or red color are the phase shifters that can be calibrated in the corresponding steps. (a) Calibration sequence with an odd number of phase shifters; (b) calibration sequence with an even number of phase shifters.
第一步, 按照图中Step 1标注的颜色对移相器设置相位, 通过测量分束比T可以确定奇数项中$ {a}_{i}=1 $的数量是奇数还是偶数; 第二步, 按照图中Step 2标注的颜色对移相器设置相位, 通过测量分束比T可以确定偶数项中$ {a}_{i}=1 $的数量是奇数还是偶数; 第三步, 按照图中Step 3标注的颜色对移相器设置相位, 通过测量分束比T可以确定蓝色移相器的$ {a}_{i} $的值, 按照箭头方向依次向左标定, 可以完成所有偶数项移相器的标定; 第四步, 按照图中Step 4标注的颜色对移相器设置相位, 通过测量分束比T可以确定蓝色移相器的$ {a}_{i} $的值, 按照箭头方向依次向右标定, 可以实现所有奇数项移相器的标定. 下面再来讨论移相器数目为偶数的情况. 如图7(b)所示, 移相器数目$ N=2 P $ (P为正整数), 共有P个奇数项移相器和P个偶数项移相器. 对移相器$ {a}_{i} $的确定共分为5个步骤. 每个步骤中标黑色和标绿色的移相器相位均设为0或π, 标红色的移相器相位设为$ 0.4{\text{π}} $或$ 1.4{\text{π}} $. 标绿色的移相器在执行该步骤后可以确定对应$ {a}_{i} $的具体数值. 第一步, 按照图中Step 1标注的颜色对移相器设置相位, 通过测量分束比T可以确定所有移相器中$ {a}_{i}=1 $的数量是奇数还是偶数; 第二步, 按照图中Step 2标注的颜色对移相器设置相位, 通过测量分束比T可以确定在下划线上的移相器中$ {a}_{i}=1 $的数量是奇数还是偶数; 第三步, 按照图中Step 3标注的颜色对移相器设置相位, 通过测量分束比T可以确定在下划线上的移相器中$ {a}_{i}=1 $的数量是奇数还是偶数; 第四步, 按照图中Step 4标注的颜色对移相器设置相位, 通过测量分束比T可以确定绿色移相器的$ {a}_{i} $的值, 按照箭头方向向左依次移动就可以完成对偶数项移相器的标定; 第五步, 按照图中Step 5标注的颜色对移相器设置相位, 通过测量分束比T可以确定绿色移相器的$ {a}_{i} $的值, 按照箭头方向向右依次移动就可以完成对奇数项移相器的标定. 这里要说明的是, 无论N是奇数还是偶数的情况下, 对第1个和最后1个移相器同时加π相位都不会对分束比T产生影响, 因此无需确定$ {a}_{1} $和$ {a}_{N} $的具体数值, 而只需要知道两者的关系即可. $ {a}_{1} $和$ {a}_{N} $具体关系可以从图7的标定步骤中推断出来. 综上所述, 使用上述方法可以确定所有移相器的$ {a}_{i} $的具体数值, 结合之前确定的$ {\gamma }_{i} $和$ {\phi }_{i} $, 从而可以完成所有移相器的相位标定. 这里将使用传统标定方法与使用该方法对N个级联移相器标定所耗费的资源进行一个简单的比较. 假设每个移相器加载的电流扫描$ 10 $个点, 使用传统的标定方法需要扫描$ {10}^{N} $个点, 使用我们的方法总共只需要扫描$ 111 N-1 $个点即可. 3.模拟验证我们在程序中改变多个参数来模拟检验该方法的稳定性. 设置输入态为$\left( {\begin{array}{*{10}{c}} 1\\ 0 \end{array}} \right)$, 然后对所有移相器同时加电, 得到实验输出态$ \left| {{{\boldsymbol{\psi}} _{\rm{e}}}} \right\rangle $, 同时按照标定移相器的结果代入电流值来计算得到计算输出态$ \left| {{{\boldsymbol{\psi}} _{\rm{c}}}} \right\rangle $, 最后测量其保真度$ {\rm{Fidelity}} = {\left| {\left\langle {{{\boldsymbol{\psi}} _{\rm{e}}}|{{\boldsymbol{\psi}} _{\rm{c}}}} \right\rangle } \right|^2} $. 图8(a)展示的是一个级联20个移相器的2 × 2光波导线路, 将对这些移相器加载电流, 比较输出态相对于理想态的保真度, 来评估我们方法的有效性. 这里使用了两种加载电压的方式. 第一种方式是对每个移相器加载0 或3 V的电压, 共220 =1048576种加载电压的组合方式, 输出态的保真度分布如图8(b)所示, 保真度均大于0.999999. 第二种方式是对每个移相器随机加载0到9 V间某个电压, 选取了相同数量(1048576种)随机加载电压组合, 输出态的保真度分布如图8(c)所示, 保真度均大于0.999996. 可以看到, 输出态的保真度与加载电压的方式有关, 随机加载电压的方式保真度分布更分散, 但无论采用哪种方式, 输出态的保真度都非常高. 图 8 (a)级联20个移相器的2 × 2光波导线路; (b)每个移相器加载0或3 V的电压, 输出态的保真度分布; (c)每个移相器随机加载0到9 V间某个电压, 输出态的保真度分布 Figure8. (a) $ 2\times 2 $ optical waveguide circuit of 20-cascaded phase shifter; (b) the distribution of statistical fidelity of output state applying voltage of 0 or 3 V for each phase shifter; (c) the distribution of statistical fidelity of output state applying voltage randomly between 0 and 9 V for each phase shifter.
然后模拟了不同的实验测量误差对标定结果的影响, 如图9(a)所示, 本文设置的实验中的测量误差$ \varepsilon $从0%增加到9%, 模拟级联了8个移相器, MMI的η设为0.5, 每个移相器的取点数为81, 这里设置的实验误差是实验上测量光功率时的误差(比如光纤发生微小的抖动). 从图9(a)可以看到, 该方法对实验测量误差的容忍度非常好, 在0%—9%的实验测量误差范围内输出得到的态的保真度始终大于99.9999%. 此外, 还研究了采样点数量对输出态保真度的影响. 如图9(b)所示, 这里模拟的是对级联8个移相器的2 × 2光波导线路的标定, MMI的η设为0.5, 光功率测量误差为5%, 可以看到当每个移相器的采样点数量大于10时, 可以实现大于99.99%的保真度, 当采样点数量大于20后保真度的值趋于稳定. 图 9 (a)不同实验测量误差对保真度的影响; (b)不同取点数量对保真度的影响; (c)不同数量移相器对保真度的影响; (d)不同的MMI分光比η值对保真度的影响 Figure9. (a) Effect of different experimental measure errors on fidelity; (b) effect of different number of points on fidelity; (c) effect of different numbers of phase shifters on fidelity; (d) effect of different values of the MMI spectral ratio η on fidelity.


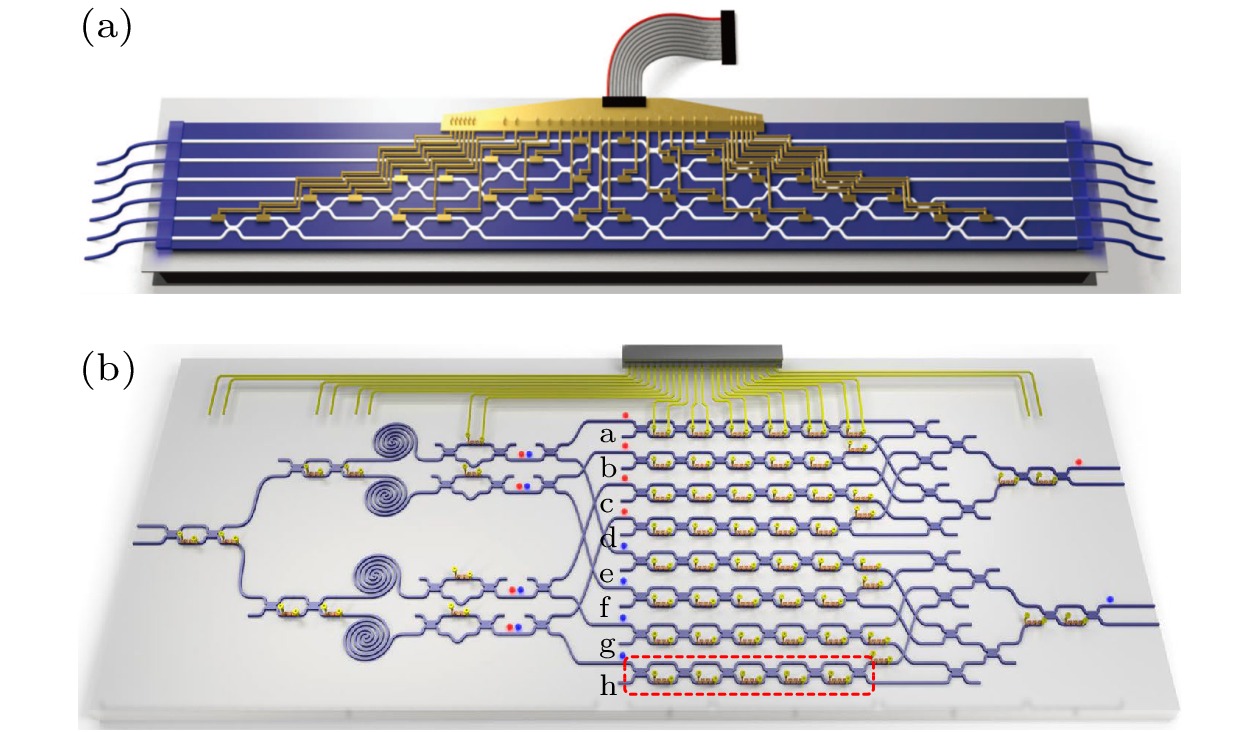 图 1 (a) 使用Reck Scheme构造任意

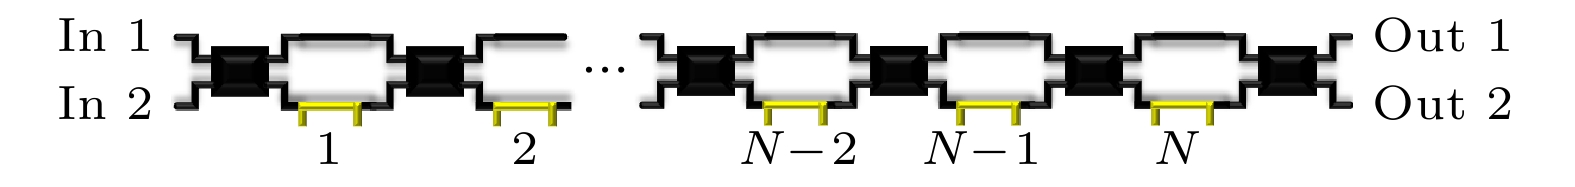 图 2 级联N个移相器的


 图 3 由单个移相器构成的2 × 2光波导线路图


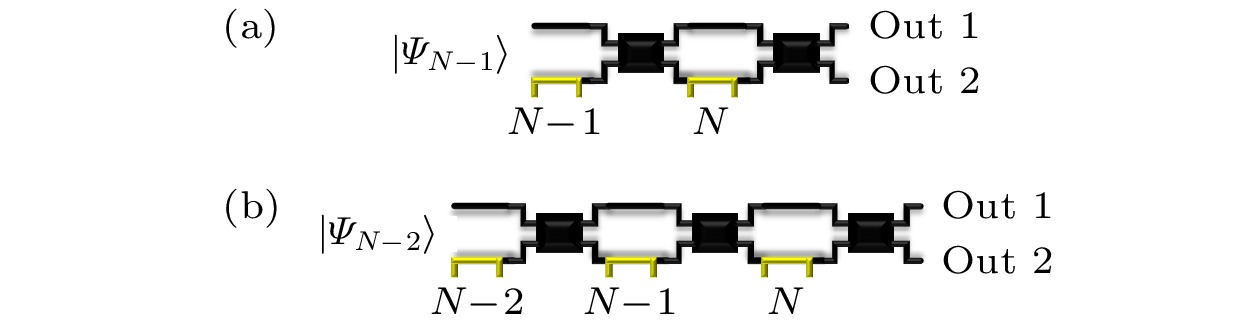 图 4 简化移相器标定方法示意图 (a)级联扫描移相器N–1和移相器N; (b)级联扫描移相器N–2和移相器N–1


 图 5 级联N个移相器的


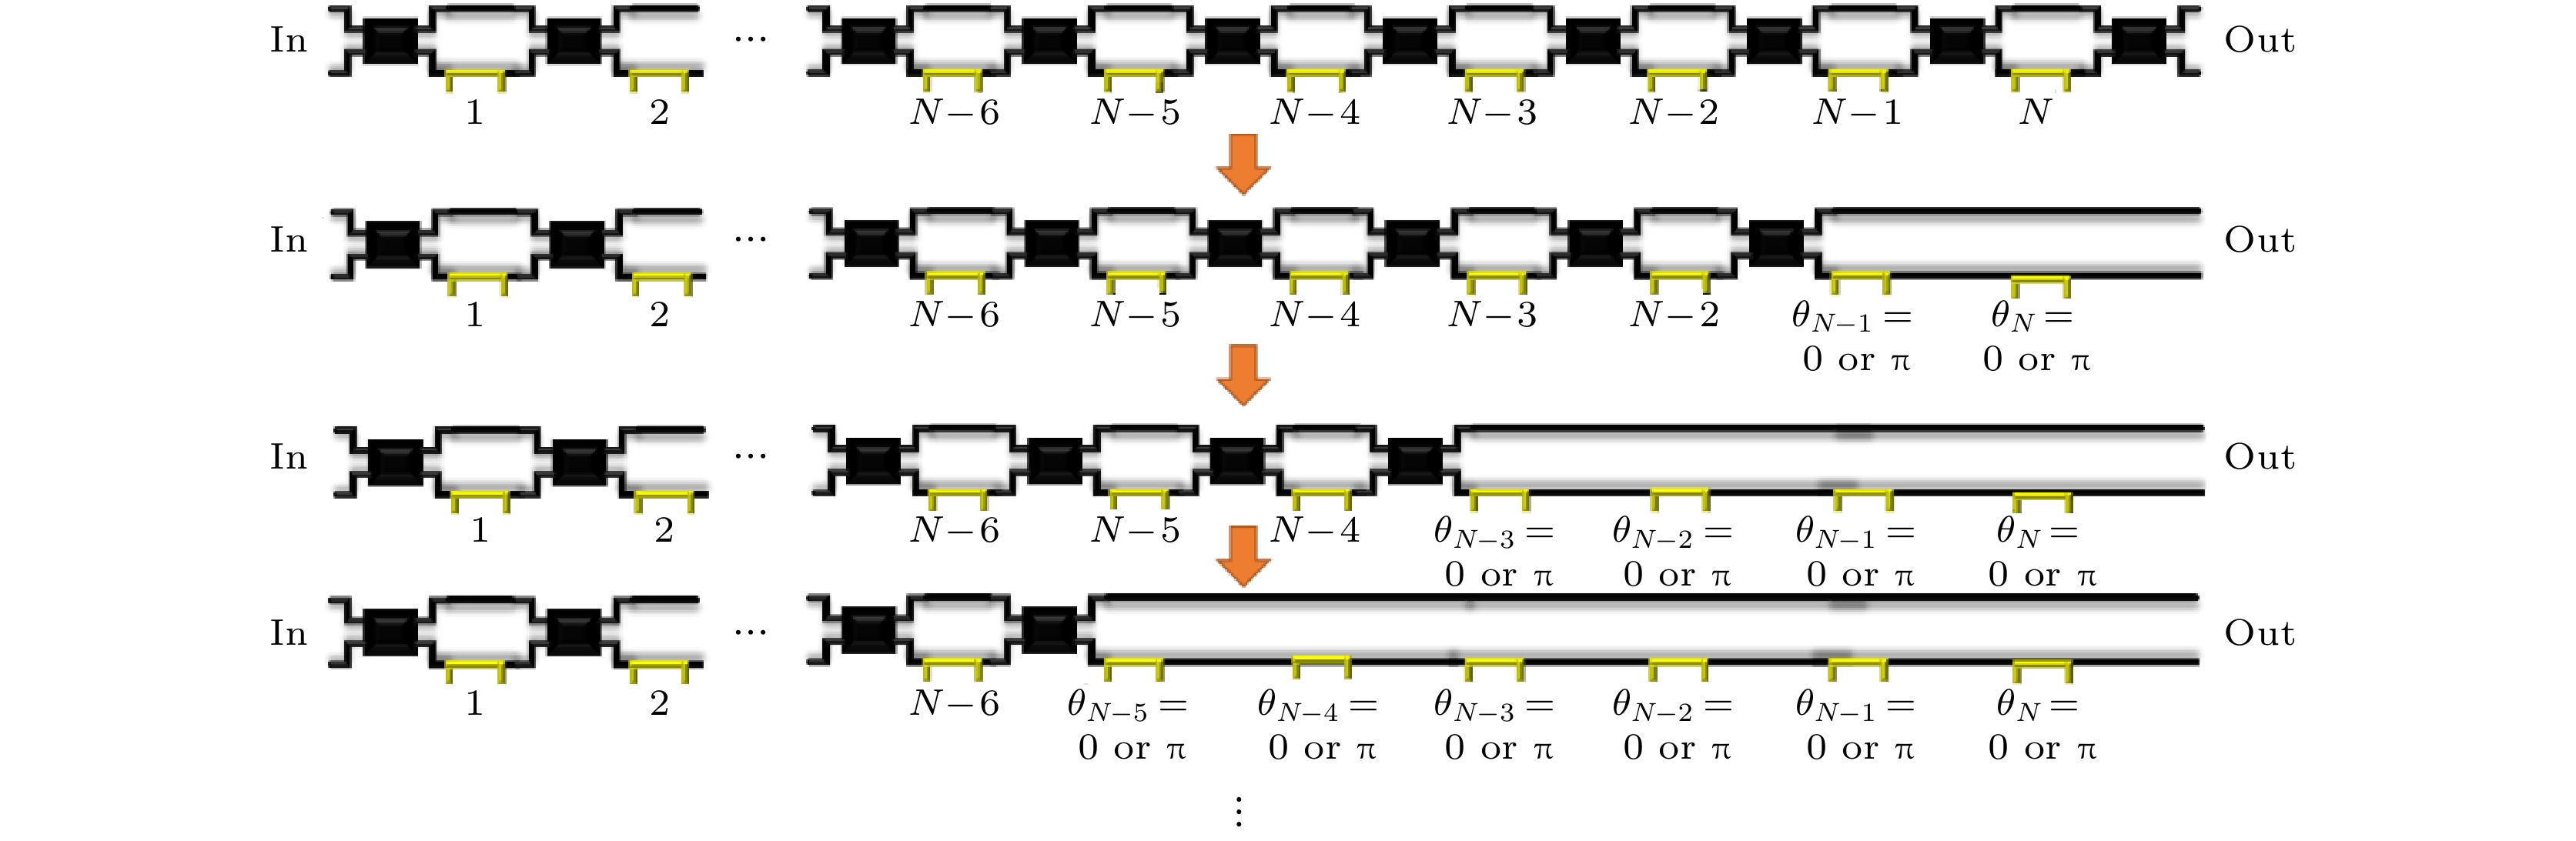 图 6 级联移相器的标定顺序


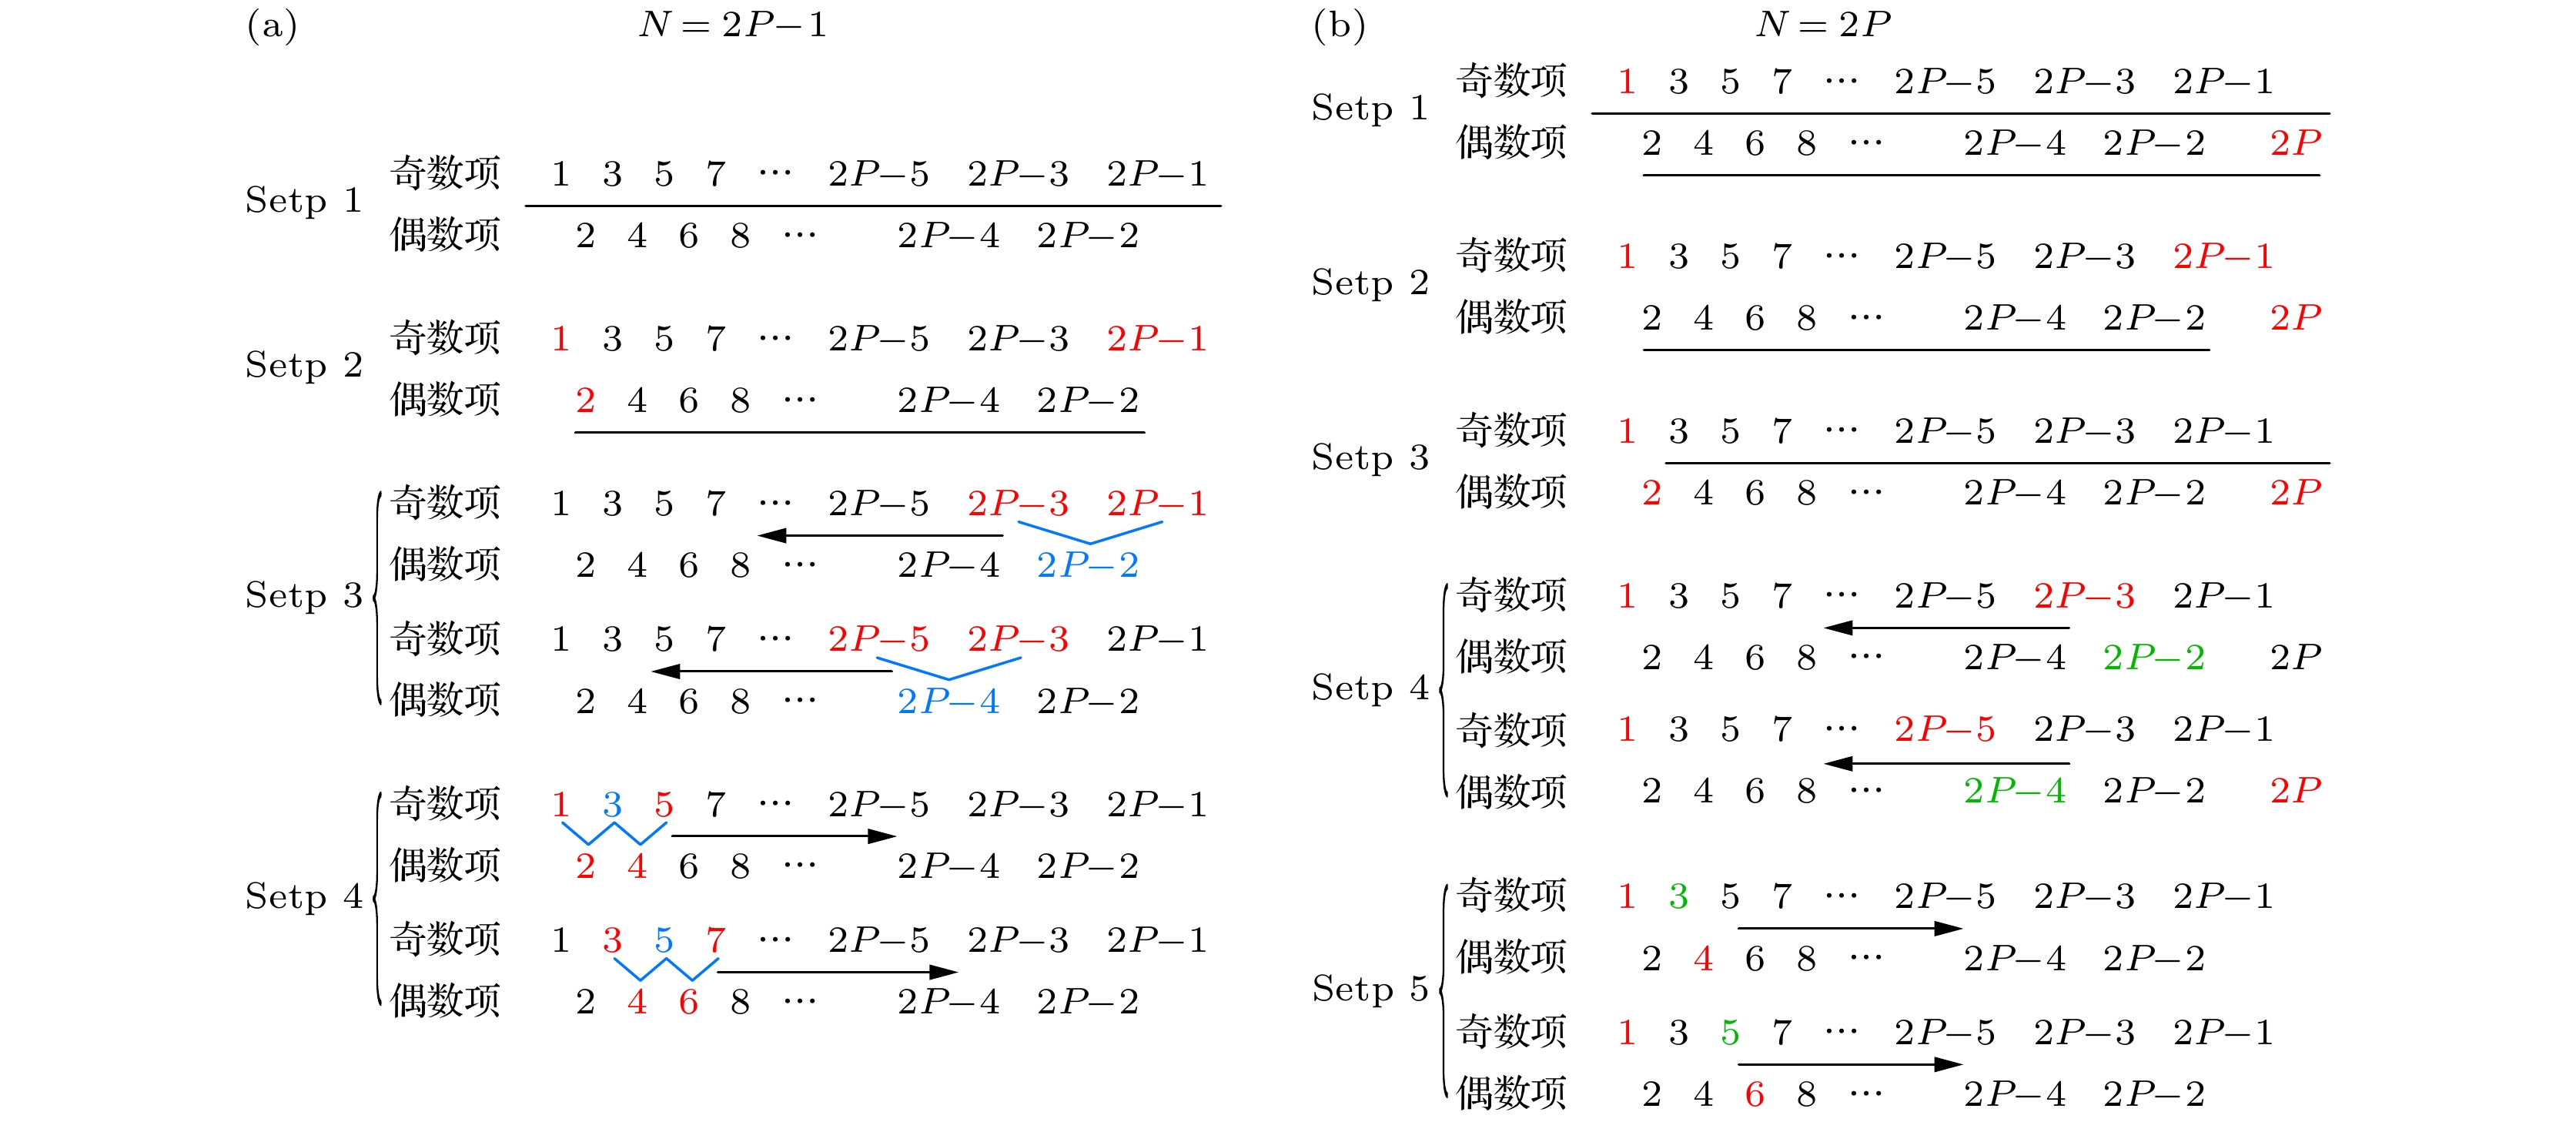 图 7 确定


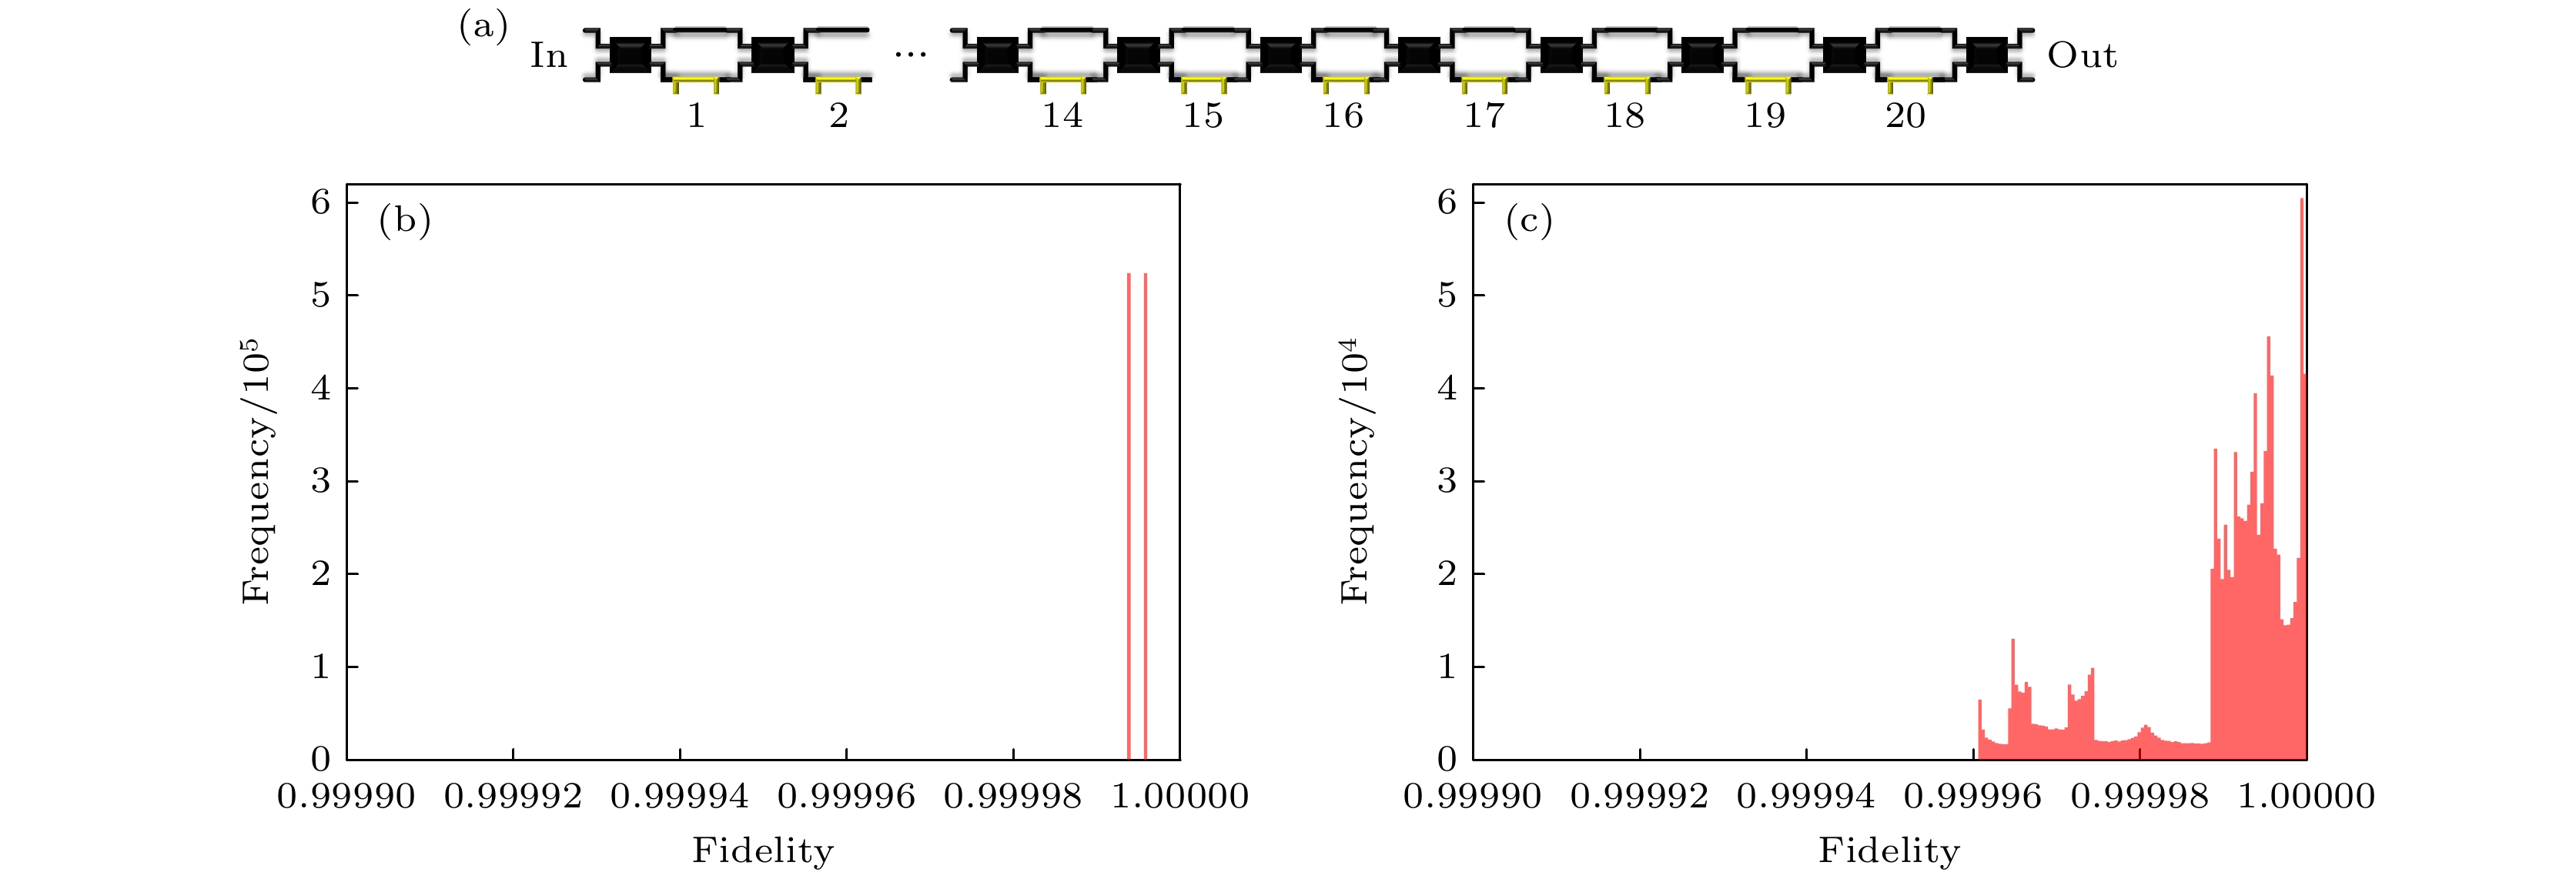 图 8 (a)级联20个移相器的2 × 2光波导线路; (b)每个移相器加载0或3 V的电压, 输出态的保真度分布; (c)每个移相器随机加载0到9 V间某个电压, 输出态的保真度分布

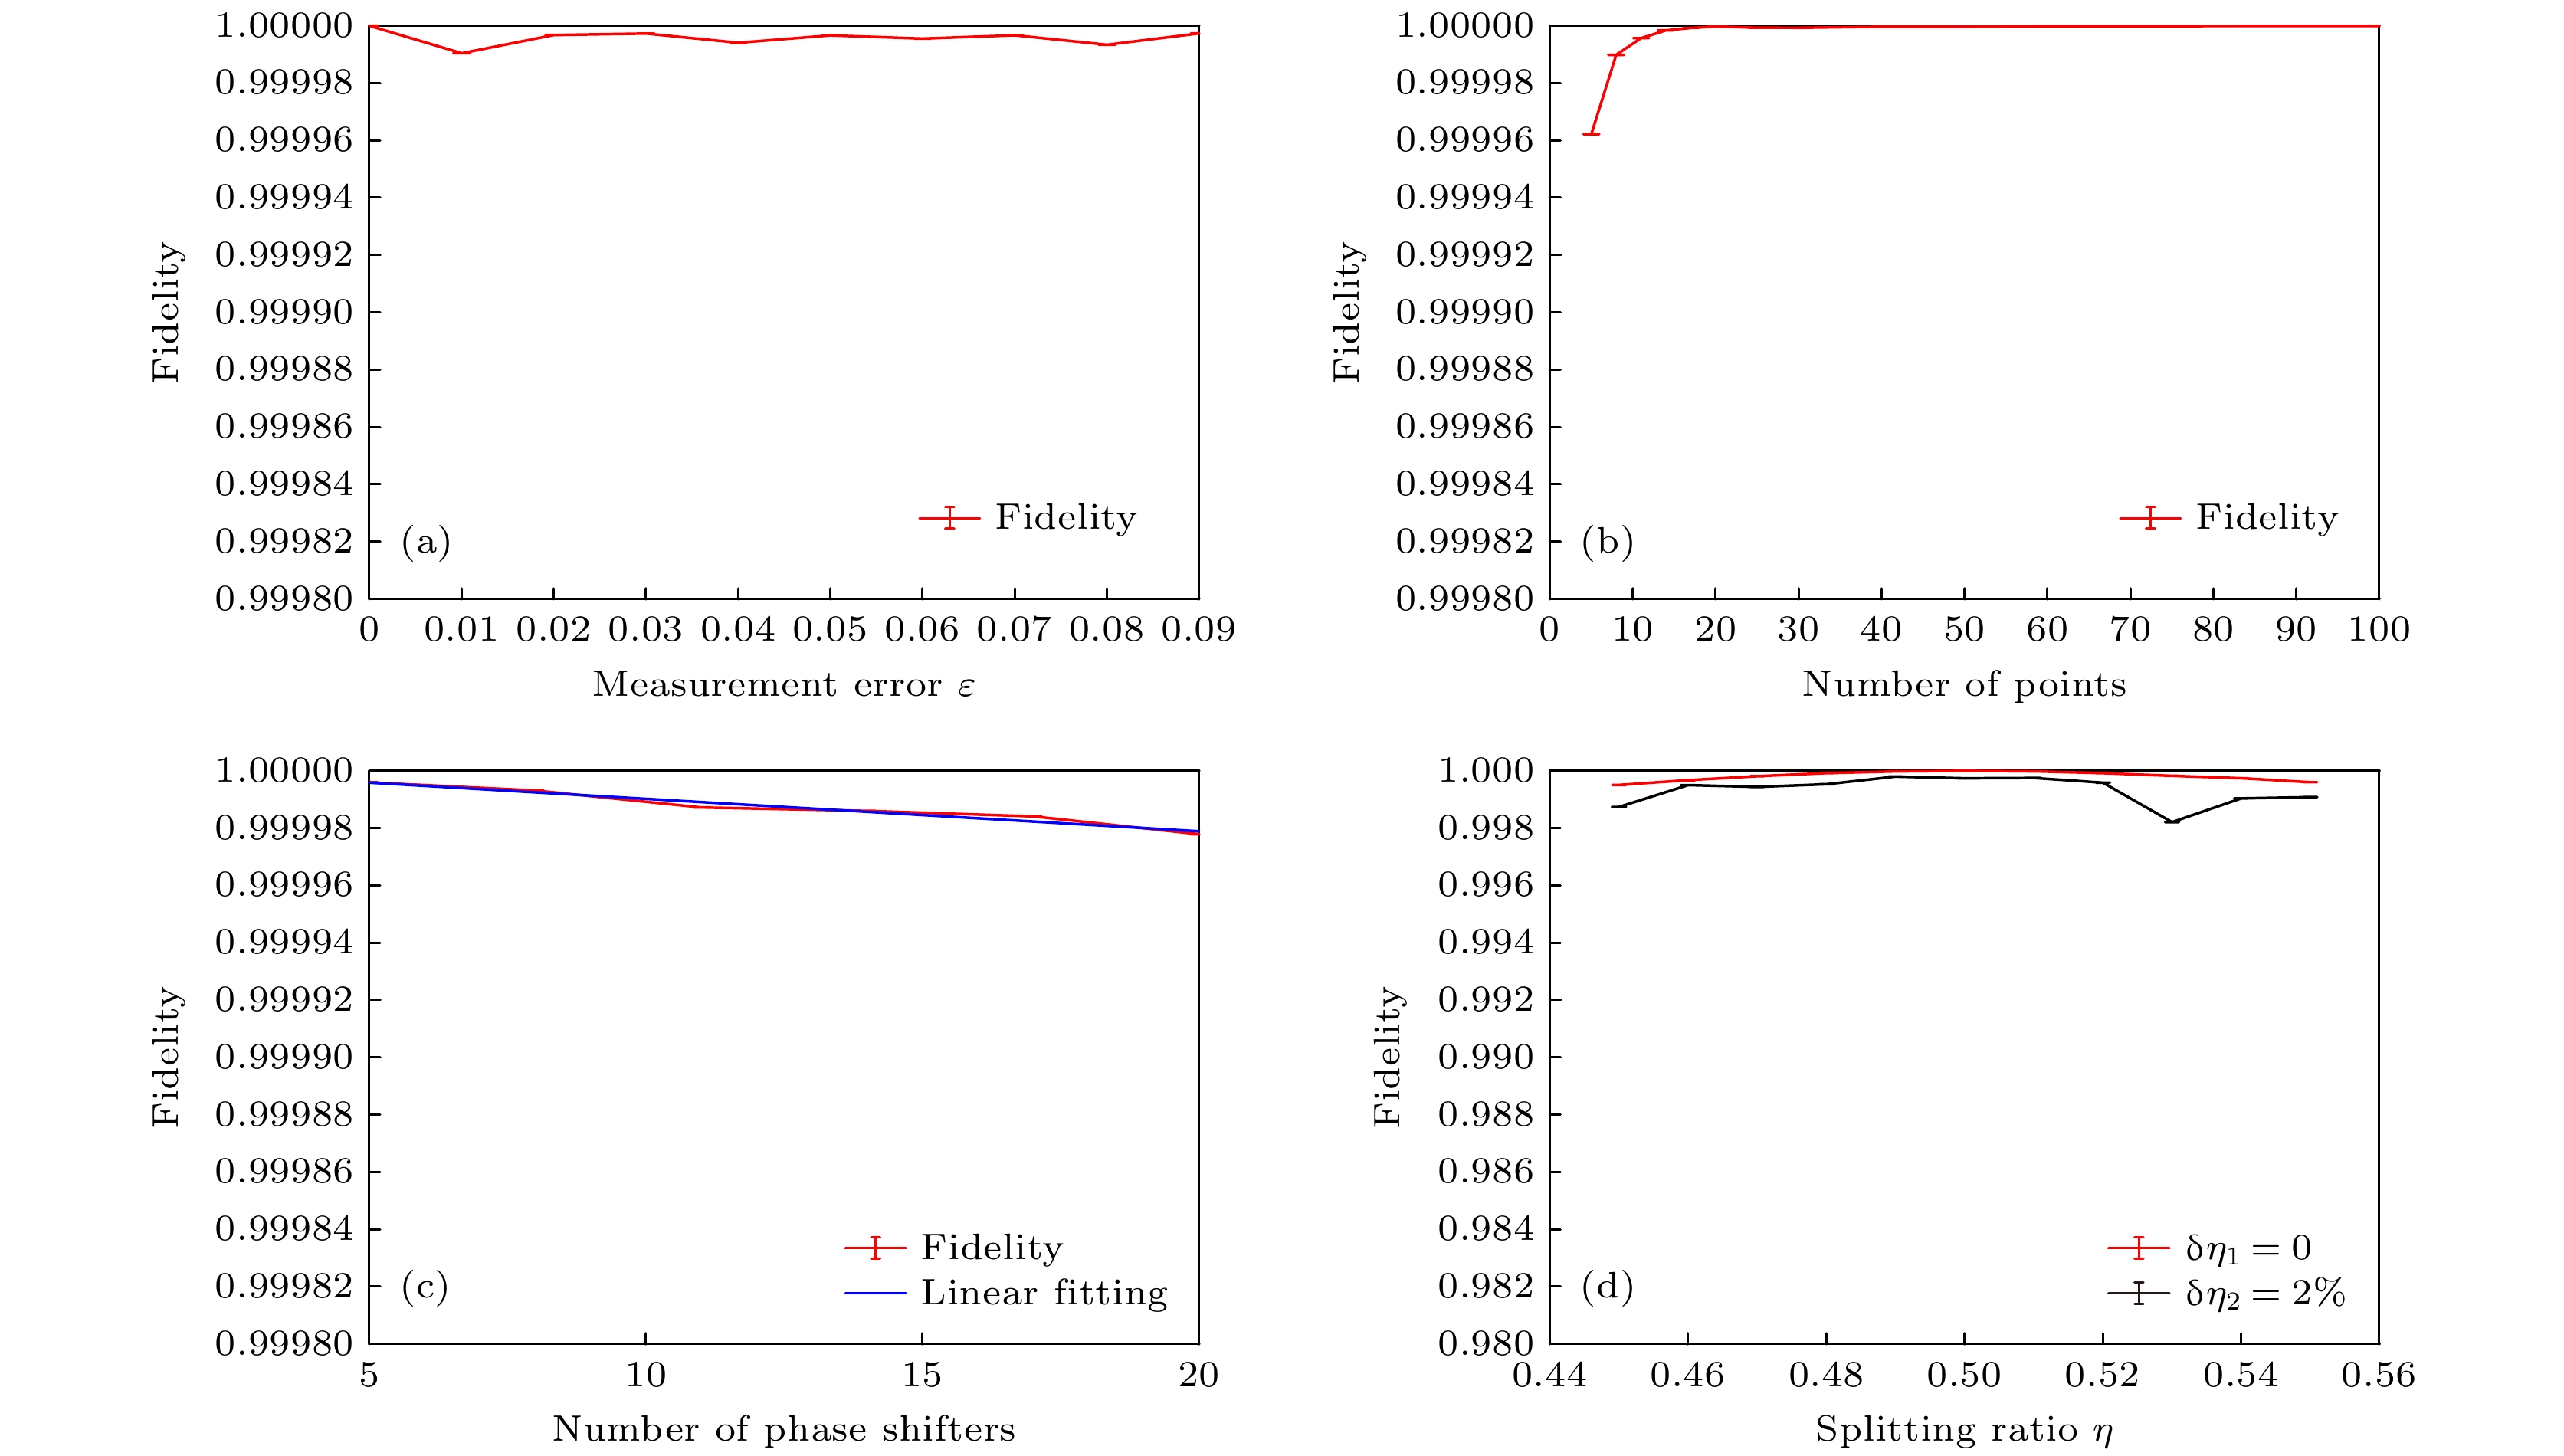 图 9 (a)不同实验测量误差对保真度的影响; (b)不同取点数量对保真度的影响; (c)不同数量移相器对保真度的影响; (d)不同的MMI分光比η值对保真度的影响


