1.Key Laboratory of Underwater Acoustic Environment, Institute of Acoustics, Chinese Academy of Sciences, Beijing 100190, China 2.University of Chinese Academy of Sciences, Beijing 100049, China
Fund Project:Project supported by the National Natural Science Foundation of China (Grant Nos. 11774375, 11974375).
Received Date:03 March 2021
Accepted Date:08 April 2021
Available Online:07 June 2021
Published Online:05 September 2021
Abstract:For the reverberation experiments with a near surface source or receiver, surface reverberation arriving first after source signal is not influenced by bottom reverberation due to time-delay difference of acoustic multipath in deep water. A surface reverberation model is proposed in the paper. The Green’s function of sound propagation is described by the ray theory, and first-order small-slope approximation is employed for the surface scattering from full angle. The effect of bubbles scattering is also considered to get the surface reverberation theory. The reverberation model is verified by comparing the simulation results with the experimental data. The measured data show that the decaying rate of surface reverberation intensity decreases with the frequency increasing. Numerical calculation demonstrates that the frequency dependence is caused by the positive correlation between scattering strength and frequency, and the surface reverberation at low frequency for low sea state is dominated by the scattering from rough air-sea interface. Moreover, the reverberation data from experiment show that the surface reverberation is not sensitive to the change of receiving depth. A method of inversion for the two surface-wave spectral parameters in the model is achieved based on the reverberation model. The inversion results verify that the spectral parameters of rough surface can be obtained from surface reverberation data on the premise of the wind speed parameter. As a result, the scattering properties of rough interface will be obtained. Keywords:deep-water reverberation/ small-slope approximation/ ray/ scattering at surface roughness
在1/3倍频程带宽内对实验记录的声信号数据进行滤波, 以0.05 s步长、0.1 s窗长平滑平均处理, 根据声弹源级对混响强度进行归一化处理后给出混响级曲线, 将海面反射信号到达接收位置的时刻作为零时刻. 图2(a)和图2(b)分别给出声源于1000 m定深爆炸后31和86 m深度处接收到的海面混响强度随时间的变化, 中心频率为1 kHz. 图中黑色虚线为十组声弹测得的原始混响数据, 蓝色实线为重复性实验平均处理后得到的混响强度衰减趋势, 将爆炸声信号到达接收点前2 s环境噪声强度的平均值作为背景环境噪声强度, 蓝色虚线为归一化处理后的环境噪声级(NL), 红色虚线标注给出混响噪声比(RNR)等于6 dB, 即混响级高于环境噪声级6 dB对应的混响级. 可以发现, 重复测量得到的混响强度衰减趋势基本一致, 混响强度以相对平滑的趋势逐渐衰减, 不存在起伏包络的现象, 故认为此时体积混响对实测混响的影响可以忽略. 图 2 实测海面混响强度衰减趋势 (a) 接收深度31 m; (b) 接收深度86 m Figure2. Decaying trend of surface reverberation intensity measured in deep water: (a) Receiving at depth of 31 m; (b) receiving at depth of 86 m.
为分析深海混响的时间结构, 这里数值仿真实验环境下无指向性声源发射声信号后, 形成海面混响、海底混响的多途声线路径. 基于互易定理, 图3分别给出31和86 m深度处的出射声线轨迹示意图, 其中黑色实线代表出射角指向海底, 蓝色实线代表出射角指向海面. 以海面反射信号到达水听器的时刻作为起始时刻, 由路径几何关系可知, 近垂向入射到海面并以近垂向大掠射角散射返回接收器的声线形成最早返回接收器的海面混响, 即紧随海面反射信号之后. 同样以近垂向入射到海底并以近垂向大掠射角散射返回接收器的声线形成最早返回接收器的海底混响. 在图3(a)中声源深度31 m、接收深度1000 m的条件下, 海底混响最早将于海面反射信号之后4.39 s到达, 在图3(b)中声源深度86 m、接收深度1000 m的条件下, 海面反射信号之后4.32 s时间内不存在海底散射声能量的干扰, 此段时间内水听器接收到的混响声信号只与海面散射有关. 图 3 声线轨迹示意图 (a)声源深度31 m; (b)声源深度86 m Figure3. Geometry of ray trace: (a) Receiving at depth of 31 m; (b) receiving at depth of 86 m.
图4(a)将图2(a)和图2(b)中两个接收深度处的平均混响强度进行比对, 可以看出, 归一化处理后31 m深度处的环境噪声级(–125.80 dB)略高于86 m深度处(–129.94 dB), 环境噪声的差异使得31 m深度处接收到的海面混响强度整体略高于86 m深度处, 而接收深度的改变对海面混响强度衰减趋势影响不明显, 两深度处接收到的海面混响大约于2.6 s开始被环境噪声淹没, 本文利用图4(a)中红色线段之间的海面混响数据进行验模及反演应用的研究. 图 4 实测混响数据比对 (a)不同接收深度间比较; (b)不同频率间比较 Figure4. Comparison of reverberation data measured in deep water: (a) Comparison between different depths; (b) comparison among different frequencies.
海面混响为粗糙界面和风成气泡散射声场的叠加, 这里数值仿真海面反向散射强度与频率间关系, 其中气泡层散射利用(24)式计算. 图6(a)给出不同频率下界面散射强度和气泡散射强度随掠射角的变化关系, 实线代表粗糙界面散射, 虚线代表气泡散射. 为构建与混响实验相符合的海面混响模型, 根据实验期间的环境参数以及实测海面混响强度衰减趋势, 选取海面粗糙界面参数${\gamma _2} = {\rm{3}}{\rm{.9}}$, ${Q_{\rm{S}}} = {\rm{5}} \times {\rm{1}}{{\rm{0}}^{ - 5}}\;{{\rm{m}}^3} \cdot {\rm{s}}$. 从图6(a)可以看出, 对于粗糙界面散射, 不同频率对应的散射强度相差不大, 而对于气泡散射, 散射强度随着频率升高逐渐增大. 图6(b)中虚线为叠加气泡散射和粗糙界面散射后得到的海面散射强度随掠射角的变化关系, 与实线给出的粗糙界面散射强度对比可以发现, 频率为1 kHz的海面散射强度和界面散射强度基本重合, 此时气泡散射作用对海面散射强度基本无影响. 由于气泡散射强度与频率之间的正相关, 随着频率升高, 小掠射角范围的海面散射强度逐渐高于粗糙界面散射强度, 且两者间差值逐渐增大. 本文重点分析海面粗糙界面散射形成的深海海面混响, 为减小气泡层散射对海面混响强度衰减趋势的干扰, 后文工作中将选取中心频率1 kHz的混响数据进行研究. 图 6 不同频率下界面反向散射强度随掠射角变化关系 (a)气泡和界面散射强度; (b)界面和总散射强度 Figure6. Grazing-angle dependence of backscattering strength at different frequency: (a) Scattering strength of bubble and interface; (b) scattering strength of interface and the superposition of bubble and interface.
24.2.海面混响数值估计 -->
4.2.海面混响数值估计
图7分别给出不考虑环境噪声、叠加环境噪声的海面混响强度数值仿真结果, 并与实测海面混响强度进行比对, 其中图7(a)接收深度31 m, 图7(b)接收深度86 m. 可以看出, 叠加环境噪声的混响强度结果与实验数据整体符合较好, 说明选取的海面粗糙界面参数适用于该实验环境. 对比不考虑噪声的混响强度计算结果可以看出, 图7中1 s之前的海面混响强度预报结果与实验数据符合较好, 由于海面混响强度衰减较快, 海面混响强度的数值预报结果在1 s之后与实测数据间的差异逐渐增大, 说明该时刻之后的实验数据不能直接代表海面混响强度, 因此后文将利用1 s之前的数据对该海区的海面粗糙界面散射特性进行反演. 此外, 根据对图4(a)中的数据分析可以得到, 不考虑噪声影响后, 相比于86 m深度处混响数据的拟合结果, 31 m深度处的数据拟合效果更差, 这是31 m深度处的环境噪声级相对更高造成的. 图 7 海面混响强度拟合 (a) 接收深度31 m; (b) 接收深度86 m Figure7. Comparison between modeling simulation and measured data: (a) Receiving at depth of 31 m; (b) receiving at depth of 86 m.
利用(21)式给出的海面混响强度与海面粗糙界面散射特性间关系, 基于图4(a)中两组实测混响数据, 图9(a)和图9(b)中黑色实线为根据(22)式计算得到的海面粗糙界面散射强度随时间的变化关系, 蓝色实线为反演得到的结果, 其中图9(a)接收深度31 m, 图9(b)接收深度86 m. 从图9(a)可以看出, 反演所得粗糙界面散射强度特性在0.8 s前与基于小斜率近似给出的散射模型符合较好, 随着时间的推移, 由于混响强度减小, 环境噪声影响增大, 基于实验数据得到的散射强度结果与散射模型相差逐渐增大. 图9(b)中基于实测数据得到的散射强度在1.2 s之前与理论计算结果基本符合, 随后二者间差值逐渐增大. 结合图8和图9可以发现, 当收发深度一致时, 入射掠射角与散射掠射角大小相同, 可以通过时间的对应关系得到海面散射强度与掠射角之间的关系. 当收发深度不同时, 通过反演计算参数${Q_{\rm{s}}}$和${\gamma _2}$可以得到海面粗糙界面散射特性. 图 9 海面散射强度与时间关系反演结果 (a) 接收深度31 m; (b) 接收深度86 m Figure9. Inversion results of the time dependence of surface scattering strength: (a) Receiving at depth of 31 m; (b) receiving at depth of 86 m.
根据(25)式给出的代价函数对参数${Q_{\rm{s}}}$和${\gamma _2}$进行反演, 图10给出了归一化处理后的代价函数随海面粗糙界面谱参数的数值变化, 可以看出, 代价函数最大时的参数结果为${\gamma _2} = {\rm{3}}{\rm{.9}}$, ${Q_{\rm{s}}} = {\rm{5}} \times $$ {\rm{1}}{{\rm{0}}^{ - 5}}\;{{\rm{m}}^3} \cdot {\rm{s}}$, 与海面混响拟合过程中所选取的参数符合. 此外, 代价函数对谱指数${\gamma _2}$相对不敏感. 图 10 海面粗糙界面谱参数反演结果 (a) 接收深度31 m; (b) 接收深度86 m Figure10. Inversion results of the parameters of rough interface: (a) Receiving at depth of 31 m; (b) receiving at depth of 86 m.
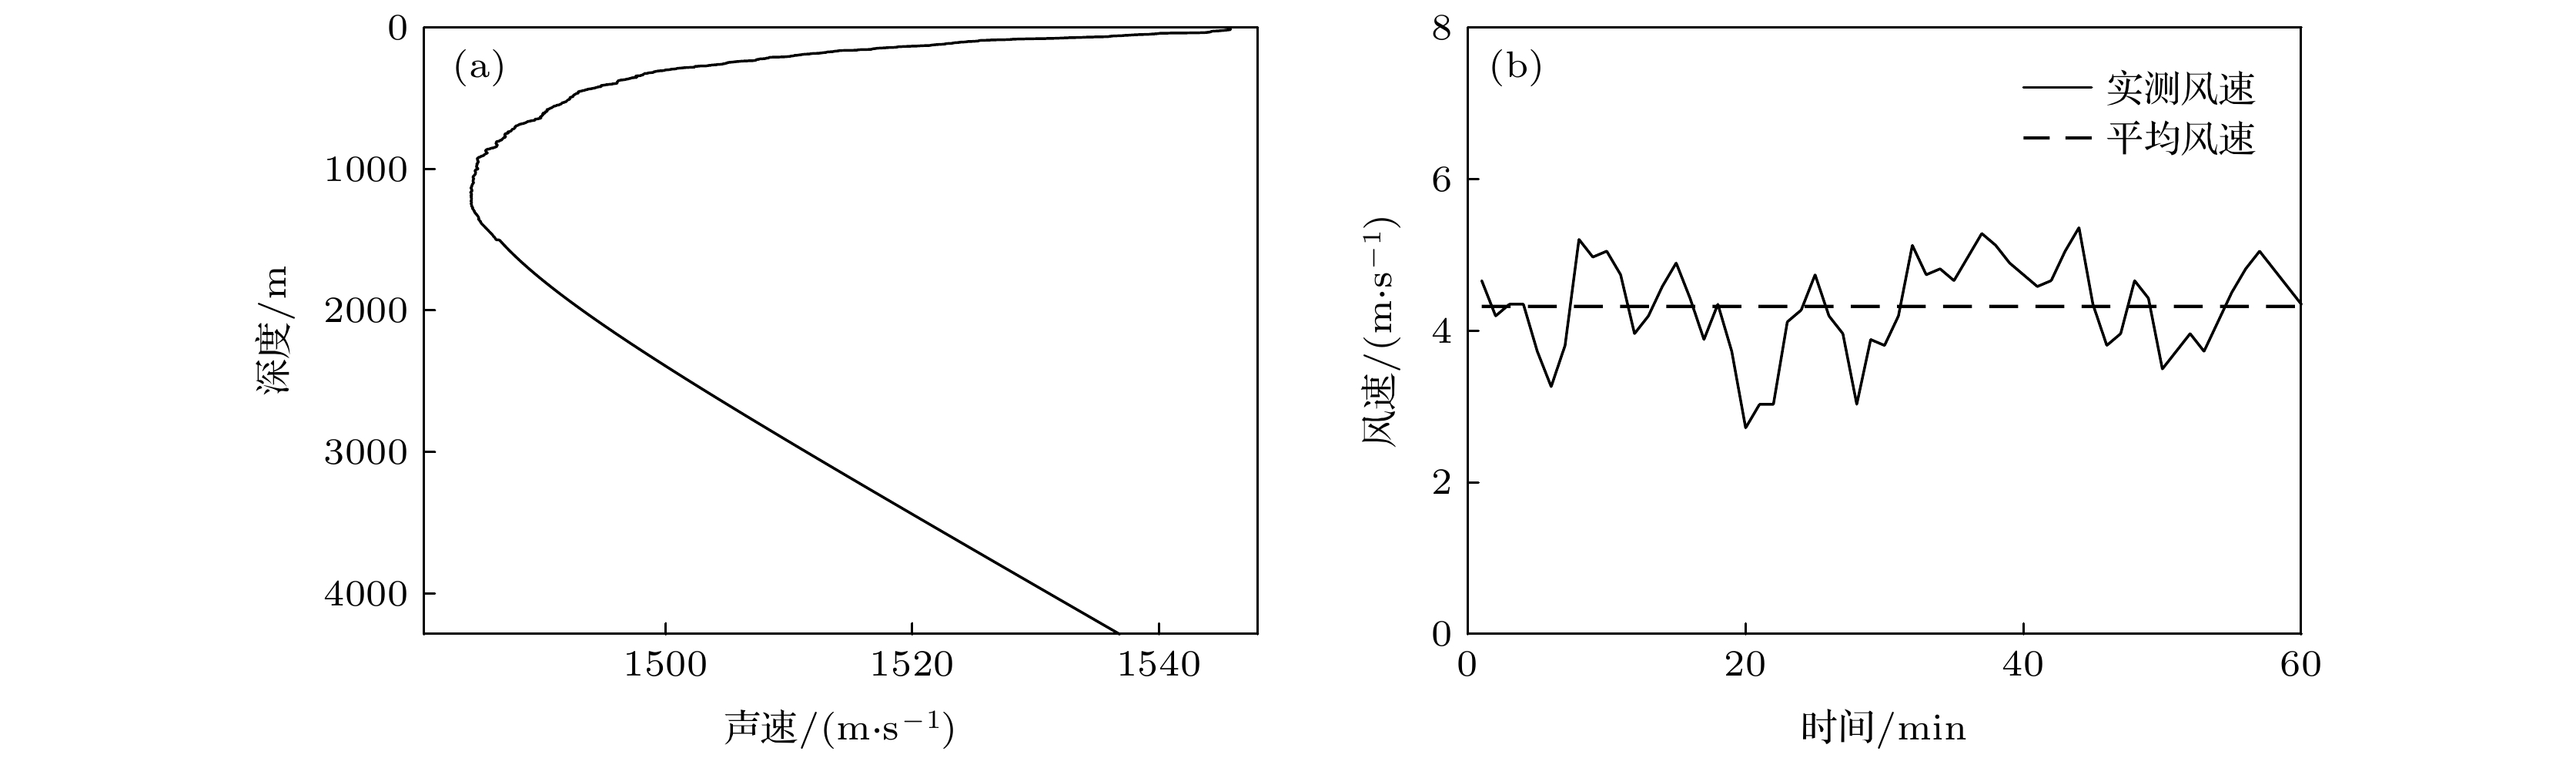 图 1 实测环境数据 (a)声速剖面; (b)平均风速
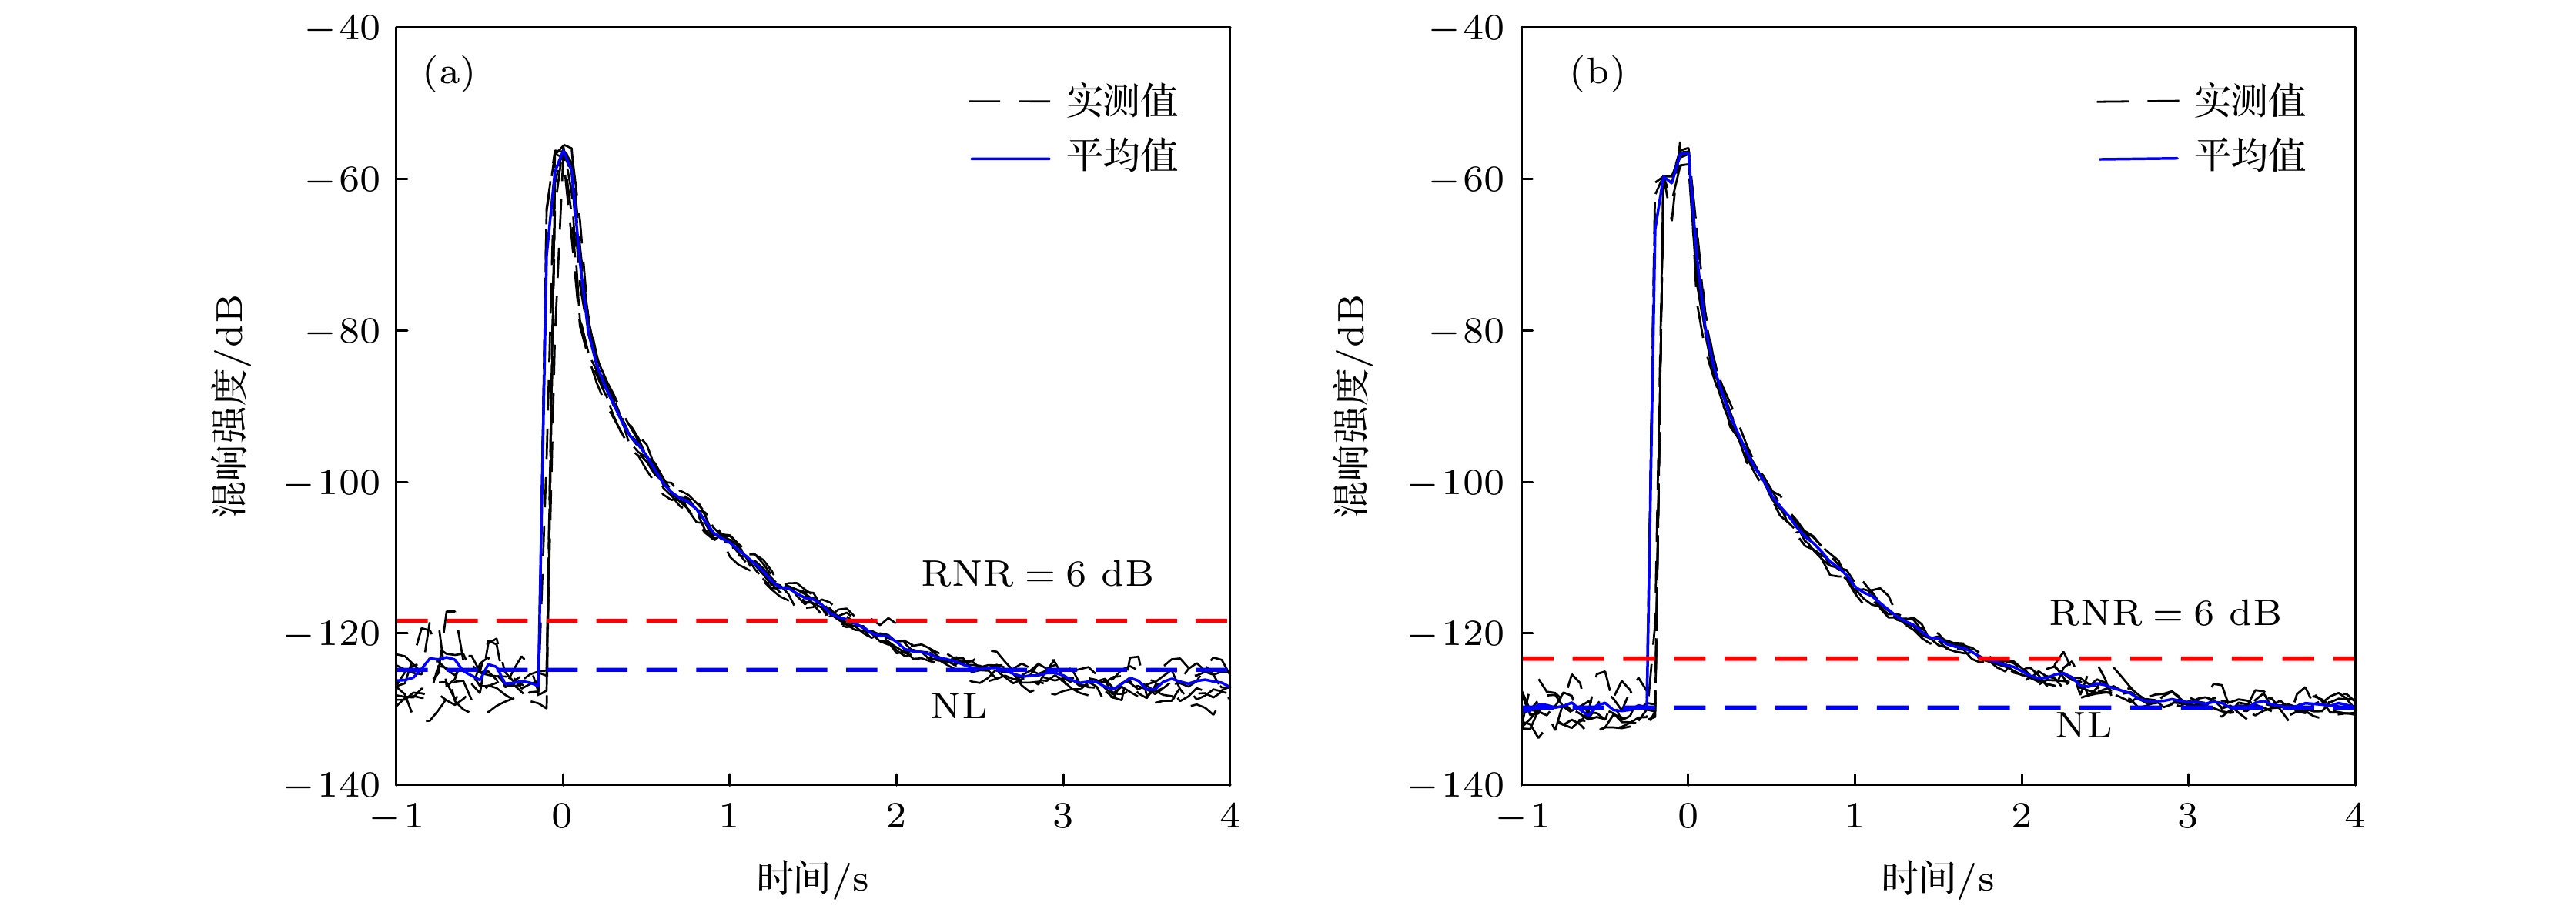 图 2 实测海面混响强度衰减趋势 (a) 接收深度31 m; (b) 接收深度86 m
 图 3 声线轨迹示意图 (a)声源深度31 m; (b)声源深度86 m
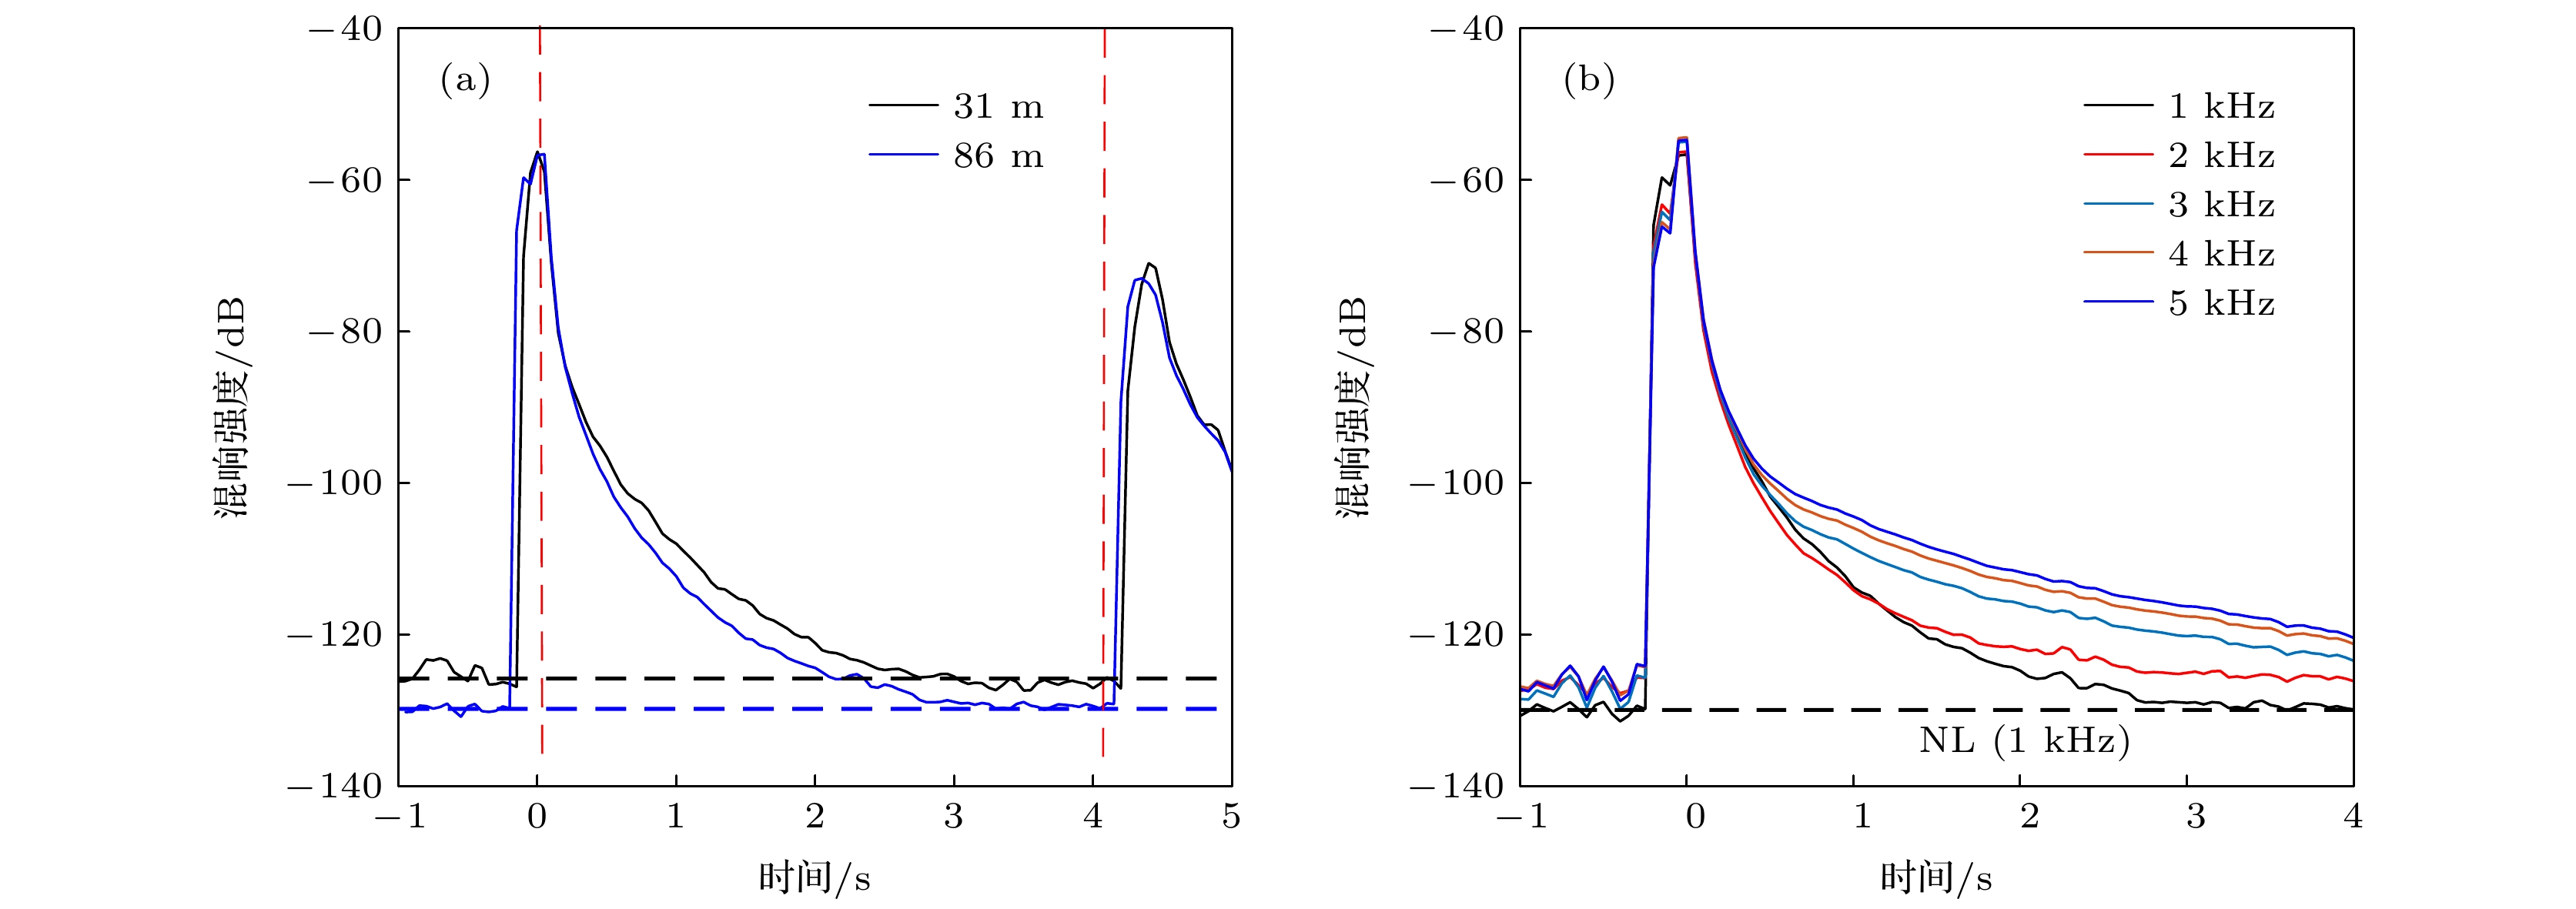 图 4 实测混响数据比对 (a)不同接收深度间比较; (b)不同频率间比较
 图 5 深海海面混响示意图


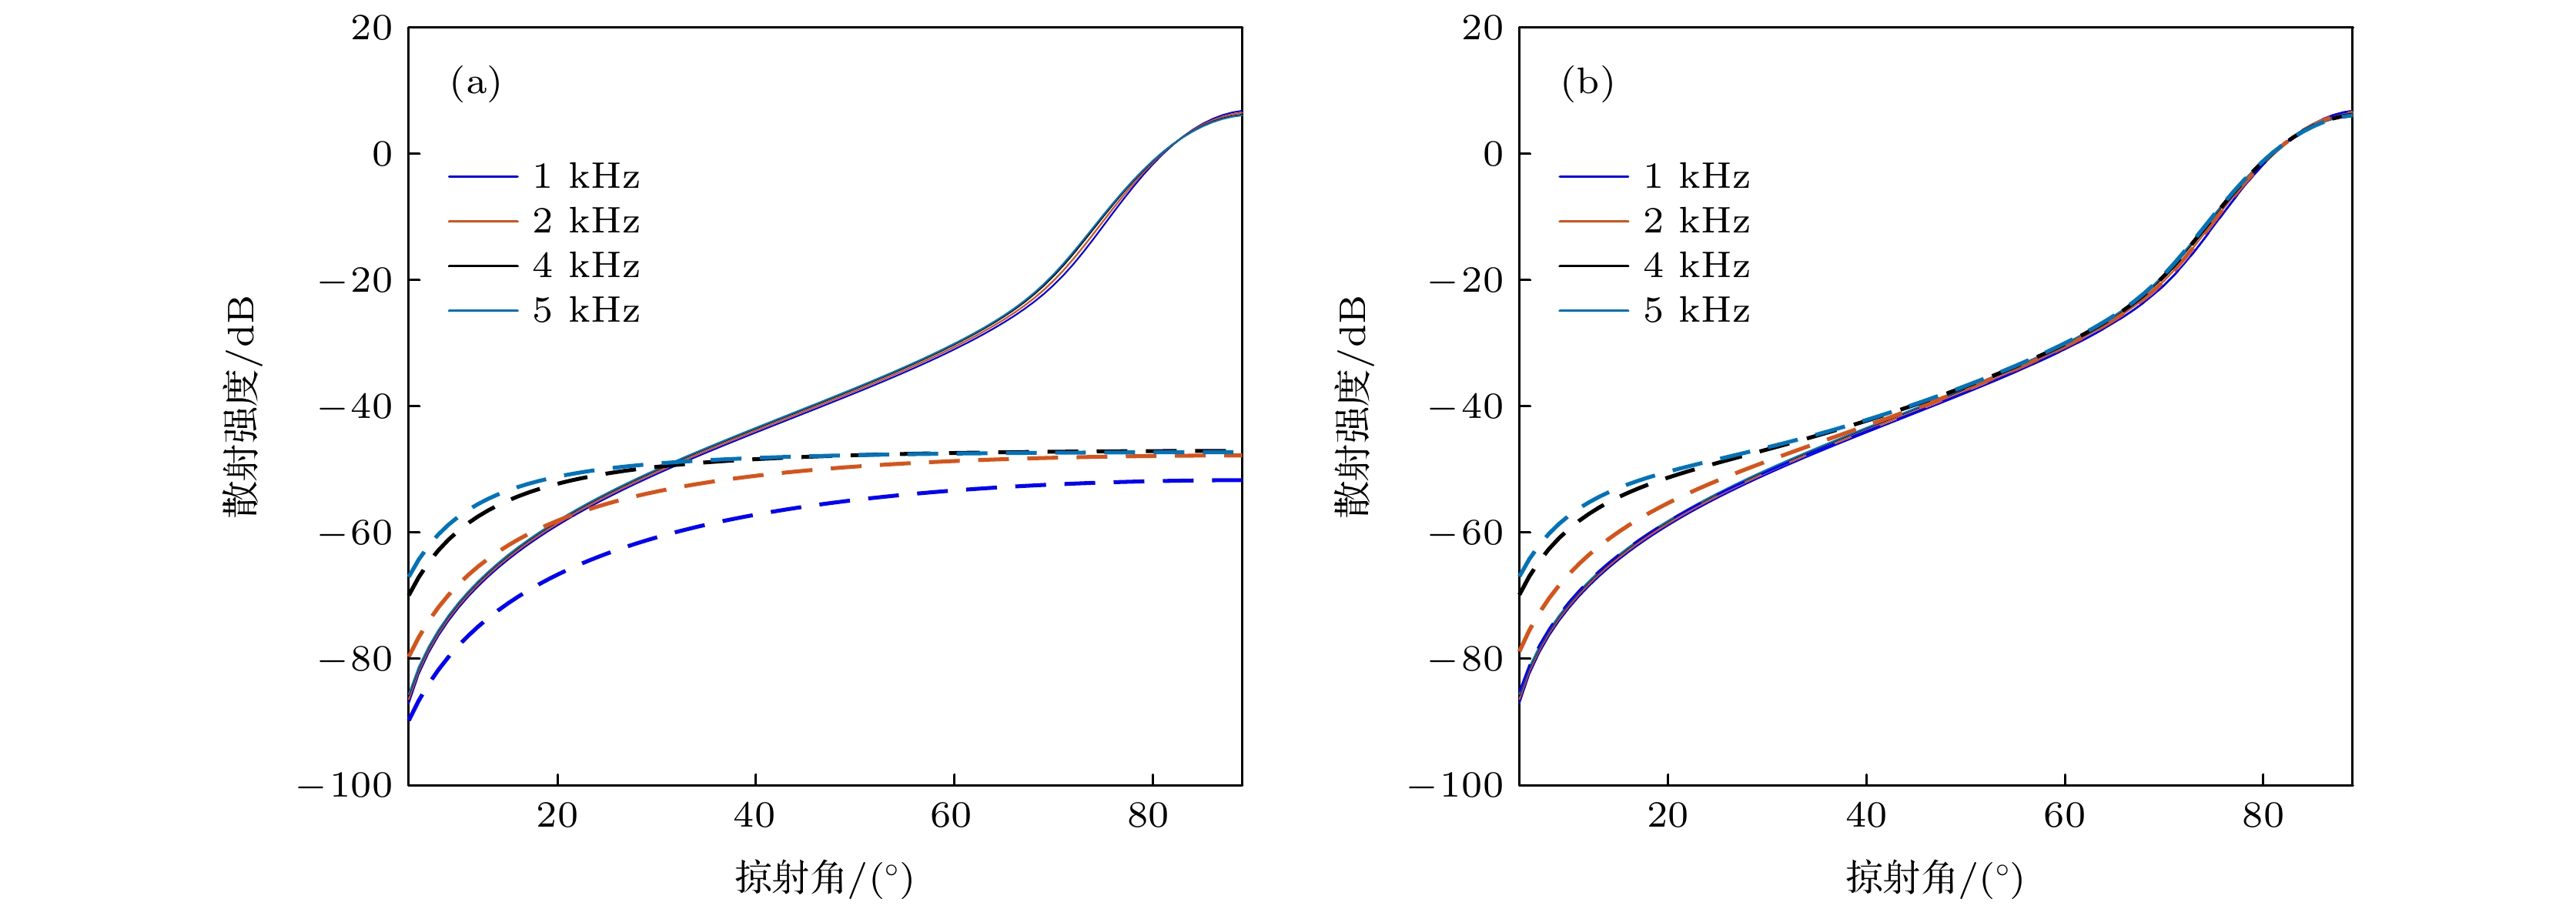 图 6 不同频率下界面反向散射强度随掠射角变化关系 (a)气泡和界面散射强度; (b)界面和总散射强度
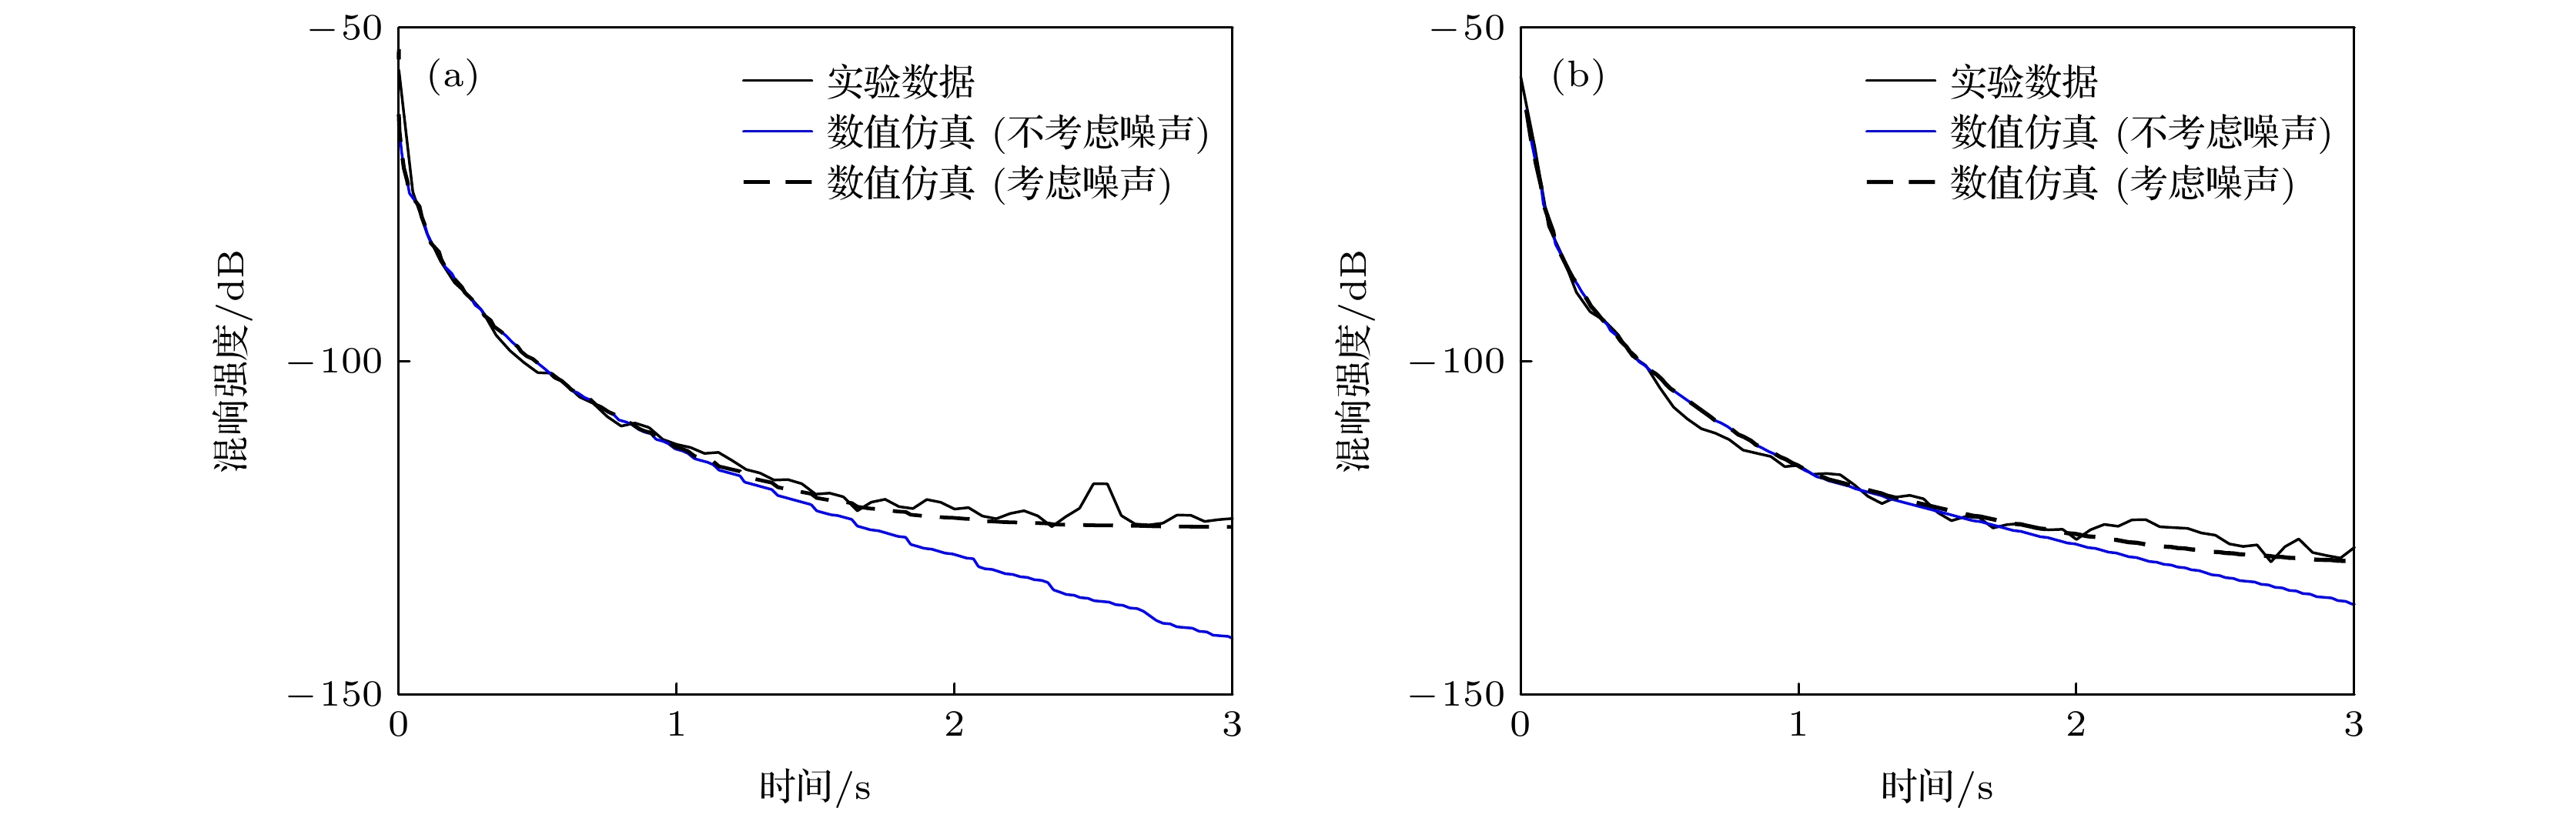 图 7 海面混响强度拟合 (a) 接收深度31 m; (b) 接收深度86 m


 图 8 掠射角随时间的变化关系

 图 9 海面散射强度与时间关系反演结果 (a) 接收深度31 m; (b) 接收深度86 m


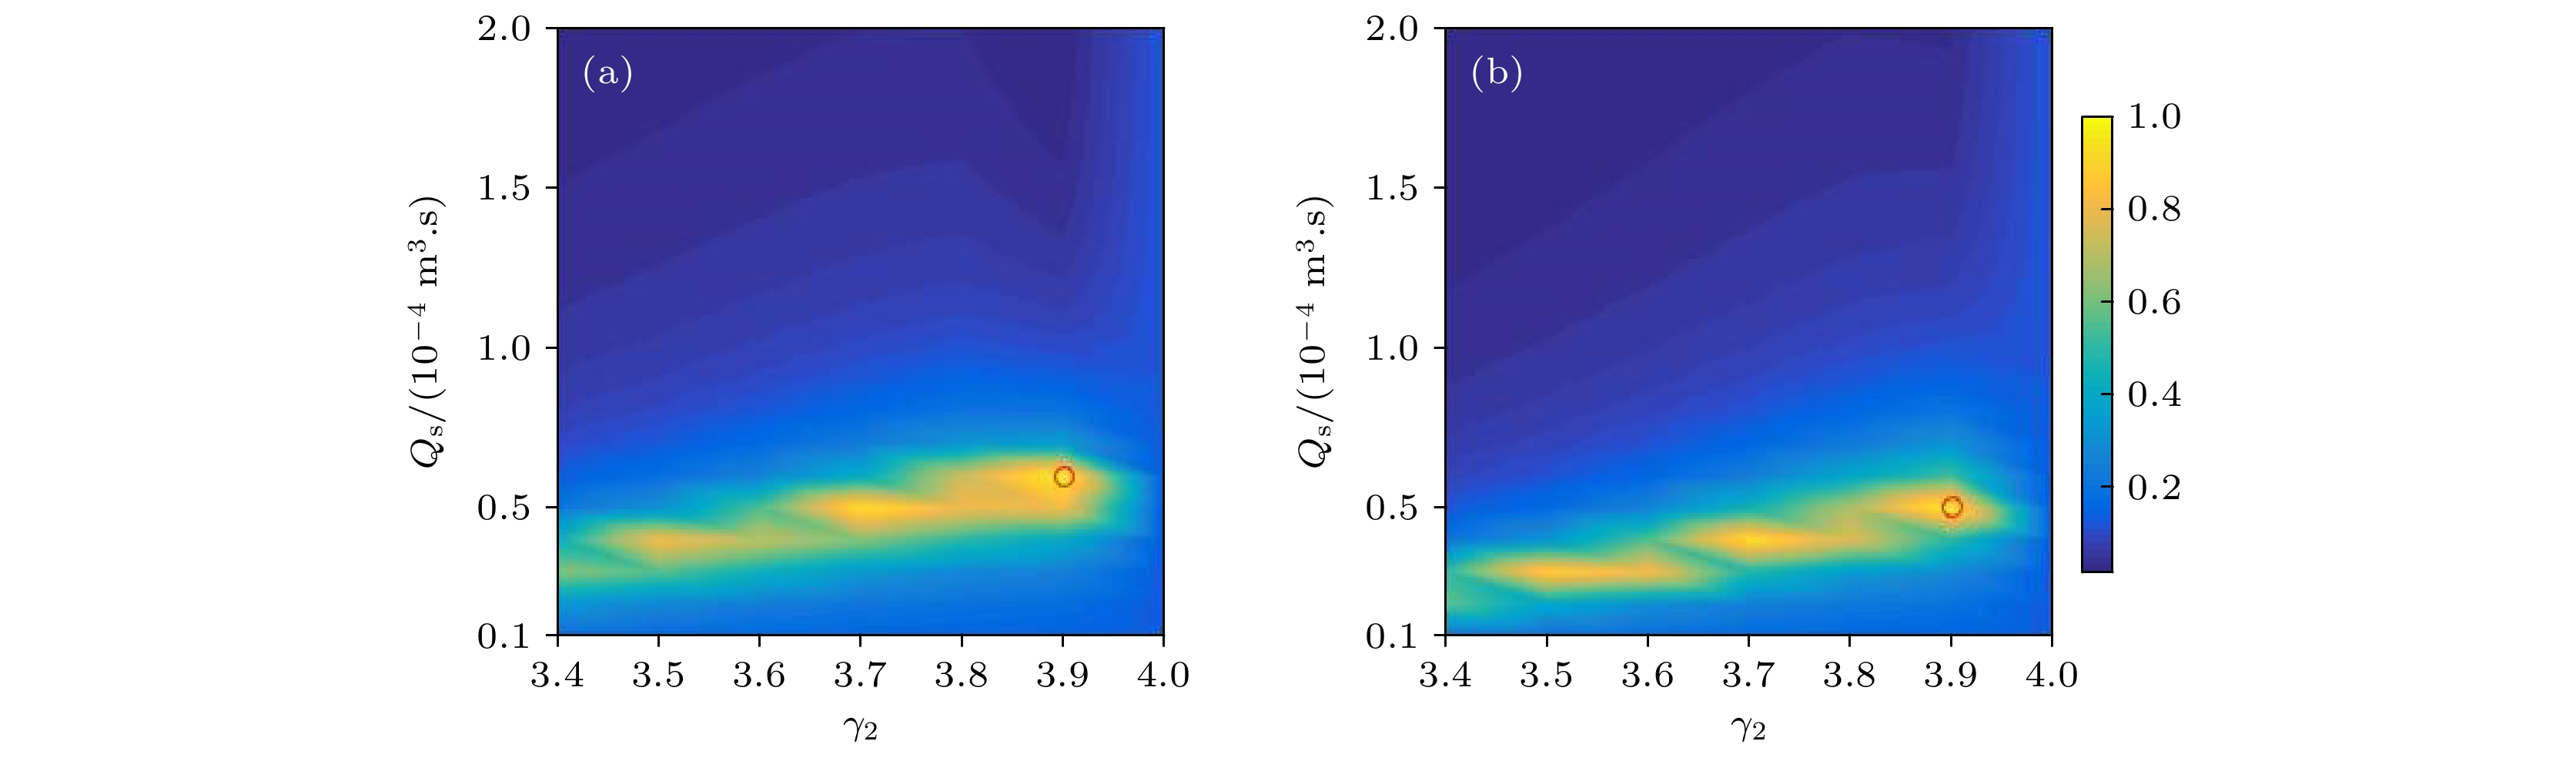 图 10 海面粗糙界面谱参数反演结果 (a) 接收深度31 m; (b) 接收深度86 m

