1.State Key Laboratory of Quantum Optics and Quantum Optics Devices, Institute of Opto-Electronics, Shanxi University, Taiyuan 030006, China 2.Collaborative Innovation Center of Extreme Optics, Shanxi University, Taiyuan 030006, China
Fund Project:Project supported by the National Natural Science Foundation of China (Grants Nos. 62027821, 11654002, 11874250, 11804207, 11804206, 62035015), the National Key R&D Program of China (Grant No. 2020YFC2200402), the Key R&D Program of Shanxi Province, China (Grant No. 201903D111001), the Natural Science Basic Research Program of Shaanxi Province, China (Grant No. 2019JQ-943), the Program for Sanjin Scholar of Shanxi Province, China, the Fund for Shanxi 1331 Project Key Subjects Construction, China, and the Program for the Top Young and Middle-aged Innovative Talents of Higher Learning Institutions of Shanxi Province, China
Received Date:11 February 2021
Accepted Date:04 March 2021
Available Online:07 June 2021
Published Online:05 August 2021
Abstract:Generation and manipulation of continuous variable quantum states are the building blocks of quantum communication, quantum key distribution and quantum networks. According to the second-order nonlinear process of the periodically-poled potassium titanyl phosphate (PPKTP) crystal, we design a semi-monolithic optical parametric amplifier (OPA) cavity to generate the bright squeezed light at a wavelength of 1064 nm. With the injection of a seed beam, the squeezed state generated by the OPA has a coherent amplitude, so called bright squeezed state. The squeezing level is directly observed to be –11.6 dB when the pump power is 310 mW at an analysis frequency of 3 MHz. However, with the increase of the pump power, the purity of the squeezed state gets lower and lower due to the increased influence of the anti-squeezing quadrature component on the squeezed quadrature component in the detection process. To obtain a higher purity of the squeezed state for achieving linear optical manipulation and quantum tomography, we choose the pump power of 50 mW, the squeezing level decreases to –6 dB, and the purity of the squeezed state is 98.5% in this case. An electro-optic modulator is adopted to realize the liner manipulation of the squeezed light in the phase space. During the measurement of the bright squeezed state, all the data are taken on condition that the length of the OPA cavity and relative phase between the seed beam and the pump beam are locked by a locking loop. The direct current (DC) signal of the balanced homodyne detection (BHD) is used to accurately determine the phase corresponding to the time domain signal of the squeezed state, while the alternate current (AC) signal of the BHD is mixed with the signal generated by the function generator, after passing through a low-pass filter and a high-pass filter, the signal is then amplified by using a low-noise amplifier. A high-performance oscilloscope is finally used to simultaneously collect the signals, thus obtaining the quantum noise signal of the bright squeezed light after linear manipulation. Together with the maximum likelihood estimation algorithm, the quantum tomography, the density matrix and the Wigner function of the bright squeezed light are obtained, that is, all the information such as the photon number distribution of the quantum state is determined. Multiple iterations are taken in the maximum likelihood estimation algorithm process to eliminate the influence of the low quantum efficiency on the detection system, so that the density matrix is fitted well with the theoretical results. Keywords:bright squeezed state/ quantum tomography/ Winger function/ maximum likelihood estimation/ optical linear manipulation
4.实验测量与结果分析首先在不施加线性平移操控时, 利用频谱分析仪测量了明亮压缩态光场的压缩度, 实验结果如图2所示. 当OPA泵浦光功率为310 mW时, 在分析频率为3 MHz处, 明亮压缩态光场的压缩度为–11.6 dB, 反压缩为23 dB. 图 2 压缩和反压缩随泵浦功率的变化趋势图, 分析频率为3 MHz, 分辨率带宽(RBW)为300 kHz, 视频带宽(VBW) 200 Hz. 所有的数据点均包括探测器的电子学噪声的影响, 为直接测量结果 Figure2. Pump power dependence of anti-squeezed and squeezed quadrature variances. These measurements are recorded at a Fourier frequency of 3 MHz, with a resolution bandwidth (RBW) of 300 kHz and a video bandwidth (VBW) of 200 Hz. The data still include electronic noise, and represent direct observations.
利用索雷博功率计(Thorlabs S130 C)对每个泵浦光功率点进行10次测量, 并取平均值作为泵浦光功率, 但由于功率计存在 ± 3%的测量不确定度, 故图2中泵浦光功率越高, 测量误差越大, 横坐标误差棒相应变大; 此外, 随着泵浦光功率增加, 反压缩分量量子噪声方差急剧增加以及晶体非线性损耗增加, 致使锁定并测量反压缩分量时, 相位抖动要比测量压缩分量时要大, 导致反压缩分量误差棒大于压缩分量误差棒. 然而, 在泵浦光功率较大时, 虽然所制备压缩态的压缩度较大, 但此时反压缩分量噪声也较大, 其量子态纯度较低, 这样的量子态无法实现猫态、混合量子纠缠态以及幺正变换. 所以本文选取泵浦光功率为50 mW进行明亮压缩态光场的线性操控以及量子层析, 此时压缩度为–6 dB, 反压缩为6.13 dB, 纯度为98.5%. 紧接着利用示波器同时采集平衡零拍探测器输出的直流信号(图3(a)和图3(c)中黑色曲线)和解调出来的正交分量量子噪声分布交流信号(图3(a)和图3(c)中蓝色数据点), 值得注意的是图3(a)和图3(c)中蓝色数据点已经以量子噪声极限时域信号进行了归一化处理. 通过在EOM3上施加频率为3 MHz的正弦信号, 其调制深度远小于1, 进行压缩态光场线性平移操控, 由于是相位调制, 所以在相空间中是相位分量上的平移. 此时, 需要调节同频解调信号的相位使得相对相位为零, 之后通过示波器同时进行直流信号和量子噪声交流信号采集, 从而得到进行线性平移操控后明亮压缩态光场的量子噪声信号, 实验结果如图3(c)所示. 图 3 (a), (b)未进行线性操控的明亮压缩态噪声时域测量结果及量子层析后对应的密度矩阵; (c), (d)进行线性操控后的明亮压缩态噪声时域测量结果及量子层析后对应的密度矩阵 Figure3. (a), (b) Time domain signal and corresponding density matrix of bright squeezed state before linearly manipulating, respectively; (c), (d) time domain signal and corresponding density matrix of linearly manipulated bright squeezed state, respectively.
从图3(a)和图3(c)可以看出, 平衡零拍探测器直流信号实际是明亮压缩态光场与本地振荡光场之间的干涉信号, 干涉信号最大值或最小值对应压缩光和本地振荡光相对相位为0以及π的情况, 同时对应量子态正交振幅分量的量子噪声; 干涉信号曲线值为0, 则对应压缩光和本地振荡光相对相位为π/2以及3π/2的情况, 同时对应量子态正交位相分量的量子噪声. 此外, 从图3可知, 由于压电陶瓷伸缩量不均匀会导致扫描相位不均匀, 也就是说采集的量子噪声时域信号对应的相位关系不是均匀的, 如果采取均匀分配相位进行量子层析必将引入一定的人为误差; 然而, 通过采用直流信号幅值反推出相位信息则可以避免这一误差, 使得测量结果更具普适性和准确性. 紧接着选取出时域信号在一个完整周期(0—2π)的数据, 并拟合出直流干涉信号对应的函数以及通过反三角函数就可以算出量子噪声信号对应的相位. 之后, 通过极大似然估计算法得到对应时域数据的密度矩阵, 图3(b)和图3(d)分别为计算线性平移操控前后通过时域数据得到的密度矩阵的实部图. 在理论上, 由参量下转化过程制备的压缩态光场为偶光子数态, 然而, 实际实验中由于系统损耗和不完美的探测器量子效率等因素会导致奇光子数态的出现[46]. 密度矩阵的对角元代表Fock态下光子数分布概率, 线性操控光学前后明亮压缩态光场在3 MHz分析边带的光子数分布概率如图4(a)和图4(b)所示. 图 4 明亮压缩态光场在3 MHz分析边带的光子数分布概率 (a)线性操控光学前; (b)线性操控光学后 Figure4. Photon number distribution of the bright squeezed state at 3 MHz: (a) Before linearly manipulating optics; (b) after linearly manipulating optics.
其中$\varDelta (q, p) = \exp [ - 2({\hat a^{\dagger} } - {\alpha ^*})(\hat a - \alpha )]/\pi $为Wigner算符, ${\hat a^{\dagger} }$和$\hat a$分别为光场的产生和湮灭算符, 相干态的幅度$\alpha = (q + {\rm i}p)/\sqrt 2$. 将极大似然估计重构得到的密度矩阵代入(5)式, 计算出对应的Wigner函数, 结果如图5所示. 图5(c)和图5(d)中红虚线为Wigner函数取最大值时对应的振幅分量(p)和位相分量(q)坐标, 用来直观地表征线性平移操控的效果; 黑色虚线圆是真空态的量子噪声起伏范围(半径为1的圆), 用于直观表征压缩态与真空态在相空间的分布. 作为对比, 将同一信号进行传统均匀相位分配方法进行量子层析过程, 实验结果如图5(e)以及图5(f)所示, 从实验结果可知, 当扫描相位近似为均匀扫描时, 利用均匀相位分配法才可以得到正确的量子层析结果, 然而实验环境中受压电陶瓷性能影响, 很难实现均匀扫描; 但是通过直流信号反推出相对相位则可以避免上述问题, 从而实现正确量子层析过程. 对于真空压缩态光场的量子层析过程, 也可以使用拍频信号反推出相对相位信息[47]. 图 5 (a), (c)从极大似然估计重构得到的无调制时的明亮压缩态Wigner函数和等高线图; (b), (d)从极大似然估计重构得到的光电相位调制器操控后的明亮压缩态Wigner 函数和等高线图; (e), (f)利用均匀相位分配法重构得到的无操控时以及操控后的明亮压缩态Wigner函数的等高线图 Figure5. (a), (c) Wigner function and the contour plot of the bright squeezed state obtained by maximum likelihood estimation without linearly manipulating optics, respectively; (b), (d) Wigner function and the contour plot of the squeezed state obtained by maximum likelihood estimation with linearly manipulating optics, respectively; (e), (f) Wigner functions of the bright squeezed state obtained by the method of artificially homogeneous phase distribution without or with linearly manipulating optics, respectively.


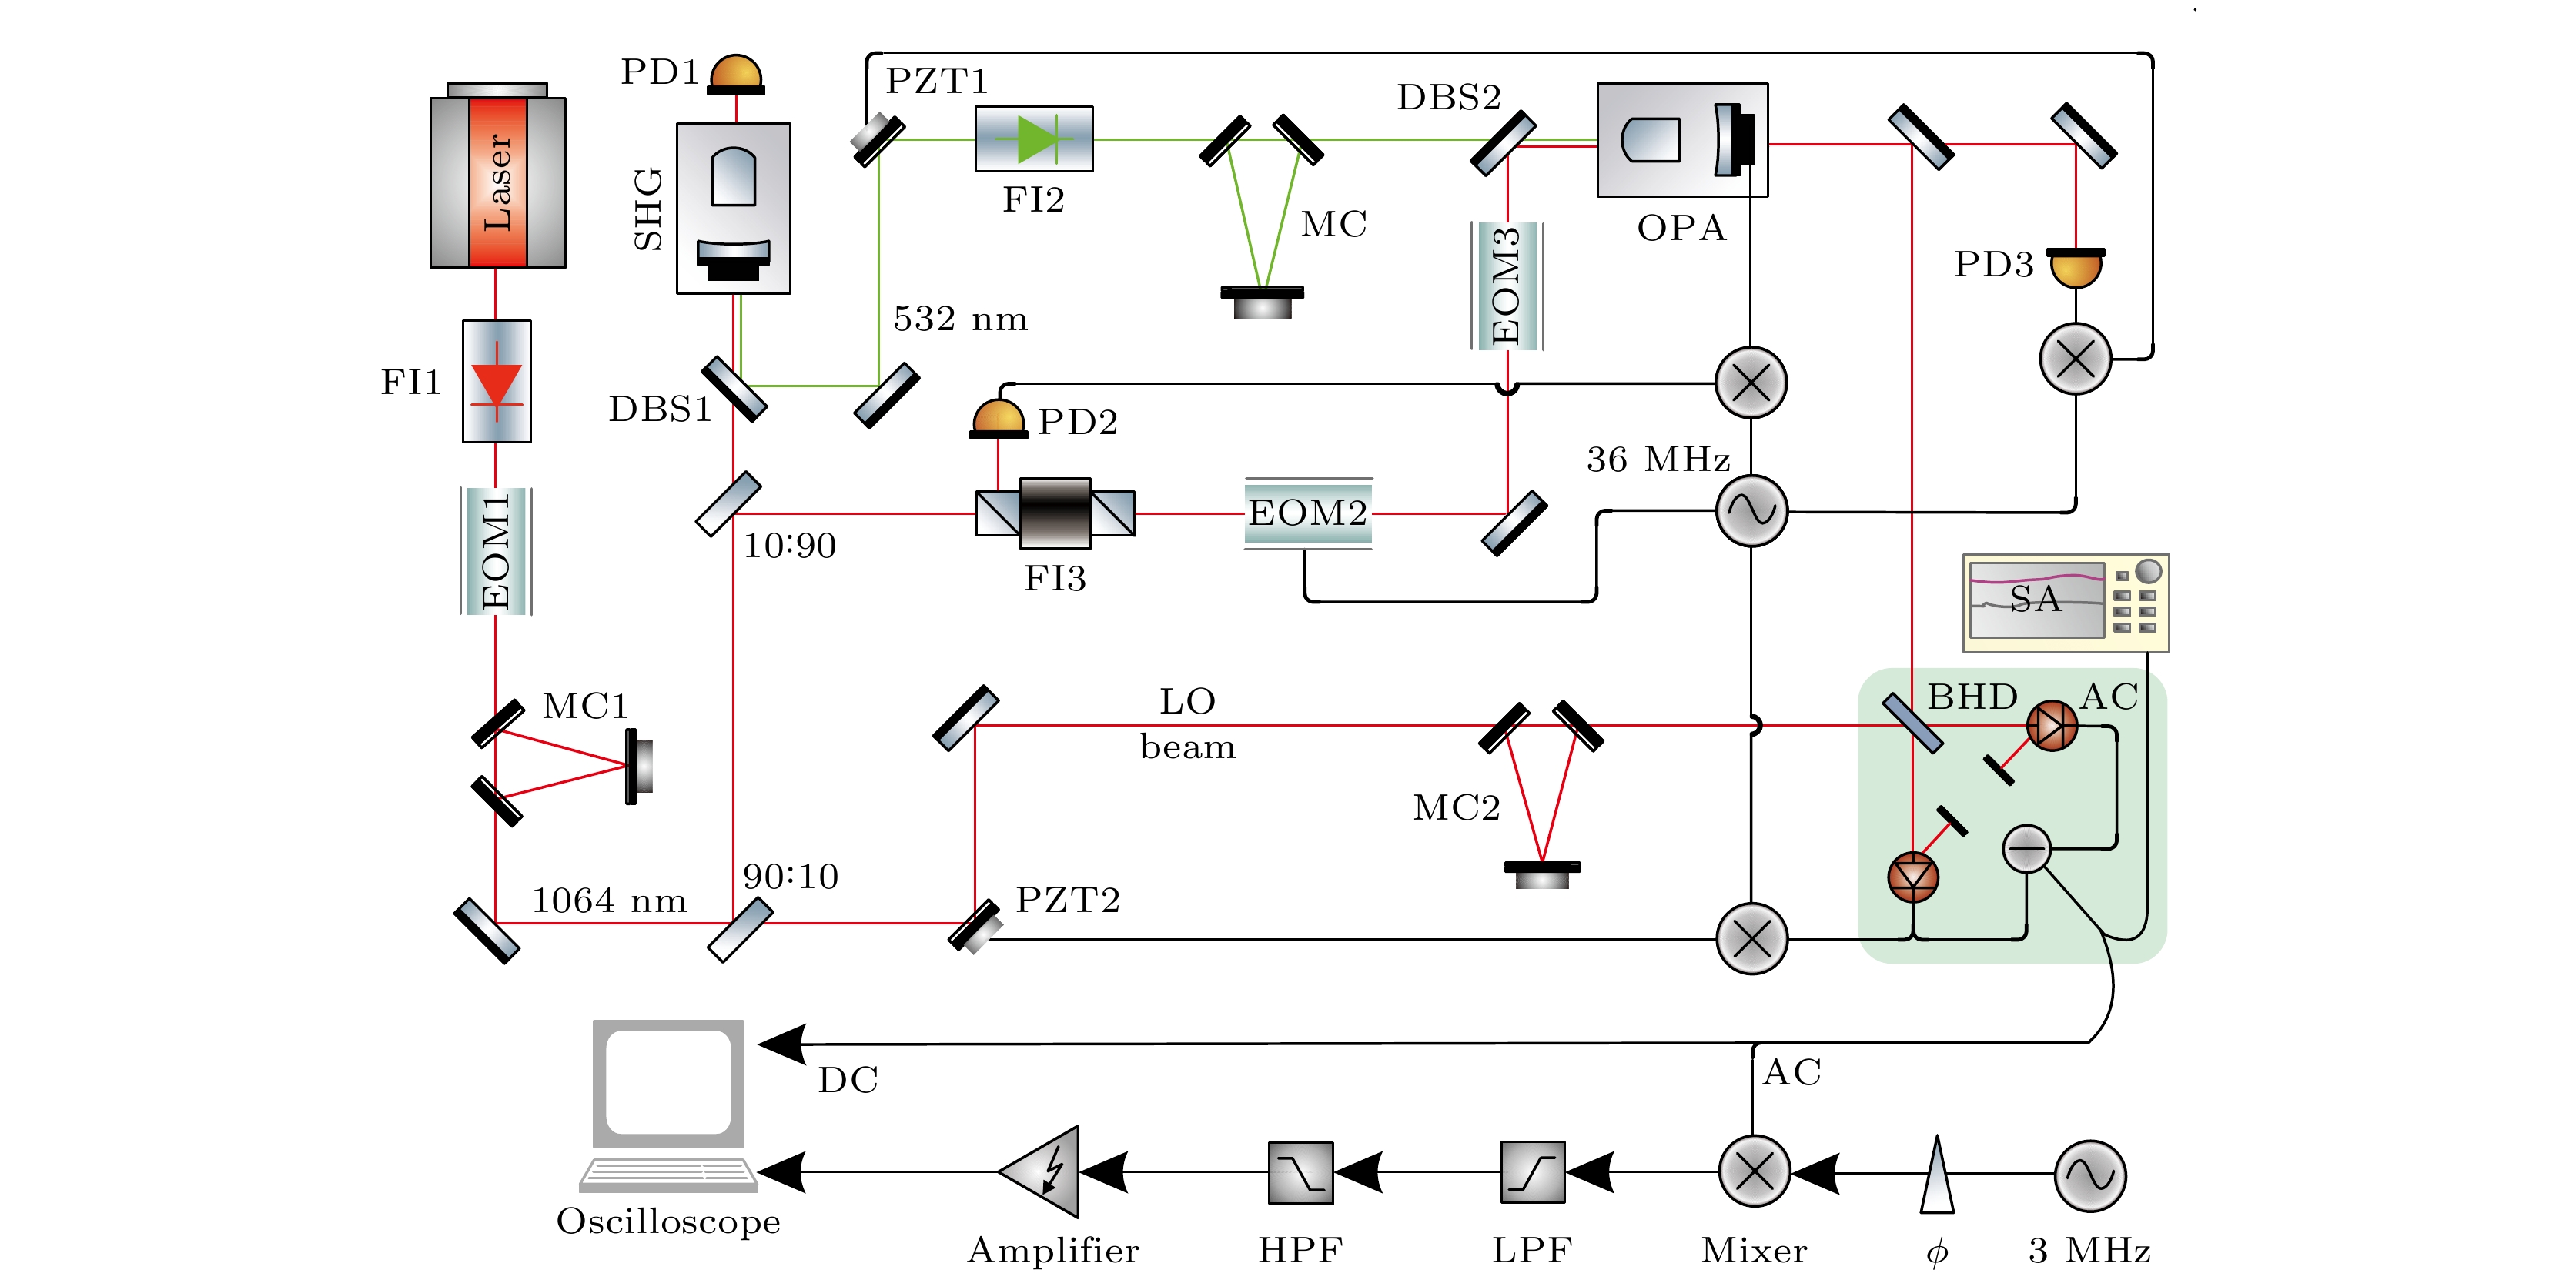 图 1 实验装置图(SHG, 倍频腔; OPA, 光学参量放大腔; EOM, 光电调制器; MC, 模式清洁器; DBS, 双色镜; FI, 隔离器; PZT, 压电驱动器; PD, 光电探测器; BHD, 平衡零拍探测器; SA, 频谱分析仪; LPF, 低通滤波器; HPF, 高通滤波器)
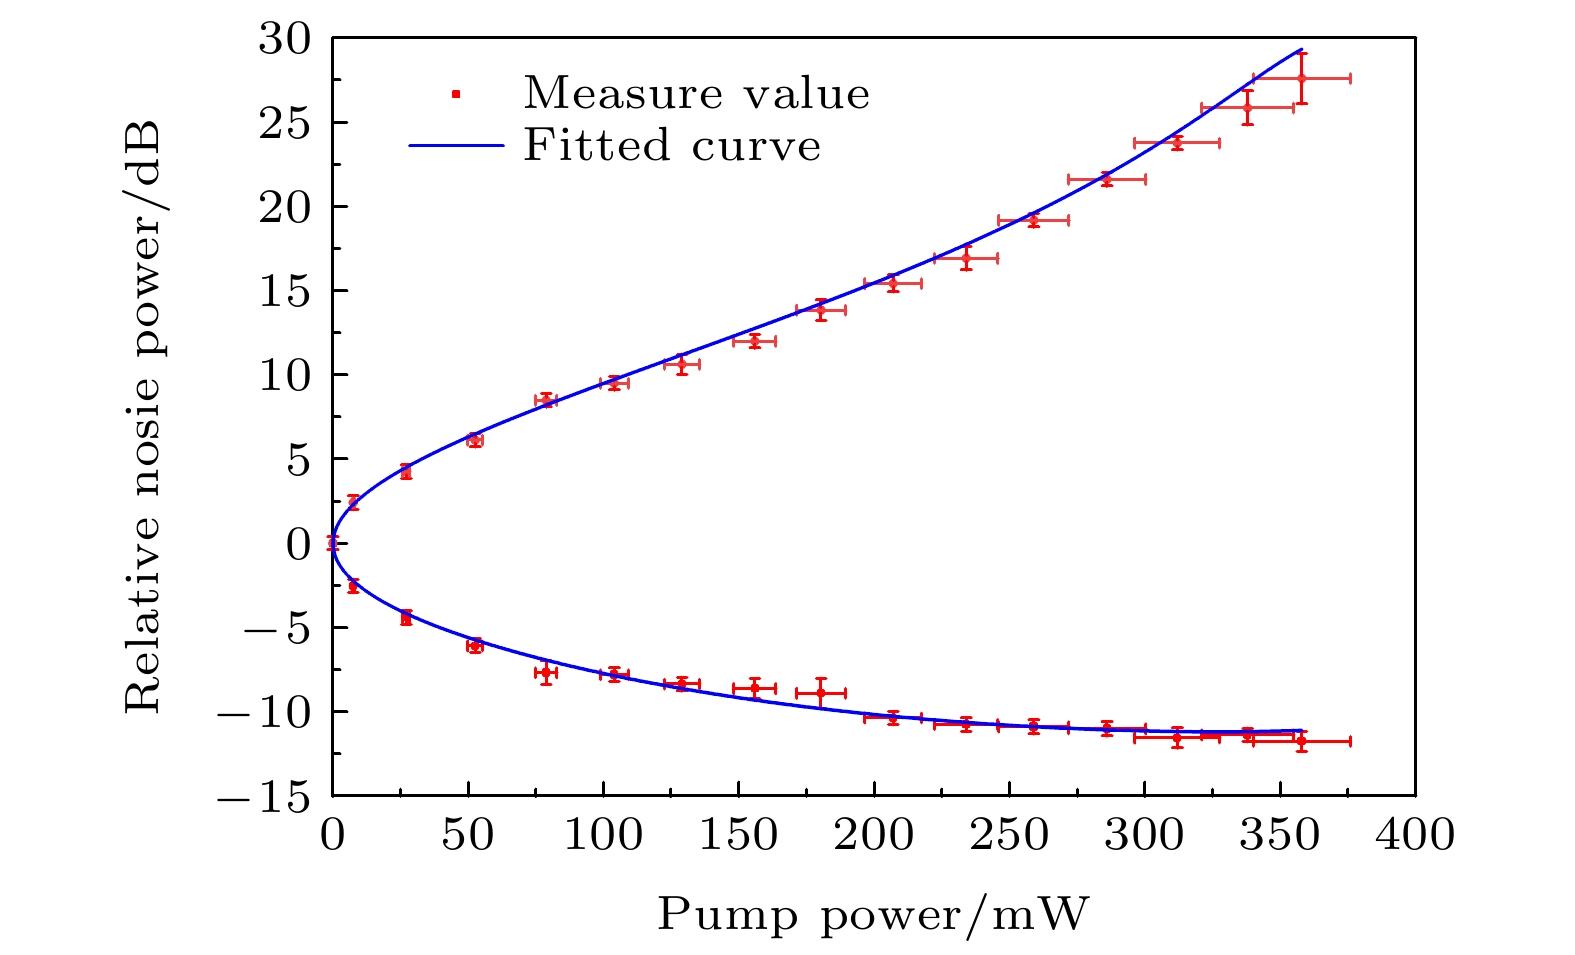 图 2 压缩和反压缩随泵浦功率的变化趋势图, 分析频率为3 MHz, 分辨率带宽(RBW)为300 kHz, 视频带宽(VBW) 200 Hz. 所有的数据点均包括探测器的电子学噪声的影响, 为直接测量结果
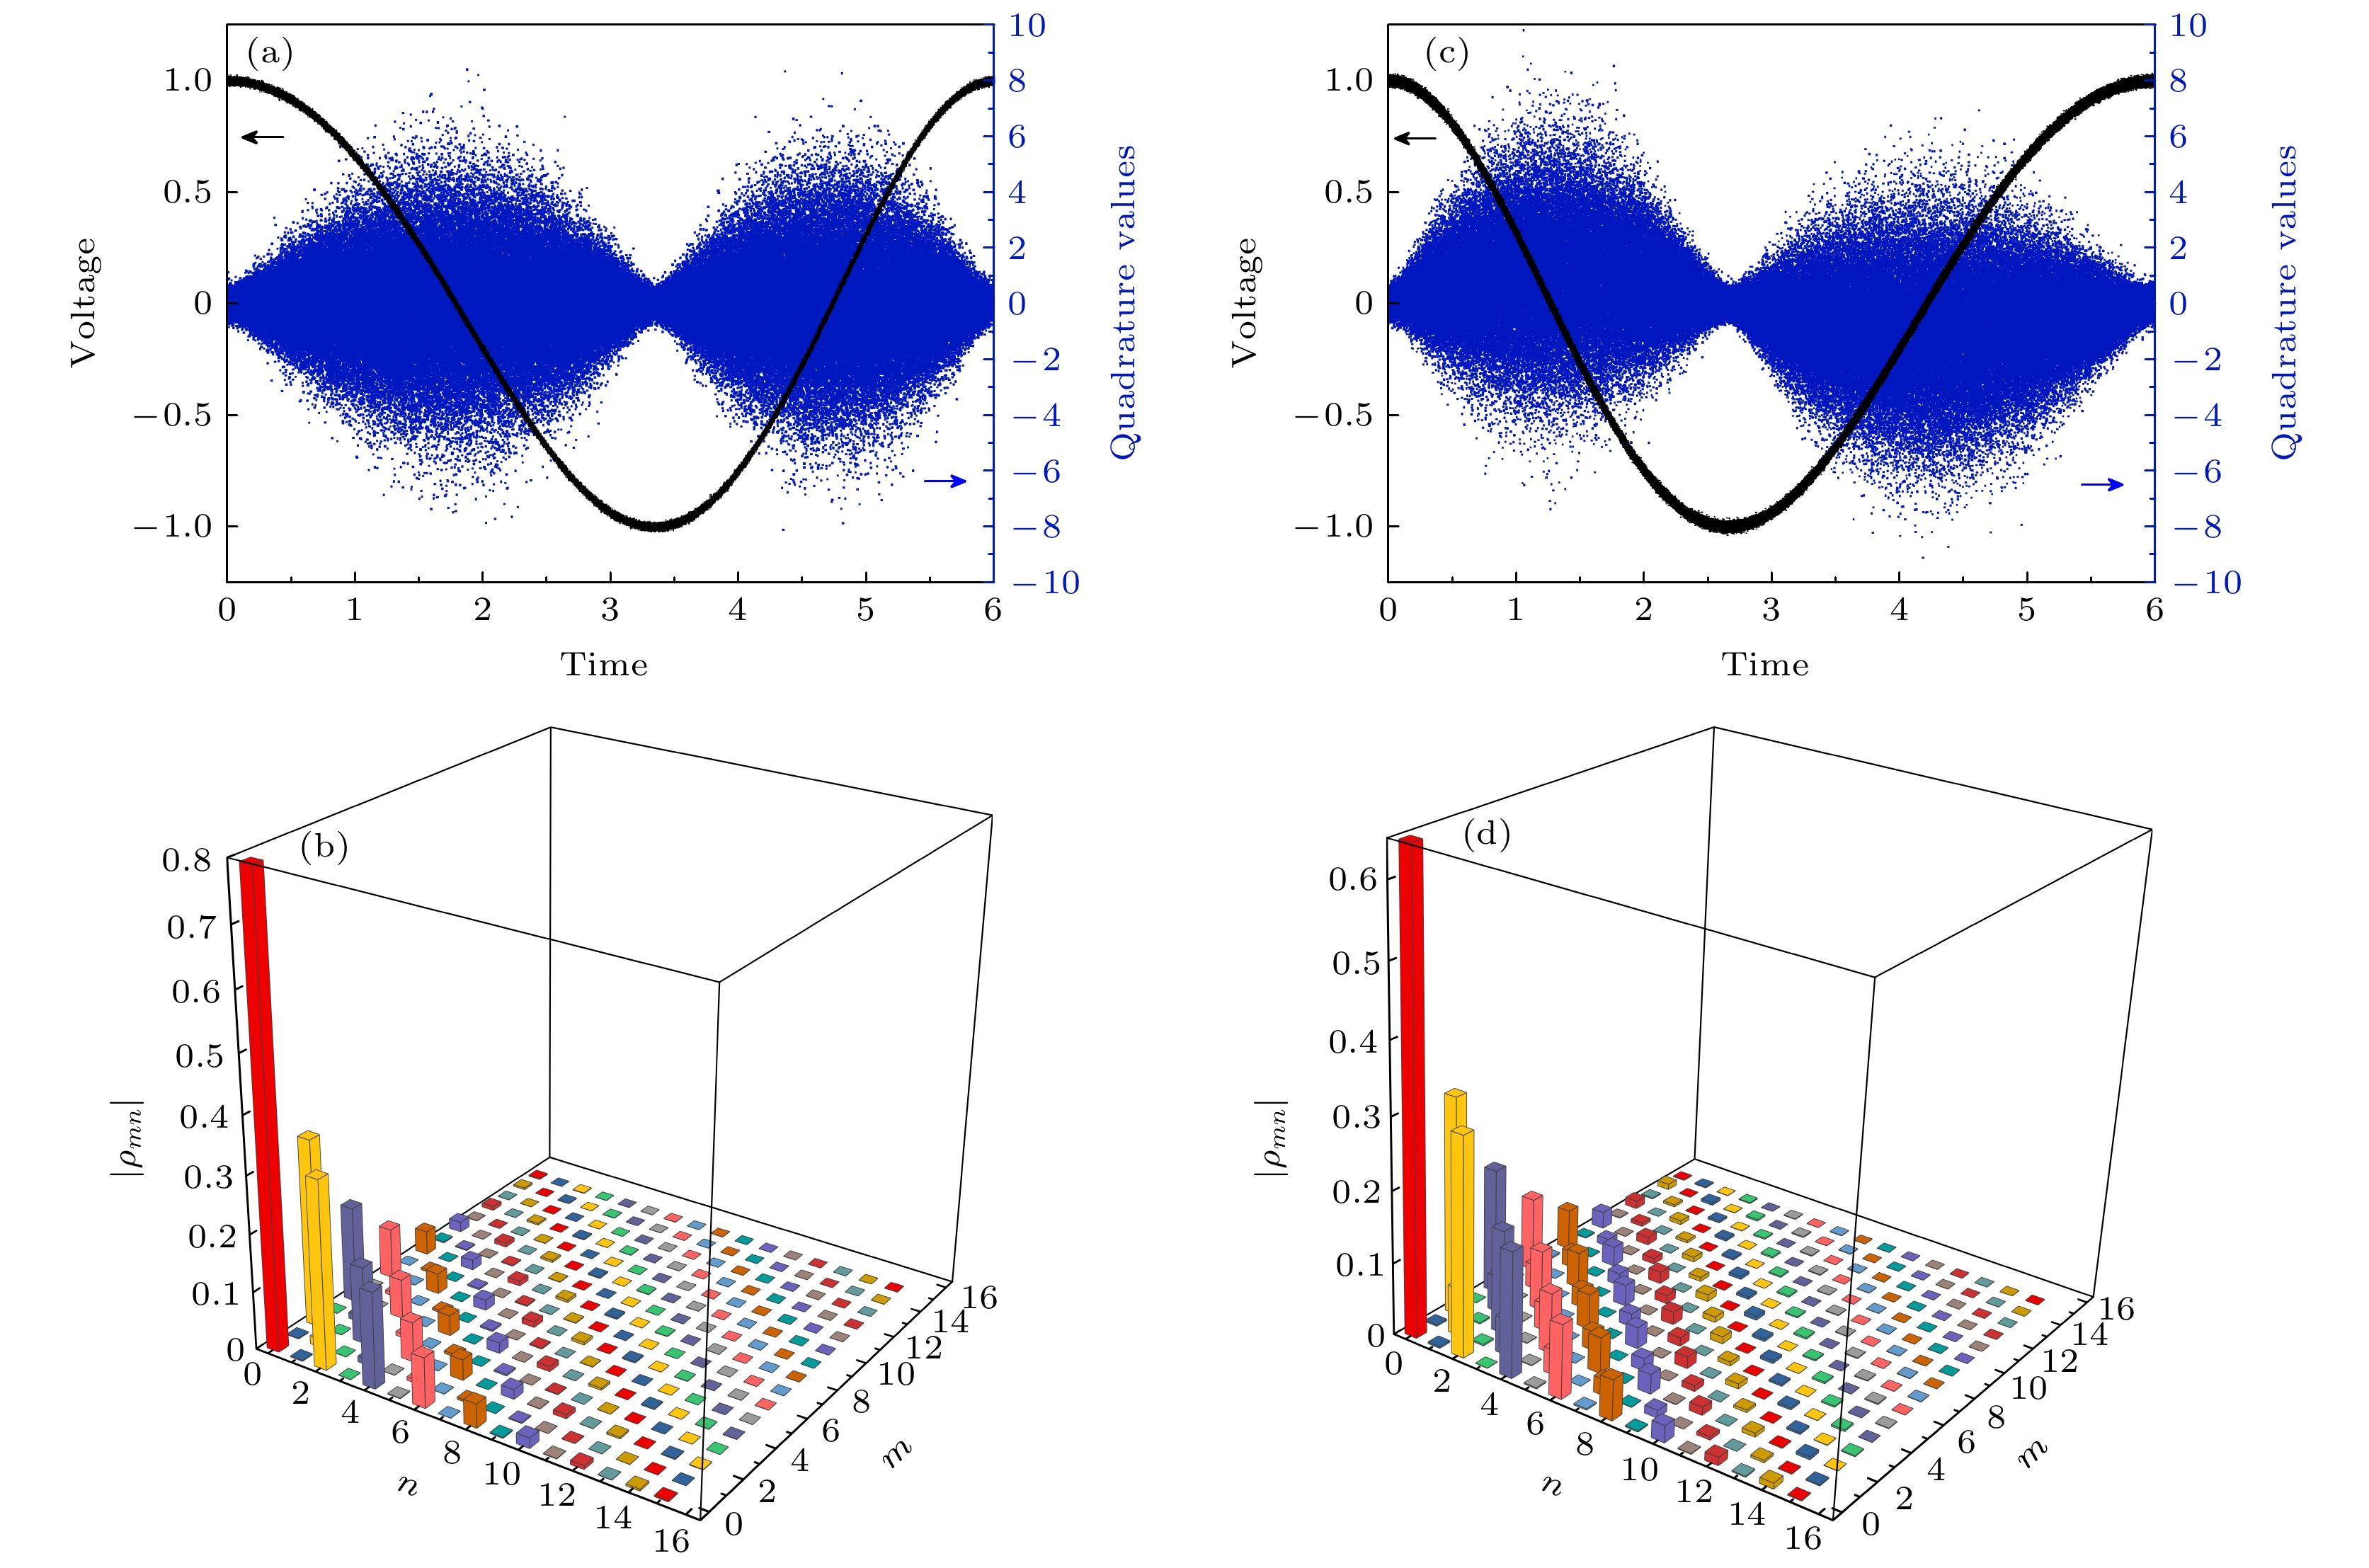 图 3 (a), (b)未进行线性操控的明亮压缩态噪声时域测量结果及量子层析后对应的密度矩阵; (c), (d)进行线性操控后的明亮压缩态噪声时域测量结果及量子层析后对应的密度矩阵
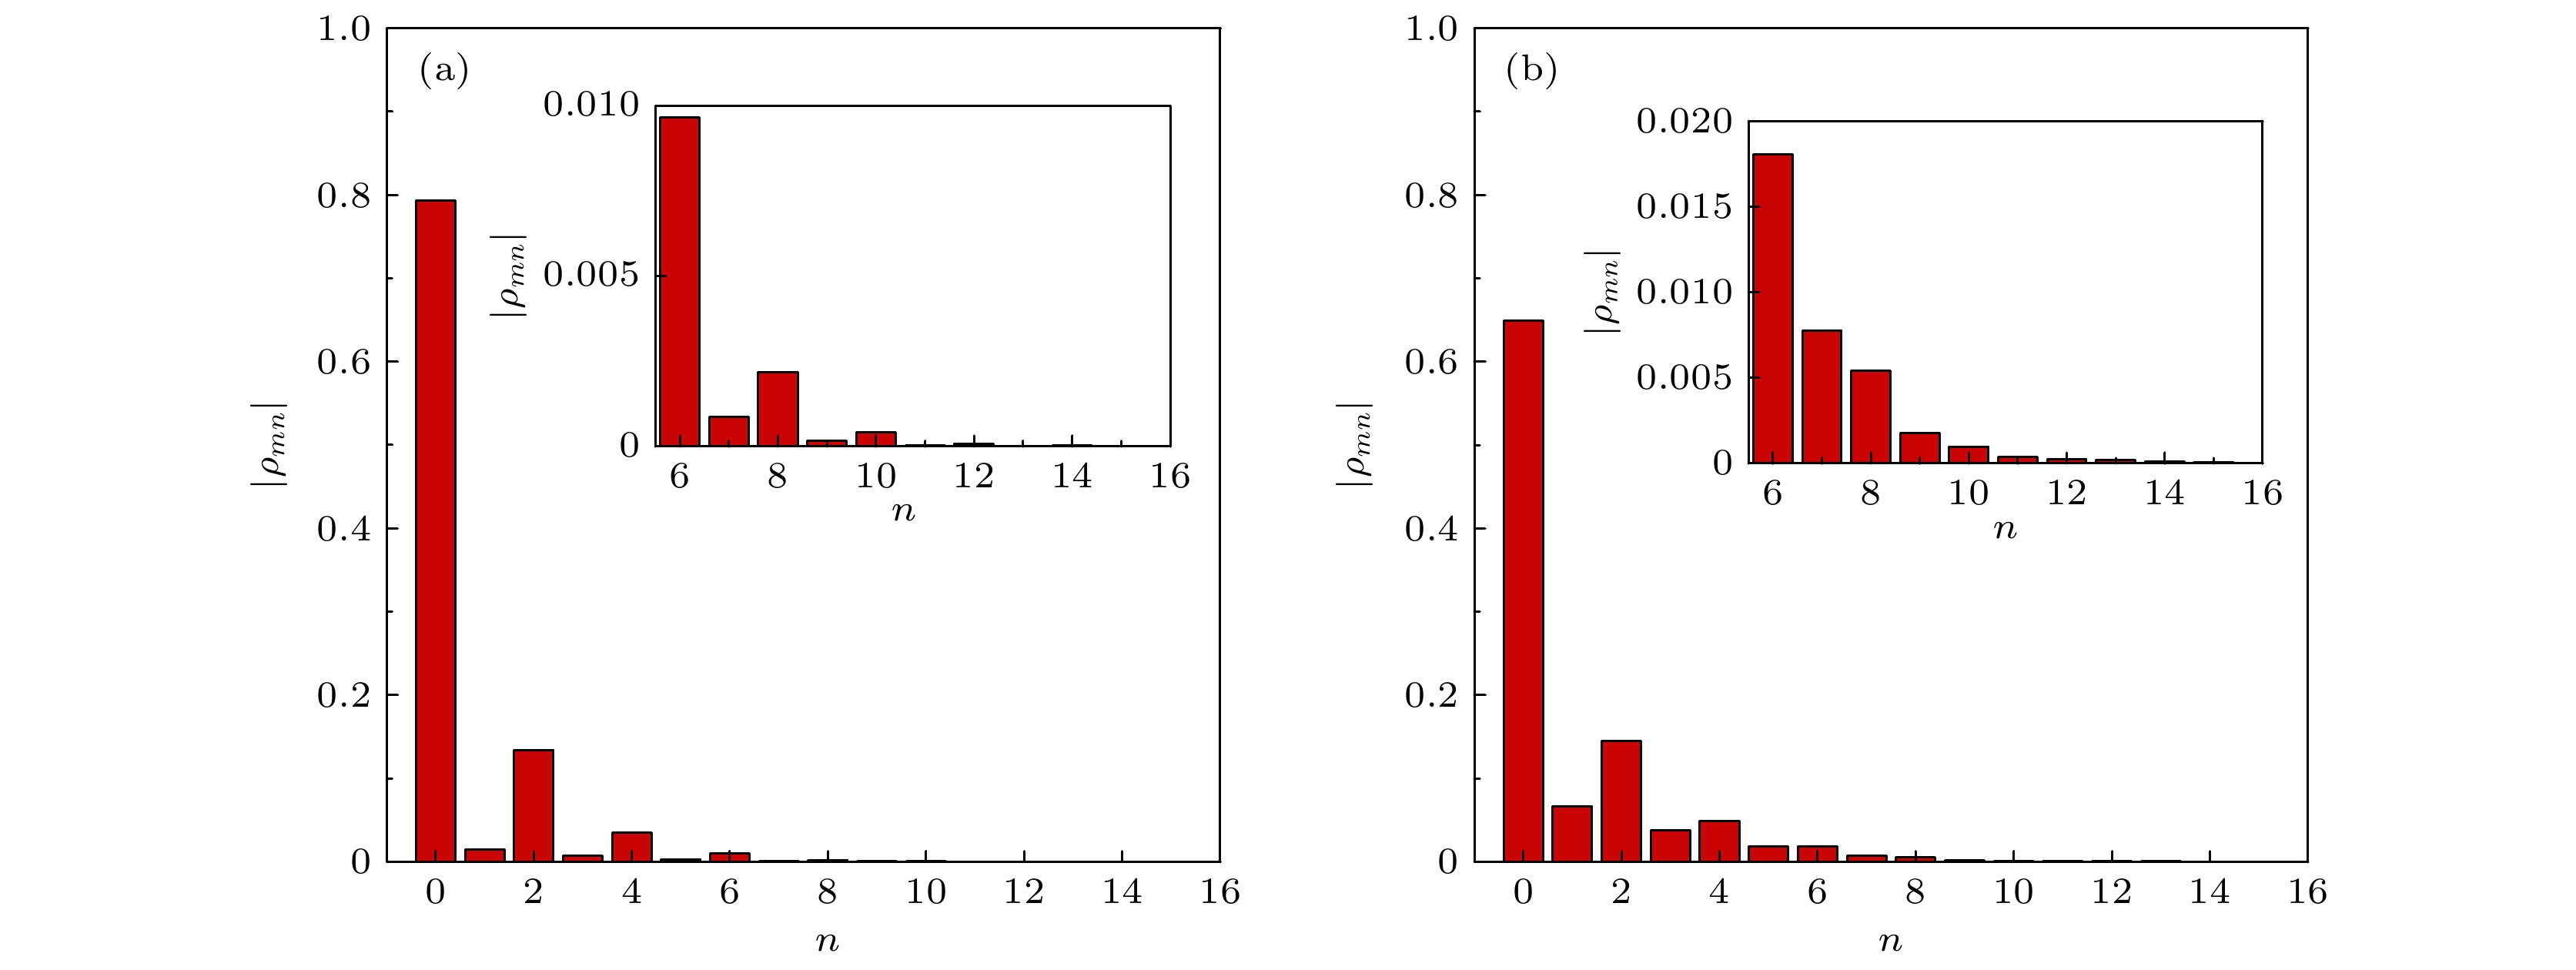 图 4 明亮压缩态光场在3 MHz分析边带的光子数分布概率 (a)线性操控光学前; (b)线性操控光学后


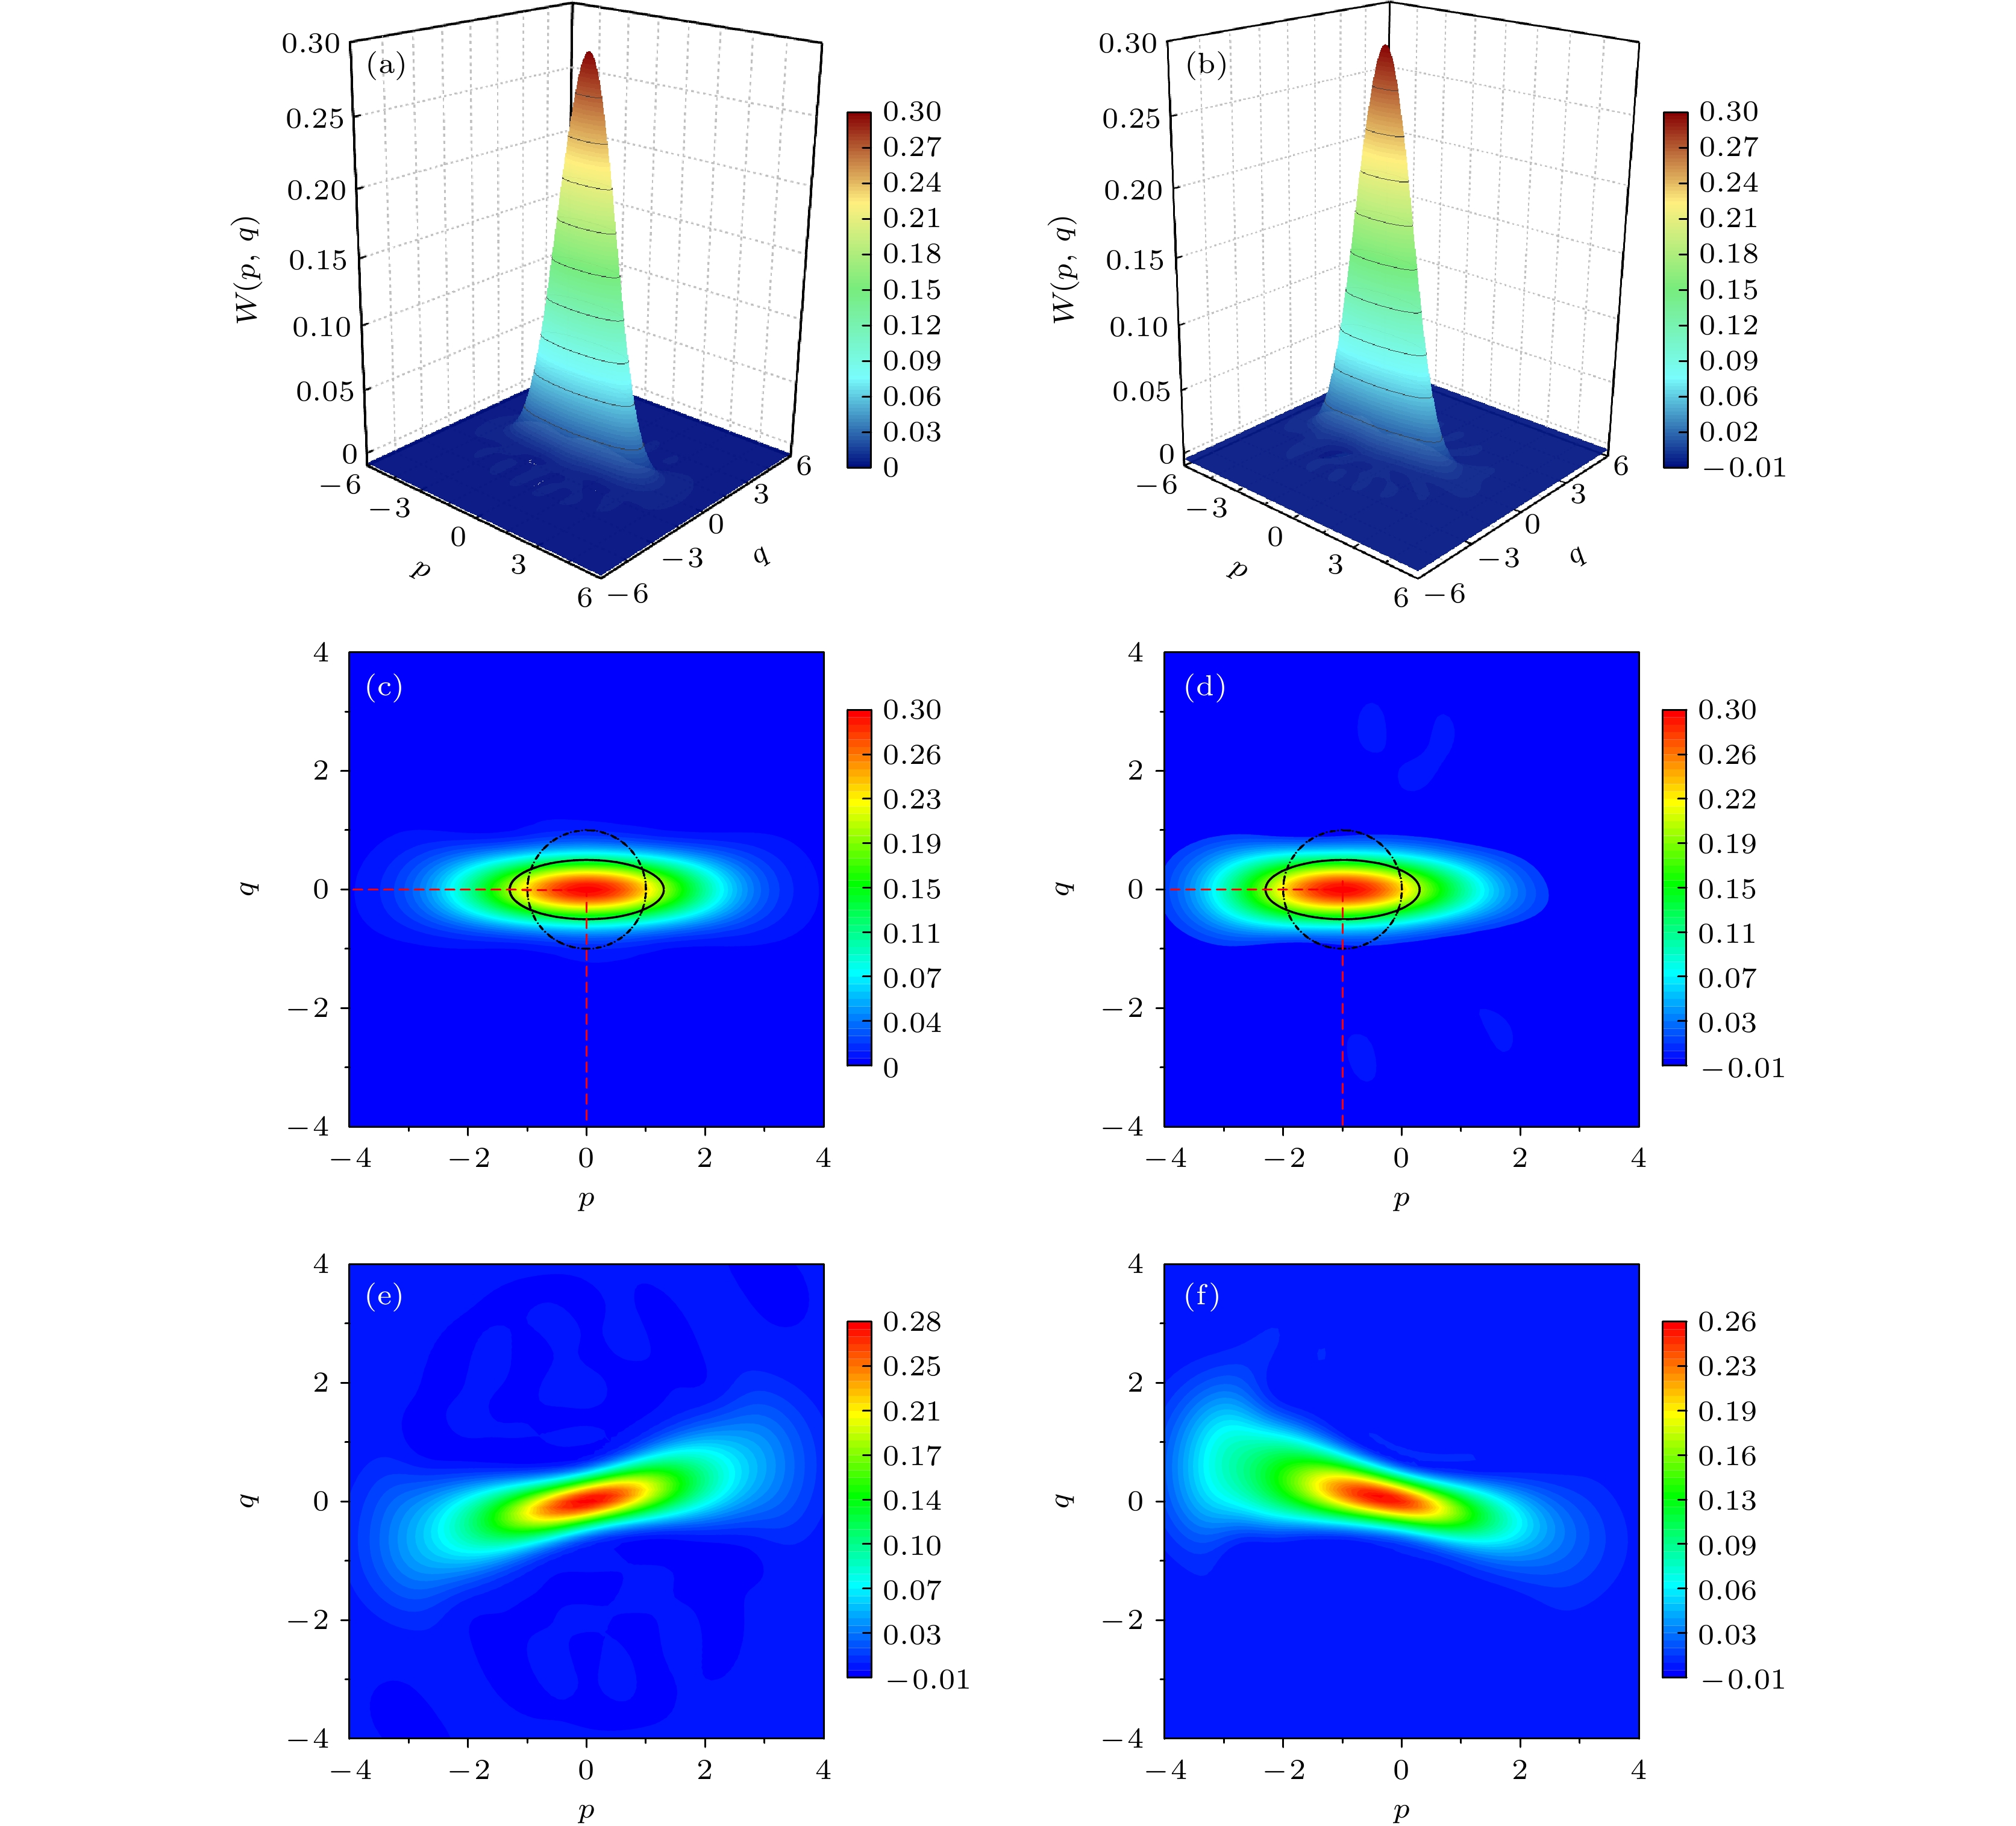 图 5 (a), (c)从极大似然估计重构得到的无调制时的明亮压缩态Wigner函数和等高线图; (b), (d)从极大似然估计重构得到的光电相位调制器操控后的明亮压缩态Wigner 函数和等高线图; (e), (f)利用均匀相位分配法重构得到的无操控时以及操控后的明亮压缩态Wigner函数的等高线图