全文HTML
--> --> -->氮空位 (nitrogen-vacancy, NV)色心是金刚石中较为常见的一种自旋结构, 由一个氮原子 (N)和空位(V) 取代碳(C)原子, 根据其荧光电荷态分为NV0和NV–, 本文围绕系综NV–色心研究展开, 为了表述方便, 本文后续均由NV指代NV–. 由于NV色心电子自旋对磁场的敏感性, 目前NV色心主要用于纳米级的磁场检测[8,9], 较大体积的系综金刚石NV色心具有较高的色心浓度, 可以实现高灵敏度磁传感检测[10], 目前系综金刚石NV色心已经实现微米量级[11,12]磁场成像的技术研究, 但是在实际应用过程中, 系综NV色心磁检测磁灵敏度受微波功率和激光功率等多种因素限制[13], 现有研究条件下继续增大微波功率和激光功率已经受到诸多因素的限制. 如何引入新机制进一步提升系综NV色心传感器检测灵敏度且不引入额外噪声, 这是目前亟需解决的关键问题.
磁力线集聚结构(magnetic flux concentrator, MFC)是一种利用具有磁力线汇聚作用的高磁导率软磁材料制备的对称结构[14]. 该结构中央间隙部分可以实现待测磁力线的汇聚, 产生局部磁场增强, 进而将微弱待测磁场转变成较强的汇聚磁场进行检测, 最终实现传感器检测灵敏度的有效提升. 同时, 利用磁通集聚结构增大磁力计灵敏度的方式不会将更多的测量噪声引入到传感器系统中[15]. 目前MFC已经被用于霍尔传感器[16]、磁通门感器[17]和磁隧道结传感器[18,19]等多种传统磁传感检测技术中. 但是, MFC对于NV色心磁检测的灵敏度提升的有效性及系统研究目前报道相对较少, 同时, 结合室温弱磁、极弱磁检测发展需求, 有必要对MFC系统对系综NV色心磁检测增强的有效性展开系统研究.
基于以上研究背景, 本文通过搭建结合MFC系统的系综金刚石NV色心宽场磁检测成像系统, 利用连续波光探测磁共振(continuous wave optical detection magnetic resonance, CW-ODMR)宽场成像技术, 验证MFC对磁场增强效应的有效性. 通过对比有无MFC条件下的ODMR曲线变化, 确定MFC对待测磁场的磁增强效果, 进一步通过测量不同间距下MFC磁增强倍数首先获得实验条件下的最优磁灵敏度, 最后通过对比实验测试和仿真结果, 预计现有MFC对实验系统的最优的磁增强效果和可实现的最优磁灵敏度.
2.1.实验原理
如图1(a)的能级图所示, 金刚石NV色心在受到532 nm绿色激光照射时, 其能级由基态3A2激发到第一激发态3E, 同时也在发生退激发回到基态, 退激发时有两种途径, 其中无辐射的系统间交叉(inter-system crossing, ISC)过程经过中间态1A1和1E的过程占比与微波频率有关, 在电子自旋与微波频率共振时荧光强度最弱; 在外磁场条件为零时, ODMR曲线仅在微波共振频率ν0 = 2.87 GHz附近呈现一个分裂的谐振峰. 以NV晶轴为坐标系的z方向, 并适当地选取x和y方向, 则N-V色心基态电子自旋的哈密顿量可以表示为[20]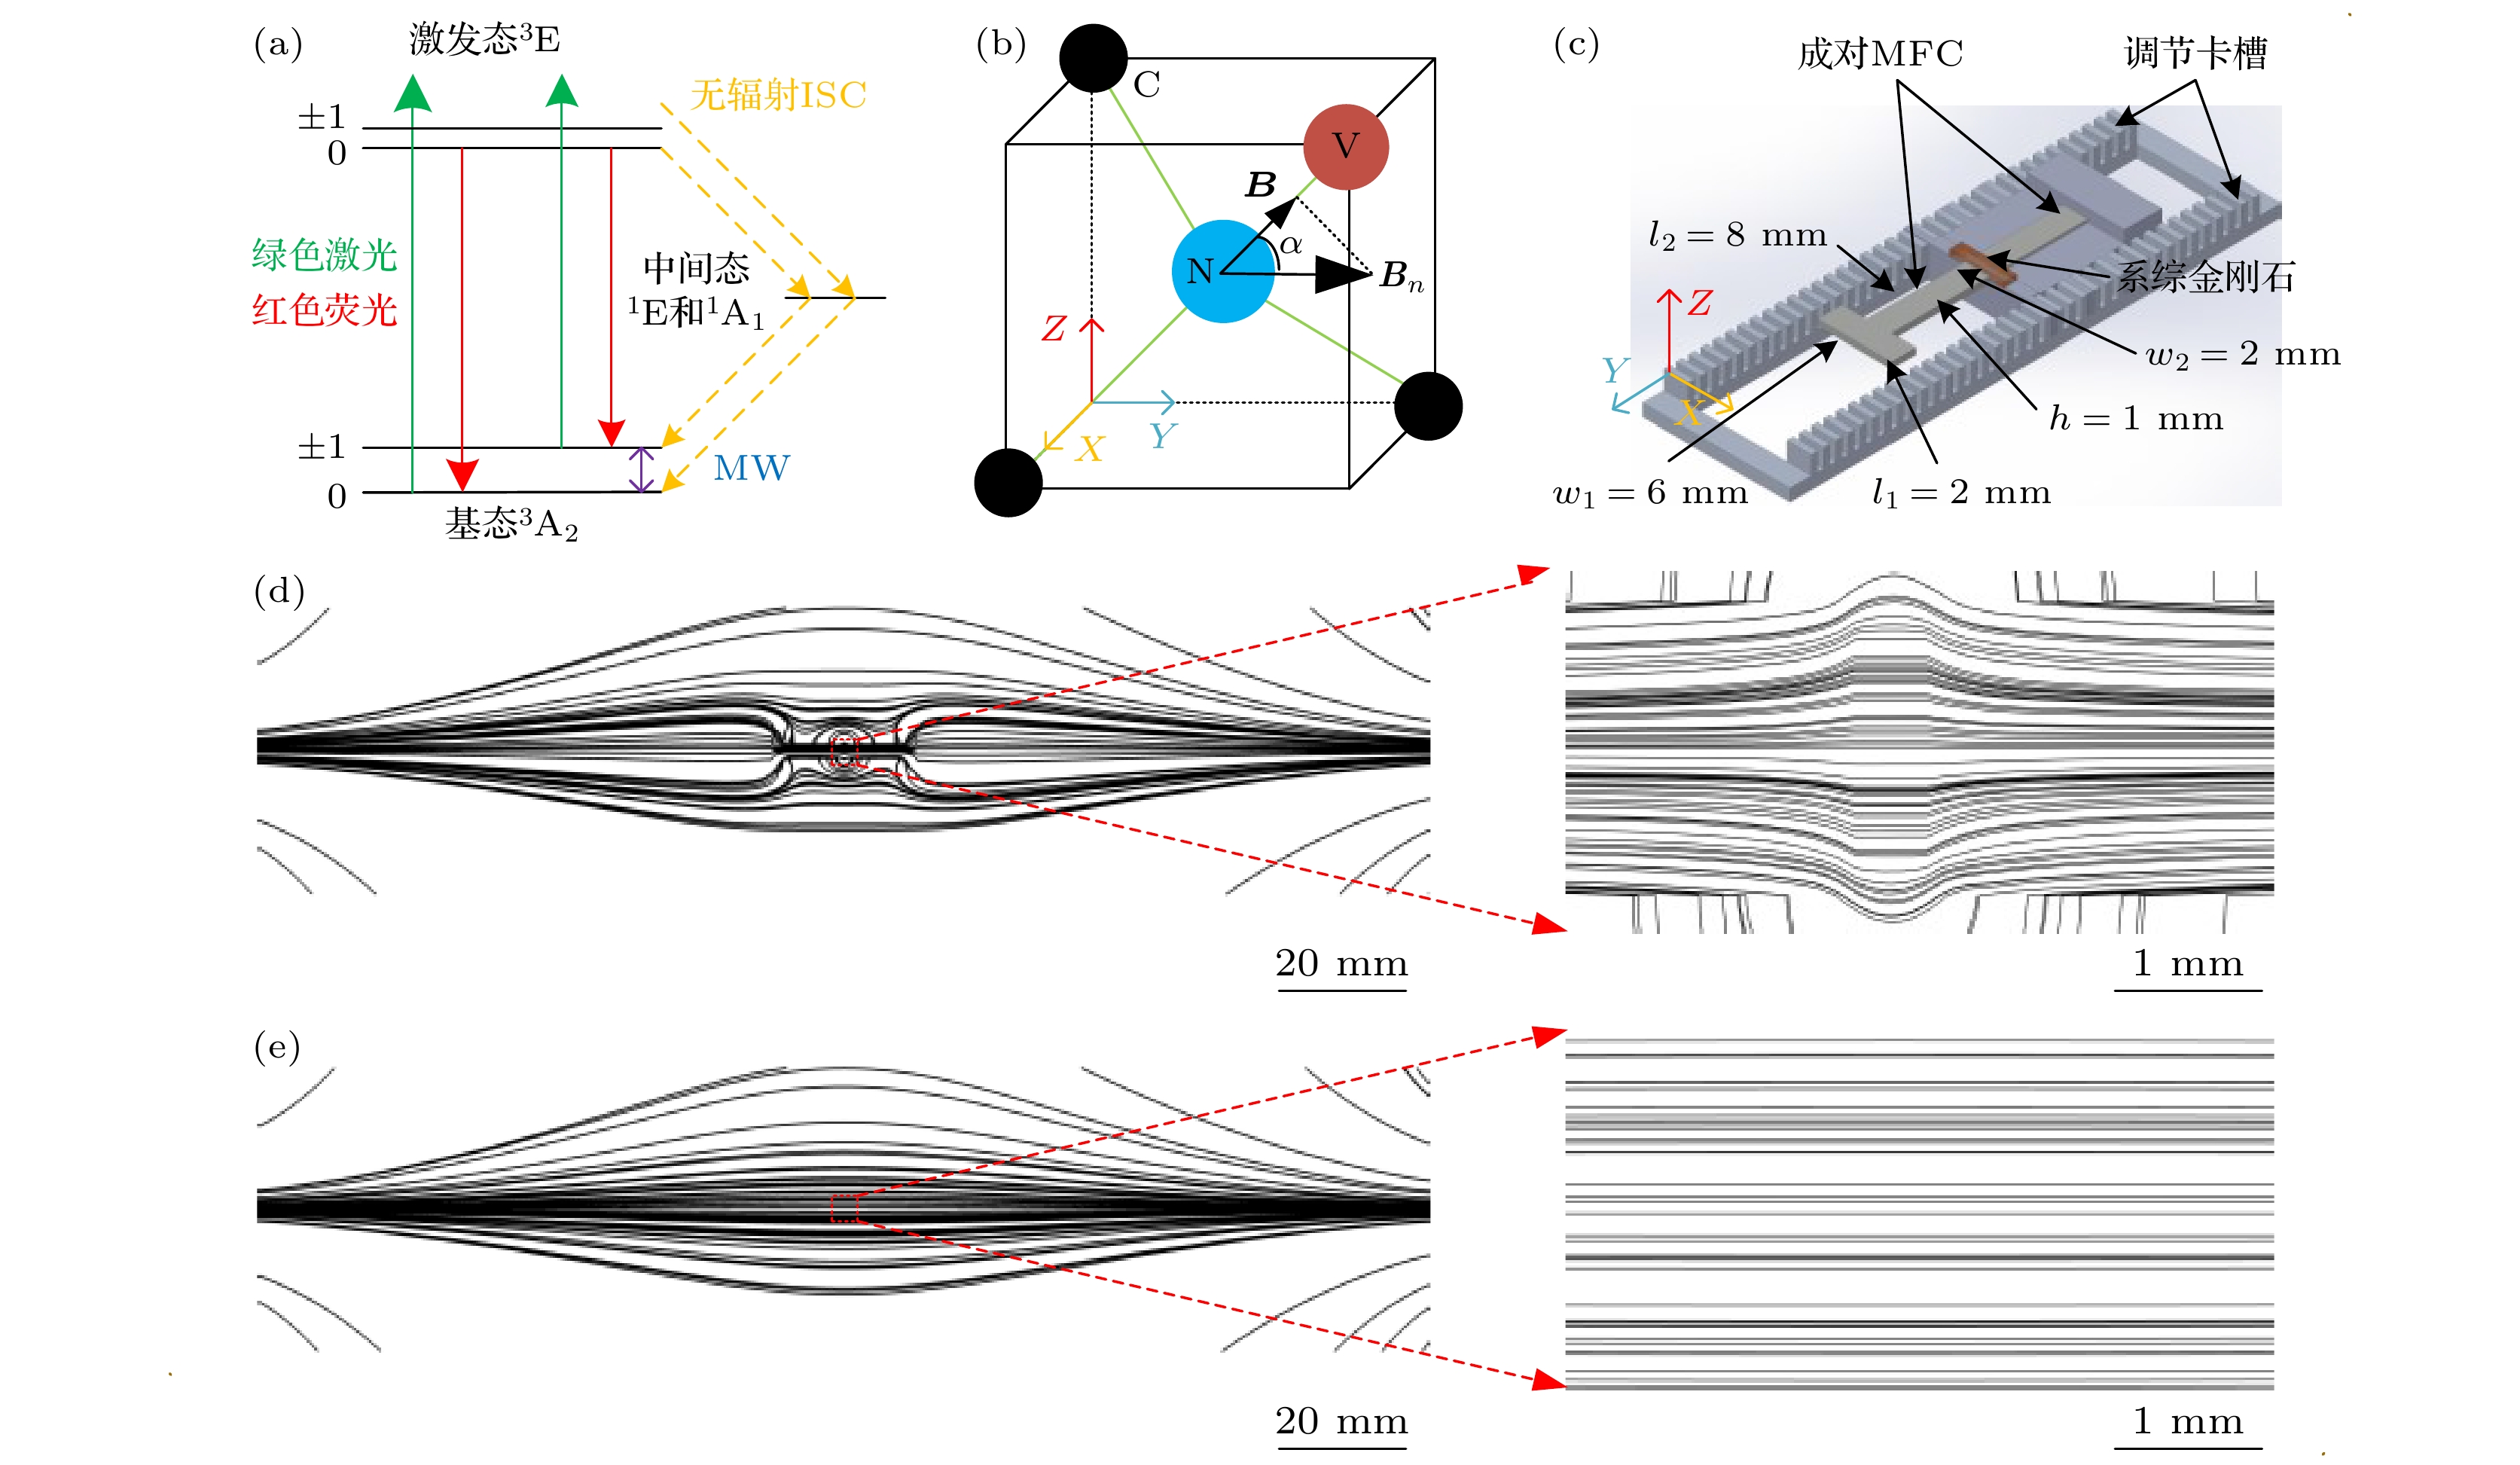 图 1 (a)金刚石NV色心能级跃迁示意图; (b)沿(100)面生长的金刚石晶胞中一种NV轴朝向与磁场方向夹角示意图; (c) T型薄片状MFC及调节装置示意图; (d) MFC间距为0.5 mm的两永磁体间磁场仿真流线图; (e)无MFC的两永磁体间磁场仿真流线图
Figure1. (a) Related energy levels of NV color center in diamond; (b) schematic diagram of the angle between the direction of the magnetic field and the direction of the NV axis in the diamond cell grown along the (100) plane; (c) schematic diagram of the T-shaped flake MFC and adjusting system; (d) simulation of magnetic field streamline diagram with MFC gap width of 0.5 mm between two permanent magnets; (e) simulation of magnetic field streamline diagram without MFC between two permanent magnets

MFC由高磁导率软磁材料制成, 可用于磁场的增强. 空气中的磁力线在进入MFC较大的一端后在其内部顺着MFC的形状在较小的一端产生汇聚, 形成磁力线的集聚[22], 有无MFC时永磁体产生磁力线的仿真流线对比如图1(d)和图1(e)所示. MFC通常做成小端相对的对称结构, 在有外界磁场时其中心处的空气间隙会产生比无MFC状态增大的磁场[23]. 根据已有研究结果可知, T型MFC的磁集聚增强效果最明显[23,24], 因而选择成对T型薄片状MFC进行研究. 本文所采用的T型MFC, 其制作材料为1j79坡莫合金, 结合使用的实验装置, 实验中所采用的T型薄片状MFC具体形状尺寸如图1(c)所示.
2
2.2.实验装置与仿真建模
图2(a)所示为实验装置系统, 由光路系统、宽场显微镜系统、微波系统、磁场系统、同步控制系统和数据处理系统组成. 高浓度的NV色心系综样品为1.0 mm × 4.0 mm × 0.5 mm的长条形金刚石(色心浓度约3 ppm, Element six, (100)为金刚石生长晶面), 而根据晶胞建立的坐标系由于沿着金刚石生长面与切削面, 因而在宏观上表现为图1(c)所示的以金刚石中心点为原点, Y轴方向为施加待测磁场与MFC的方向.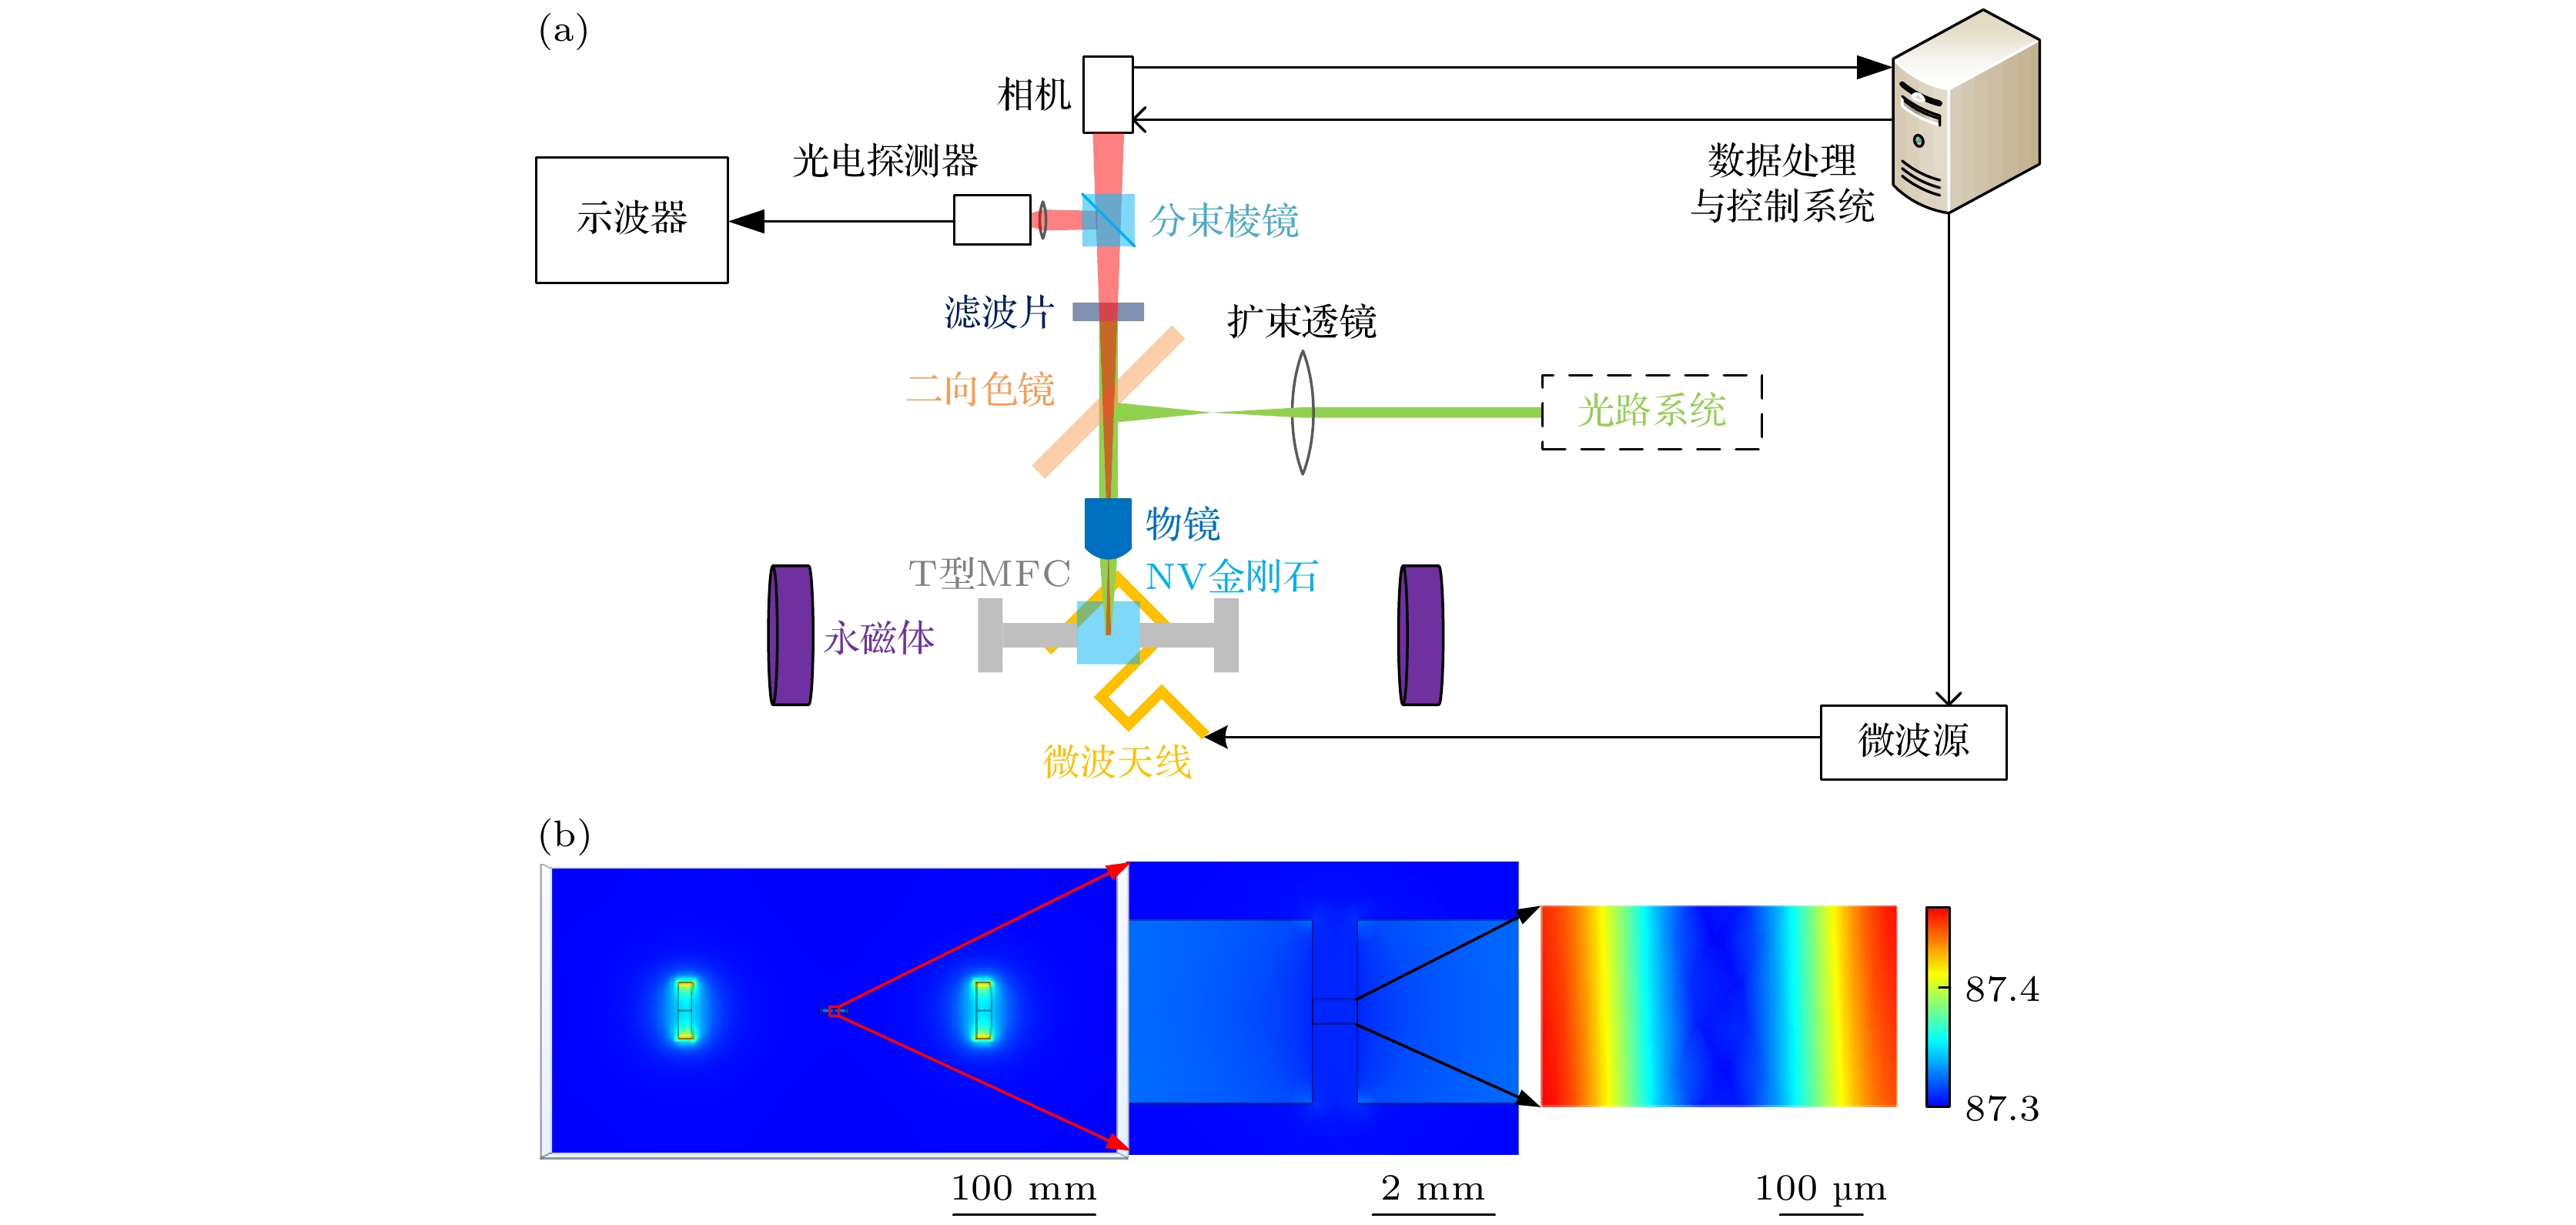 图 2 (a) 实验装置示意图; (b) 用于仿真的几何结构俯视图, 红框为MFC间距0.5 mm时间隙部分放大示意图, 黑框为视场内的仿真磁场分布图
Figure2. (a) Schematic diagram of experimental setup; (b) top view of the geometric structure used in simulation, the red frame is the enlarged schematic diagram of the gap part when the MFC gap width is 0.5 mm, and the black frame is the simulated magnetic field distribution in the field of view.
光路系统将激光器(MGL-III-532-100 mW, 长春新产业光电技术) 产生的532 nm绿色激光经过准直与扩大后射入宽场显微镜系统; 宽场显微镜系统将通过扩束透镜扩大后的激光通过二向色镜经由20 ×/0.4的物镜汇聚到金刚石下表面NV色心富集层上. 相机成像区域为该样品中心位置处约0.48 mm × 0.27 mm区域, 通过调节金刚石位置可将视场边界较宽的一侧与坐标轴Y轴方向平行, 较窄一侧与X轴平行. 金刚石上方物镜将532 nm激光作用于NV色心表面, 其有效光斑直径为0.6 mm, 可完全覆盖成像区域. NV色心发出的红色荧光由物镜收集后经分束镜, 一束进入到相机(CS2100M-USB, Thorlabs)进行成像, 另一束收集至光电探测器上用于相关参数对比校正.
扫频微波由微波源(SMA 100A, ROHDE &SCHWARZ, 输出功率为30 dBm)通过微波天线向成像测量区域提供, 频率范围为2.7—3.0 GHz, 步进为0.15 MHz.
待测磁场由成对圆柱状(Φ40 × 10 mm)永磁体结合精密调节架提供, 构成类亥姆霍兹的磁调节系统, 两永磁体轴线正中心为测量位置, 磁体间距约为200 mm时, 利用高斯计测量中心位置处的磁场强度约为5 Gs, 此外还可通过加减永磁铁或改变磁铁间距改变中心位置处磁场强度.
同步控制系统通过控制板卡(PulseBlasterESR-PRO, SpinCore)将微波扫频步进与相机曝光和图像储存时间根据序列进行循环同步, 相机曝光时间设置为5 ms, 在图像储存开始的同时, 对微波源提供一个同步的步进触发信号, 单次循环储存时间为35 ms, 相机每秒采集帧数为25 FPS, 单次2000个循环的完整ODMR成像数据采集时间为80 s. 为了提升测量数据的准确性, 单组数据进行5次测量平均.
数据处理系统将相机保存的图片数据根据采集时间逐张提取并保存为一个1920 × 1080 × 2000的三维矩阵, 然后这个三维矩阵经过4 × 4个像素点平均为一个像素点后将每个图像像素点处的数值随时间变化的曲线单独保存, 对应的系统分辨率约为1 μm/pixel, 获得的曲线为对应像素位置成像需要的ODMR曲线, 如图3(c)中的蓝色实线所示, 通过MATLAB算法, 利用双峰Lorentz公式进行最小二乘法拟合:
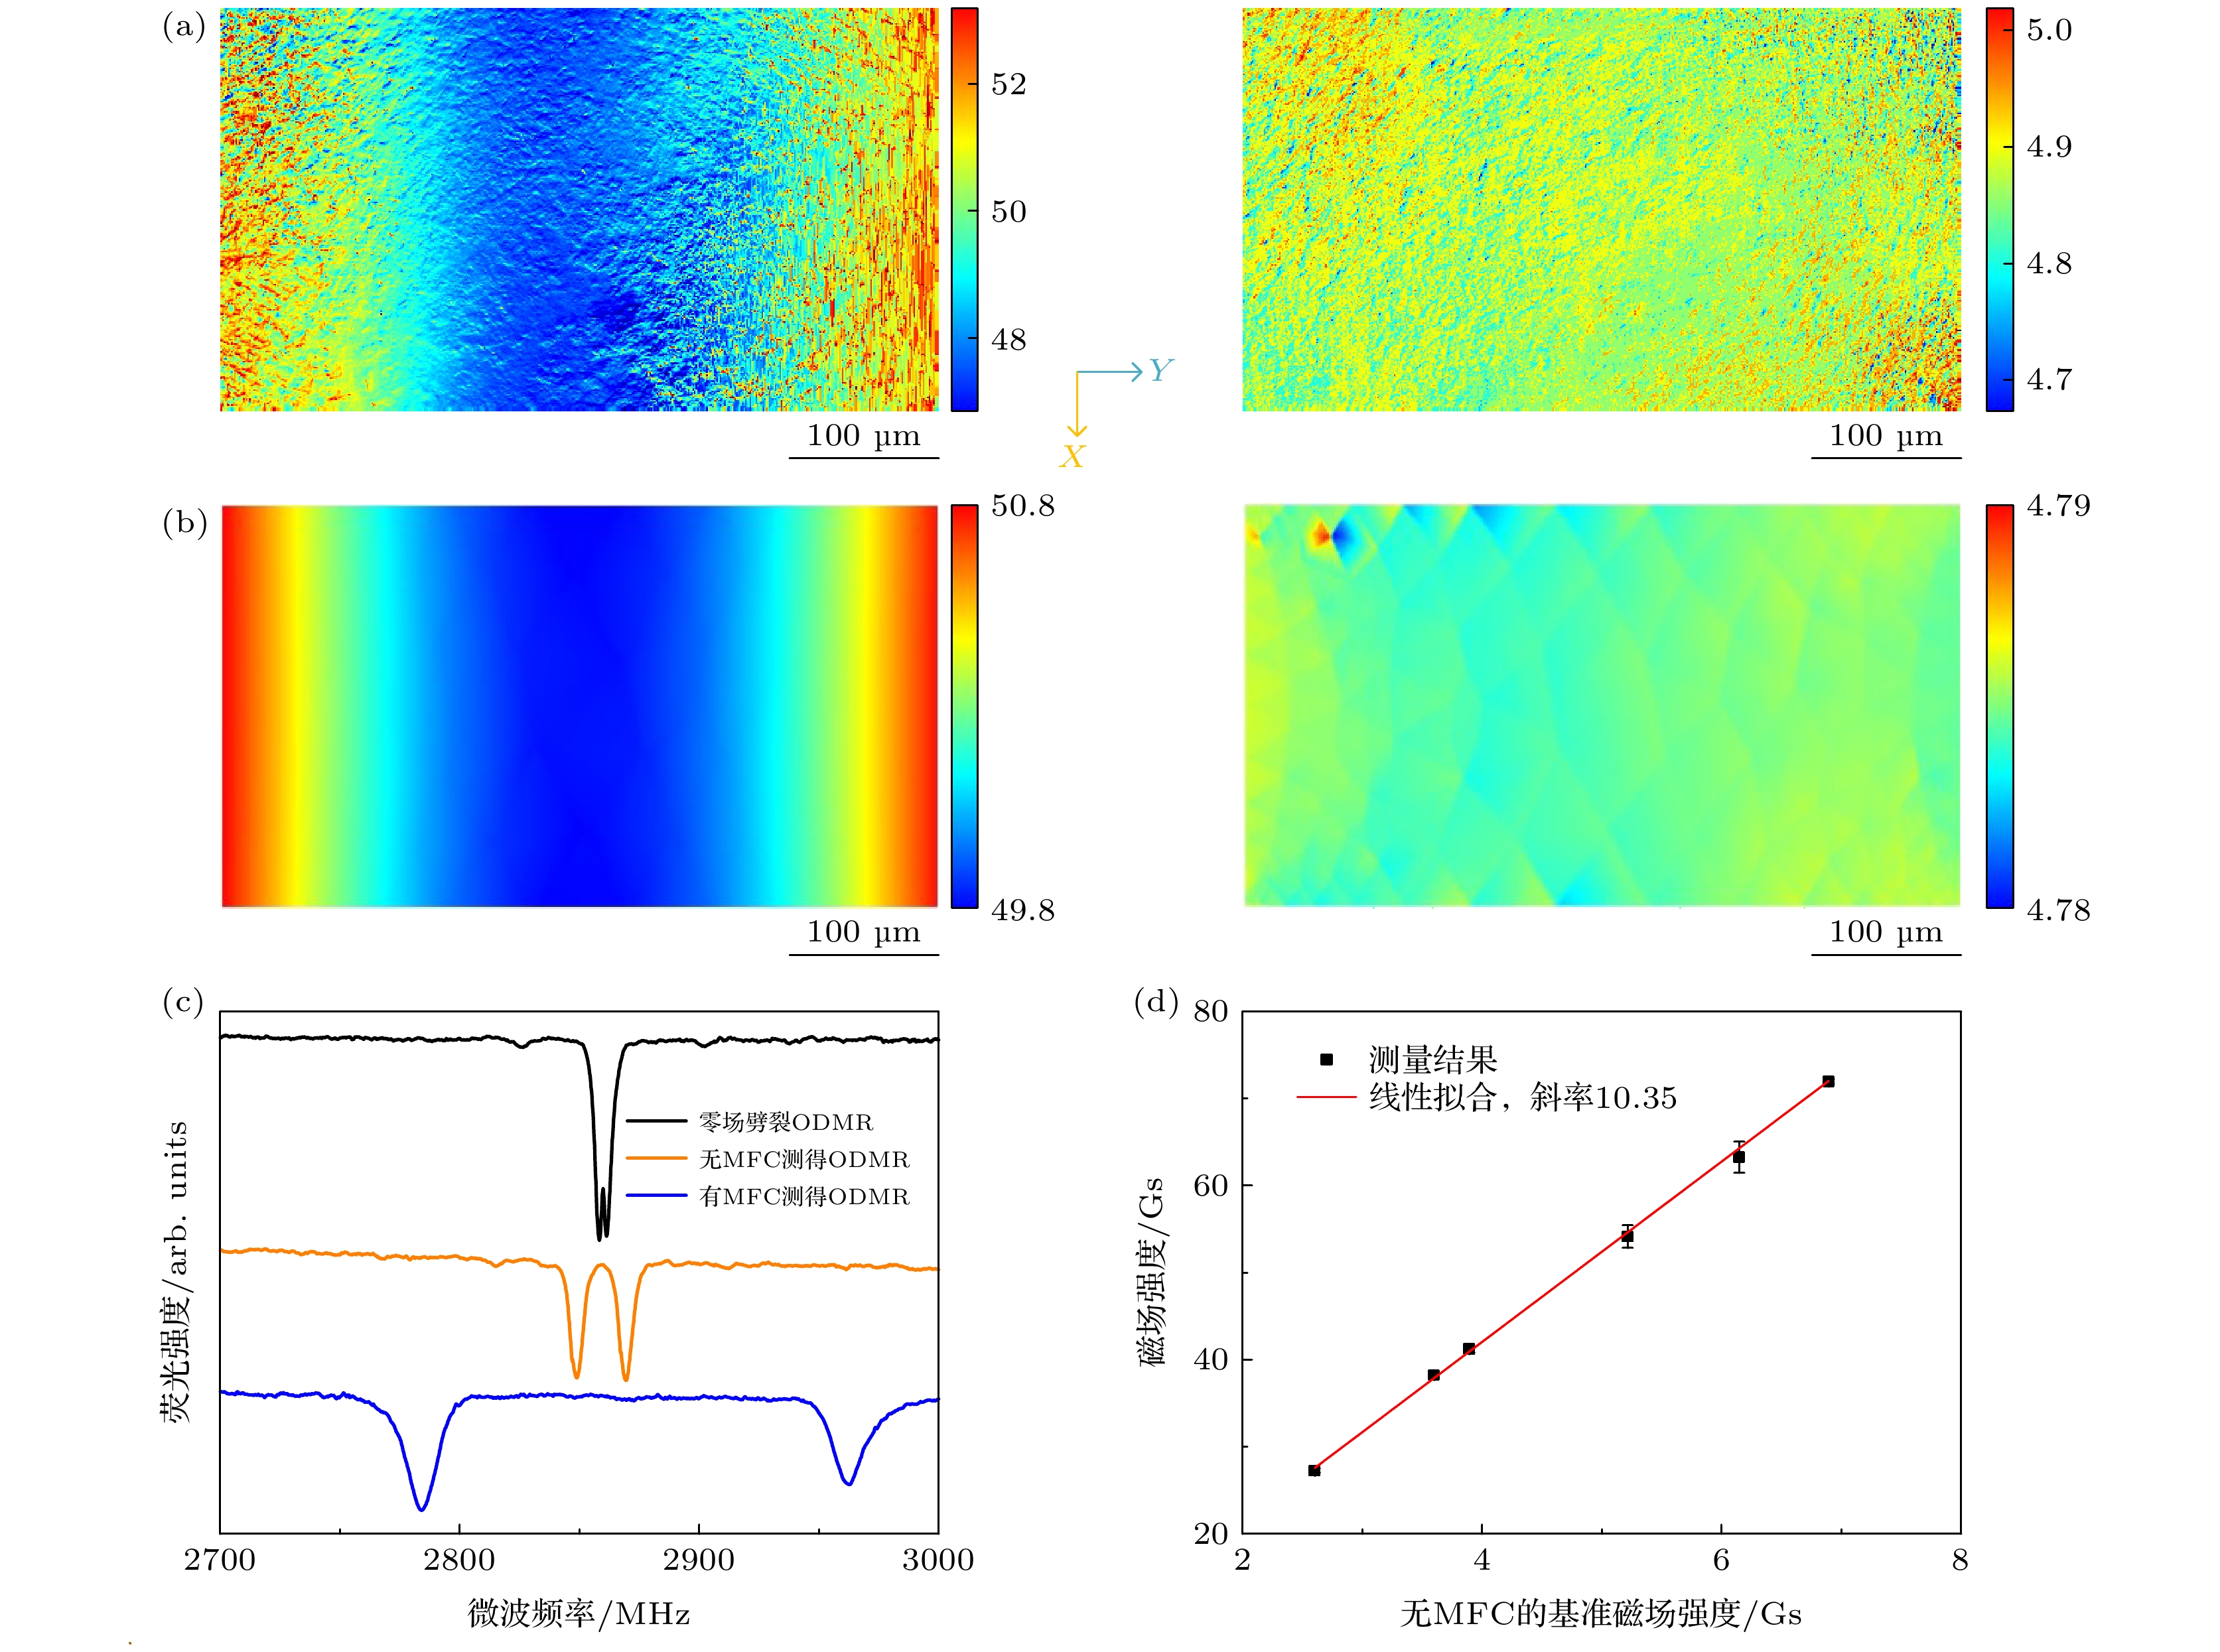 图 3 (a) 测量得到的1.0 mm间距MFC的测量位置磁场分布图(左)与同样位置处无MFC磁场分布图(右), 单位Gs; (b)仿真得到的图(a)的两个对应图; (c)三种状态的ODMR曲线, 只有背景磁场(黑线)、有待测磁场无MFC(橙线)、有间距1.0 mm 的MFC (蓝线); (d) MFC间距1.0 mm时改变待测磁场强度得到的增强磁场与基准磁场关系
Figure3. (a) Simulated magnetic field distribution diagram of the MFCs with a 1.0 mm gap (left) and without MFCs at the same position (right); (b) corresponding photos of panel (a) obtained by measurement; (c) ODMR curves under three conditions: only background magnetic field (black line), magnetic field without MFC (orange line), magnetic field with MFC of 1.0 mm gap (blue line); (d) relationship between the enhanced magnetic field and the reference magnetic field obtained by changing the intensity of the magnetic field to be measured when the MFCs gap is 1.0 mm.
系综NV色心磁灵敏度表示为

加入MFC后, 结合(3)式, 对应的共振频率偏移δνMFC则改变为
在空间轴向处金刚石两侧为两个对称放置的T型MFC, 通过图1(c) 所示的调节卡槽对MFC间距进行调节. 由于金刚石尺寸的限制, 初始间距设置为1.0 mm, 然后以0.5 mm与1.0 mm为间距增量逐步测量不同间距中心位置数据. 在不同MFC间距下测量得到ODMR曲线, 通过其峰值点差值根据(5)式计算得到的磁场Bn, 最后到最大距离后取下MFC, 测量得如图3(c)中橙线对应的无MFC磁场Bj, 得到MFC不同间距的磁场增强效果N = Bn/Bj.
如图2(b)所示, 用Comsol软件进行建模以上述同样的尺寸参数建立三维几何模型, 外部为材料为空气的长方体, 两永磁体沿测量轴线Y轴正向磁化1.8 × 10⁵ A/m, 对应无MFC时轴线正中心位置约为5 Gs. 根据材料性质, 设定MFC材料的相对磁导率为10000, 无MFC时则设定为1, 不同MFC间距时轴线中心位置的磁场强度Bnf与无MFC时轴线中心磁场强度Bjf的比值即为仿真增强效果Nf = Bnf/Bjf.
3.1.仿真与验证测量
首先使用宽场磁成像系统, 在间距为1.0 mm的成对MFC之间的轴线中点位置处进行成像, 磁场成像结果如图3(b)所示, 通过成像结果可以找到Y轴方向上磁场强度最小的位置, 将其调节到视场中间位置, 这个位置处的磁场方向受MFC磁场畸变影响而沿着Y轴方向, 且在X轴方向分量为零. 此处的磁场方向对应金刚石NV轴晶胞处于与四个NV轴向夹角相同的方向, 将这个位置得到的ODMR曲线作为待测量. 仿真得到的有无MFC的磁场分布图的总体分布趋势与测量得到的磁分布趋势如图3(a)和图3(b)所示, 可以看到, 仿真与测试结果几乎一致.将MFC间距固定为1.0 mm时, 通过加减磁铁改变测量位置的磁场强度, 得到了如图3(d)所示的固定MFC间距为1.0 mm时测量位置处磁场强度随基准磁场强度的变化关系, 通过线性拟合得到其斜率约为10.35, 则对应该间距条件下的磁放大倍数为10.35, 该结果与仿真获得的磁增强倍数10.67几乎是一致的.
2
3.2.不同MFC间距的磁增强测试
通过对不同间距条件下MFC间隙中心处成像, 可以获得MFC不同间距条件下总体平均ODMR曲线, 如图4(a)所示. 可以看到, 随着MFC间距的增大, ODMR曲线的两个峰值点间距随之减小, 即随着MFC间距的增加, MFC磁增强效果逐渐减弱. 由于系统使用的系综金刚石NV色心样品尺寸的限制, 实验中所测量的MFC最小间距为1.0 mm. 仿真得到的不同间距的磁场增强倍数如图4(b)中蓝圈所示, 而黑色方块为测量得到的磁场增强倍数, 可见测量磁场增强倍数与仿真结果匹配得很好. MFC磁场增强倍数与间距变化的对应关系可表示为[29] 图 4 (a) MFC不同间距下ODMR曲线; (b)仿真(红色圆圈)与测量(黑色方点)得到的不同间距MFC的磁场增强倍数曲线, 蓝线为拟合曲线.
Figure4. (a) ODMR curves of MFC with different gap widths; (b) magnetic field enhancement curve of MFC with different gap widths obtained by simulation (red circles) and measurement (black dots). The blue line is the fitting curve.
2
3.3.磁灵敏度计算及预计
将测量得到的不同间距下的放大倍数N, ODMR对比度C与半波全宽ω, 以及通过(7)式计算得到的光子速率R代入(9)式, 可以得到不同间距下对应的系统磁灵敏度, 如图5所示. 可以看出, 随着MFC间距的减小, MFC对中心位置处磁场强度的放大倍数逐渐增大, 磁灵敏度提高, 系统磁灵敏度可由无MFC时的1. 10 nT/Hz1/2提升至MFC间距为1.0 mm时的0.30 nT/Hz1/2. 将测量结果再根据(9)式与(11)式进行拟合, 得到蓝色的拟合曲线, 根据曲线可以估计在间距为0.5 mm时, 对应磁灵敏度能达约0.25 nT/Hz1/2, 可实现磁检测灵敏度的有效提升. 图 5 黑色方点为测量得到的不同间距下的磁灵敏度, 红线为无MFC状态下的磁灵敏度, 蓝线为拟合曲线, 蓝色星形为估计得到的间距为0.5 mm的磁灵敏度
Figure5. The black square points are the measured magnetic sensitivity at different intervals, the red line is the magnetic sensitivity without MFC, the blue line is the fitting curve, and the blue star is the estimated magnetic sensitivity with a pitch of 0.5 mm.
