全文HTML
--> --> -->受聚焦型空间X射线仪器特点限制, 例如要实现较大的集光面积, 整星结构尺寸需非常大, 通常为几米到十几米量级, 而焦平面探测器敏感探测区域特别小, 通常为厘米量级(考虑到角分辨率和视场), 用蒙特卡罗方法计算粒子本底过程类似于厚屏蔽计算中的深穿透问题[11], 需要的计算资源巨大. 在解决深穿透问题时, 会使用强迫碰撞、偏倚抽样、几何分裂与轮盘赌、组合减方差等方法尽量提高计算效率[12], 但对减方差应用技巧要求较高. 同时反向蒙特卡罗方法在模拟全物理过程(主要是强相互作用过程)中又很难实现[13]. 在仪器设计阶段, 设计方案的优化迭代需要实现快速估算, 同时具有足够的精度, 然后到设计方案基本确定时, 再通过建立实际质量模型精细计算复核. 本文针对仪器设计初级阶段的需要, 提出了一种快速估算聚焦型空间X射线仪器粒子本底的方法. 以增强型X射线时变与偏振(eXTP)[14]空间天文台上的能谱测量X射线聚焦望远镜阵列(SFA)焦平面探测器核心结构作为研究对象, 通过模拟计算不同尺寸、不同面密度简化球壳对空间辐射环境中不同成份在有效能段内的响应, 发现粒子本底水平主要受面密度影响, 不同成份随面密度变化有各自的特点, 对聚焦型空间X射线望远镜的物理设计具有一定的指导意义.
文章安排如下: 第2节介绍抑制本底设计及面密度分布插值法的假设前提、原理以及主要过程; 第3节简述实现粒子本底计算的主要过程及基本配置; 第4节以SFA为例, 给出面密度对SFA各种成份及总的粒子本底影响; 第5节通过模拟计算eXTP-SFA实际整星结构对应的粒子本底水平, 与快速估算方法对比; 第6节和第7节分别为讨论与总结.
在keV到十几keV能段, 聚焦型X射线要实现较大的集光面积, 整星结构尺寸非常大, 通常几米到十几米量级, 整星质量也非常重; 同时, 焦平面探测器敏感探测区域特别小, 通常厘米量级(考虑到角分辨率和视场), 周围还会有机壳、安装结构、热控、电子学等结构. 焦平面探测器敏感探测区域相对于整体结构尺寸非常小, 适合使用球壳结构近似代替除焦平面探测器敏感探测区域外的结构, 来研究粒子本底水平随整体结构的演化[19]. 同时, 在面密度相同的情况下, 不同材料的屏蔽效果差异不大, 因此可以用等效面密度铝来研究不同尺寸、不同面密度下焦平面探测器上的粒子本底, 从而更简单直接地分析整星结构变化对粒子本底的影响.
基于面密度分布插值估算粒子本底方法主要步骤: 首先建立焦平面探测器质量模型, 通过模拟计算得到不同面密度、不同尺寸铝球壳的各种成份粒子本底水平, 得到粒子本底随面密度分布曲线; 其次建立整星质量模型, 计算焦平面探测器敏感区域位置不同方向的面密度分布; 最后依粒子本底随面密度分布曲线, 对敏感区域位置不同方向的面密度分布进行插值, 得到敏感区平均的各种成份粒子本底水平.
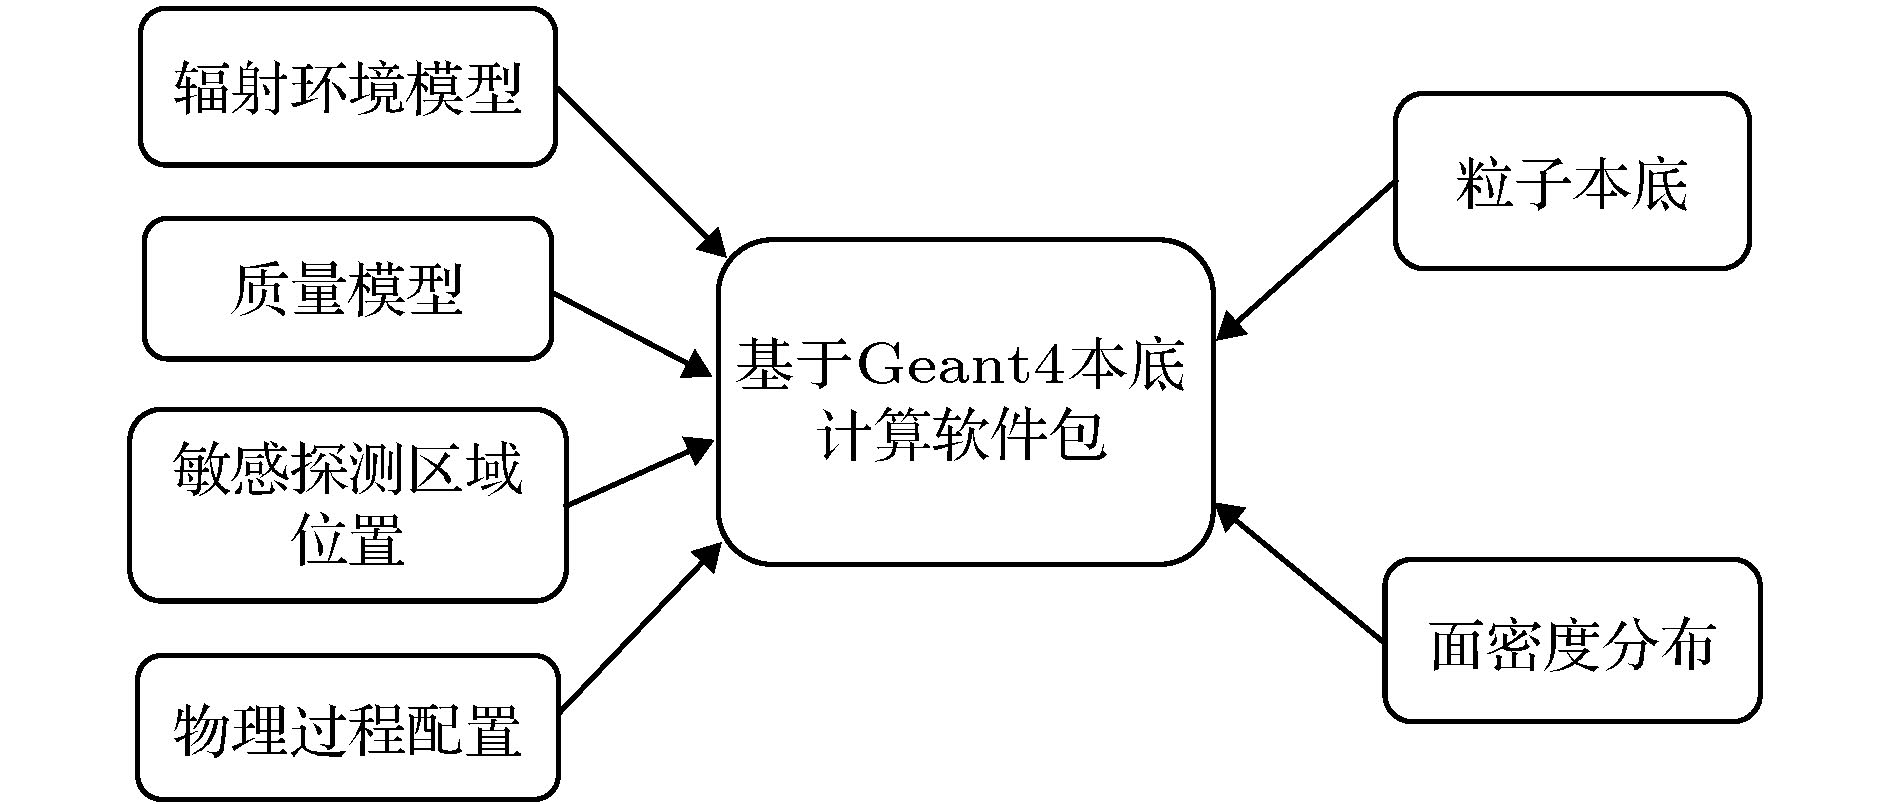 图 1 模拟计算过程
Figure1. Flowchart of the simulation process.
针对空间应用, Geant4软件有多个建议的预封装物理包[23]. 参考高能天体物理学先进望远镜(Athena)项目应用经验[24], 使用QBBC预封装物理包, 包含强相互作用、衰变、输运等过程. 同时为了使低能端响应更准确, 电磁相互作用过程改用精度更高的EmStandardPhysics_option4预封装物理包, 并打开Auger和PIXE过程[23], 即考虑荷电粒子电离导致的特征X射线以及俄歇电子产生, 实现百eV以上精细物理过程.
对于引起粒子本底的空间辐射环境, 在“慧眼”卫星在轨空间环境模型的研究基础上[25], 确定eXTP所在轨道(550 km高度, 0°倾角)空间辐射环境, 轨道处各空间粒子成份的入射谱如图2所示. 主要包括宇宙弥散X射线, 大气反照X射线及中子, 宇宙线原初质子、正负电子及氦核, 以及宇宙线与大气作用产生的次级质子和正负电子. 其中原初宇宙线考虑地球遮挡效应, 大气反照射线仅考虑地球所覆盖立体角[26]. 同时, 观测姿态暂定义为背地指向姿态.
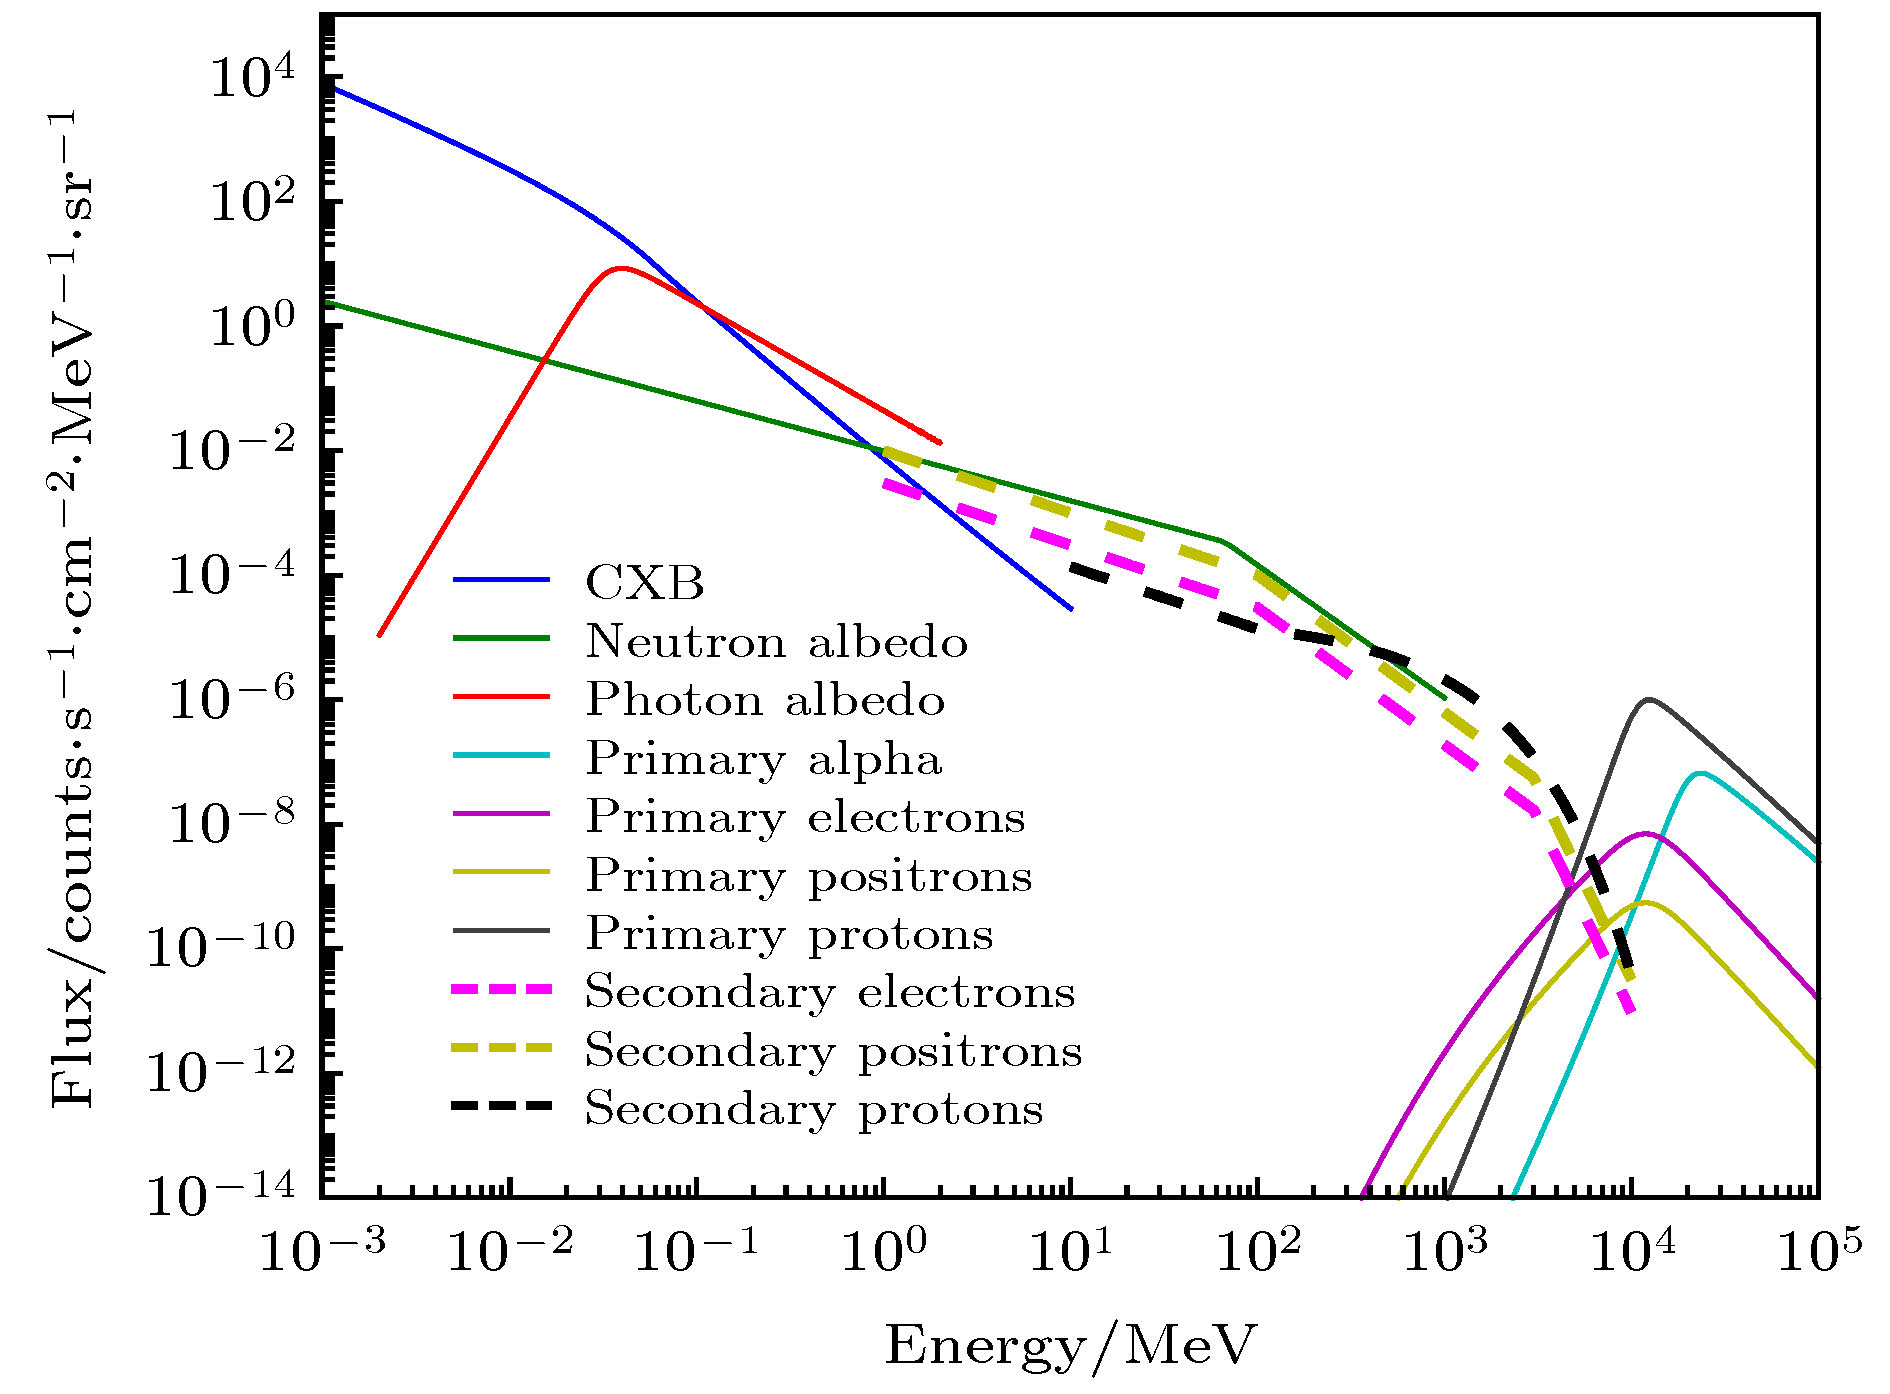 图 2 eXTP所在轨道空间辐射环境输入能谱
Figure2. Incident energy spectrum of the space radiation environment in the orbit of eXTP.
eXTP焦平面探测器质量模型如图3所示. SFA焦平面探测器采用19像素的硅漂移探测器(SDD), 其质量模型主要考虑上层铝膜、二氧化硅极层、硅耗尽层及封装陶瓷结构, 并赋予对应材料及密度. 为了研究不同尺寸、不同厚度(面密度)铝球壳对粒子本底的影响, 构建了简化球壳与SDD质量模型, 如图4所示. 铝球壳半径设置为10, 30, 50, 70 cm, 球壳厚度设置为0, 5, 10, 30, 50, 70 mm. SFA探测单元结构如图5所示, 主要包含电子学机箱、探测器机壳、滤光转轮、安装筒、准直筒等结构. 整星模型如图6所示, 主要包括支撑结构、安装板子、外层板、聚焦镜及其他平台仪器简化结构[14], 基本保持与整星预估质量一致.
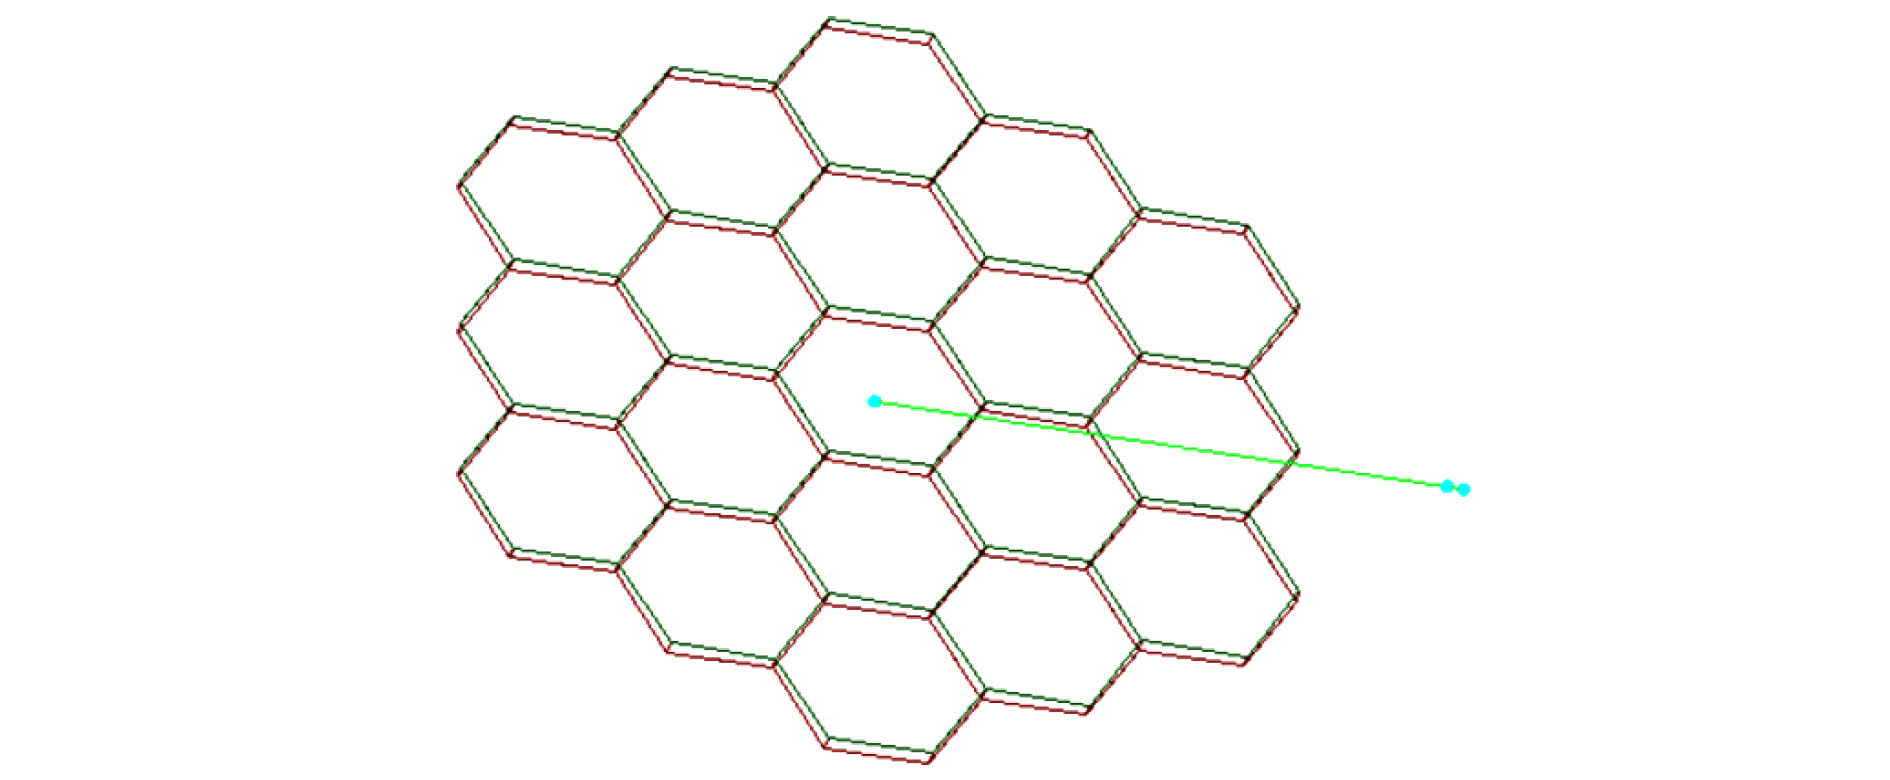 图 3 焦平面探测器SDD质量模型
Figure3. Mass model of the focal plane detector SDD.
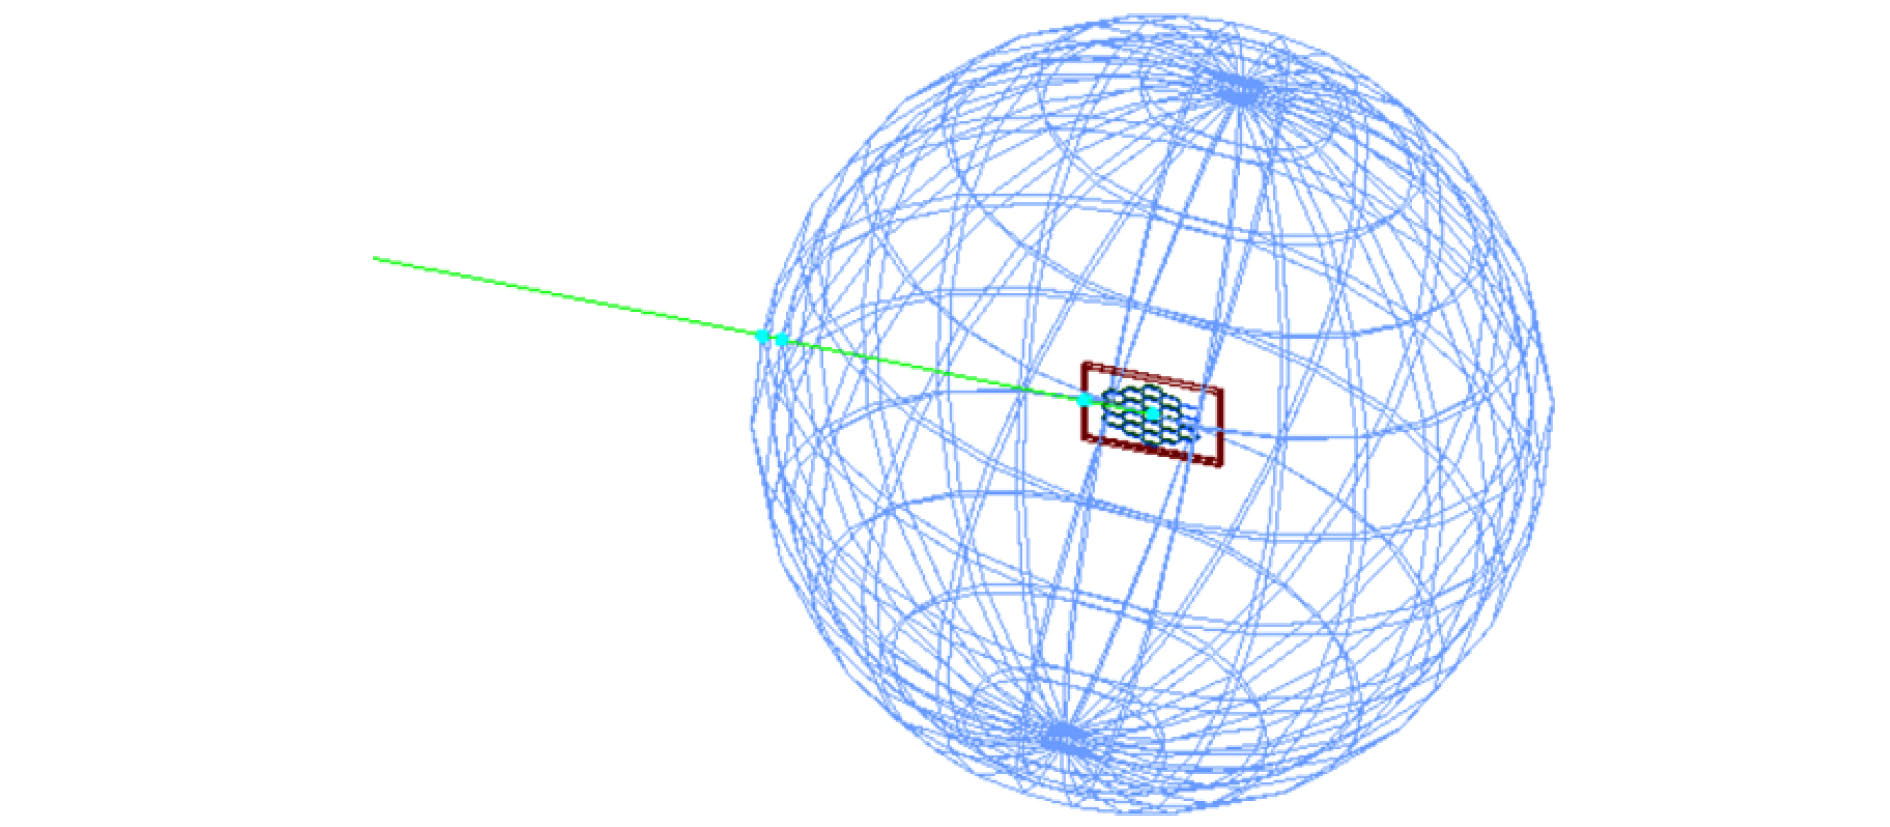 图 4 简化球壳和SDD质量模型
Figure4. Mass model of simplified aluminum spherical shell and SDD.
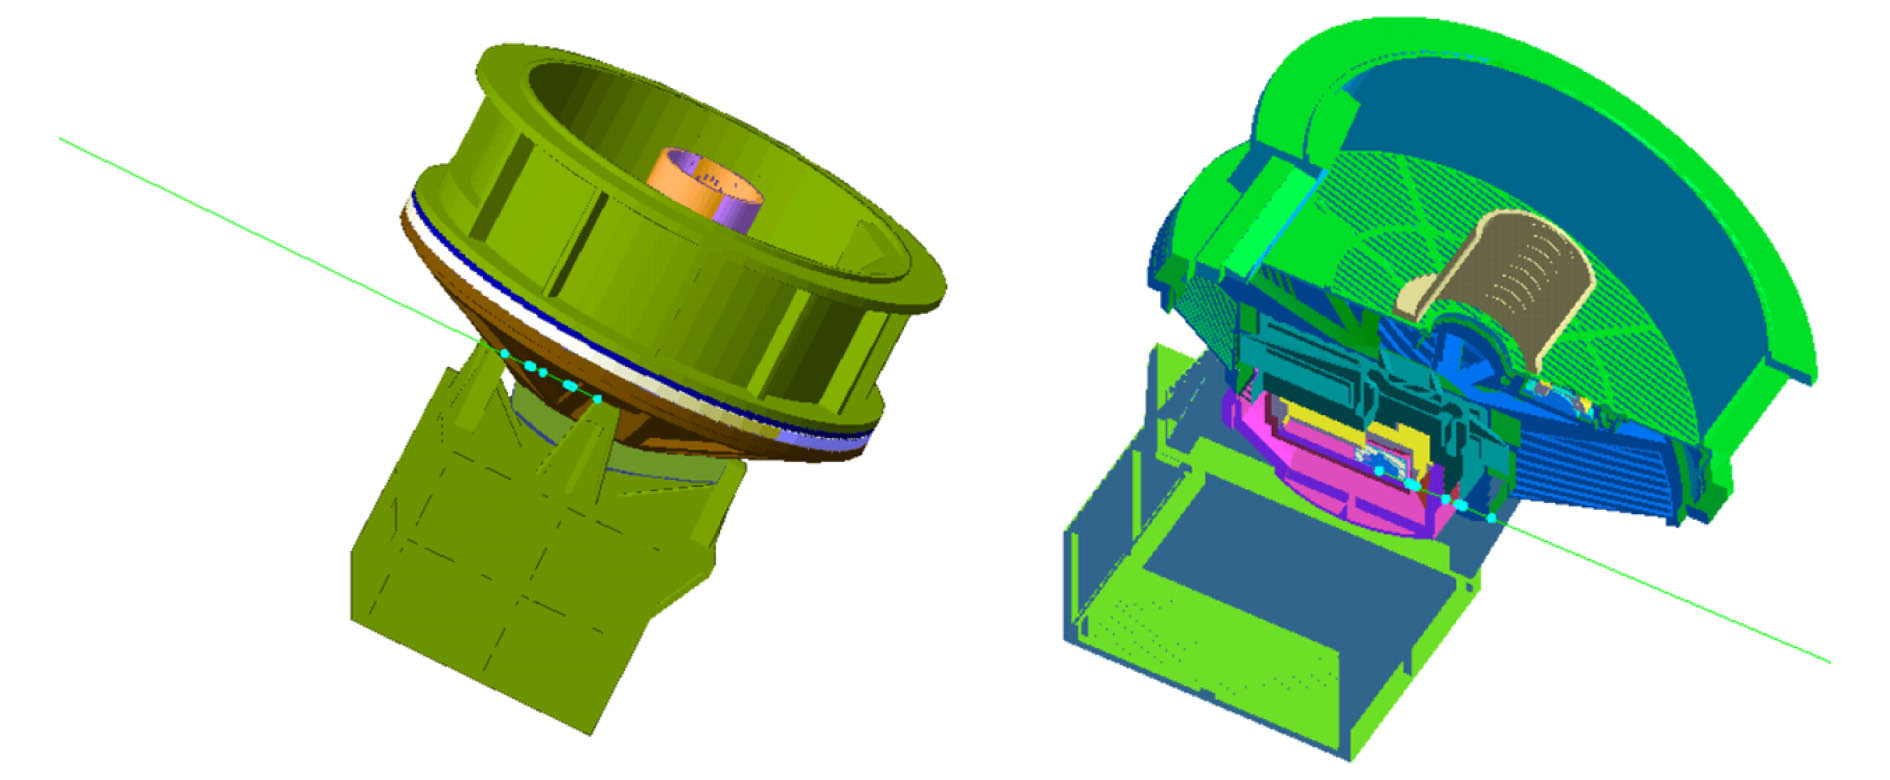 图 5 SFA探测单元结构
Figure5. Structure of single SFA module.
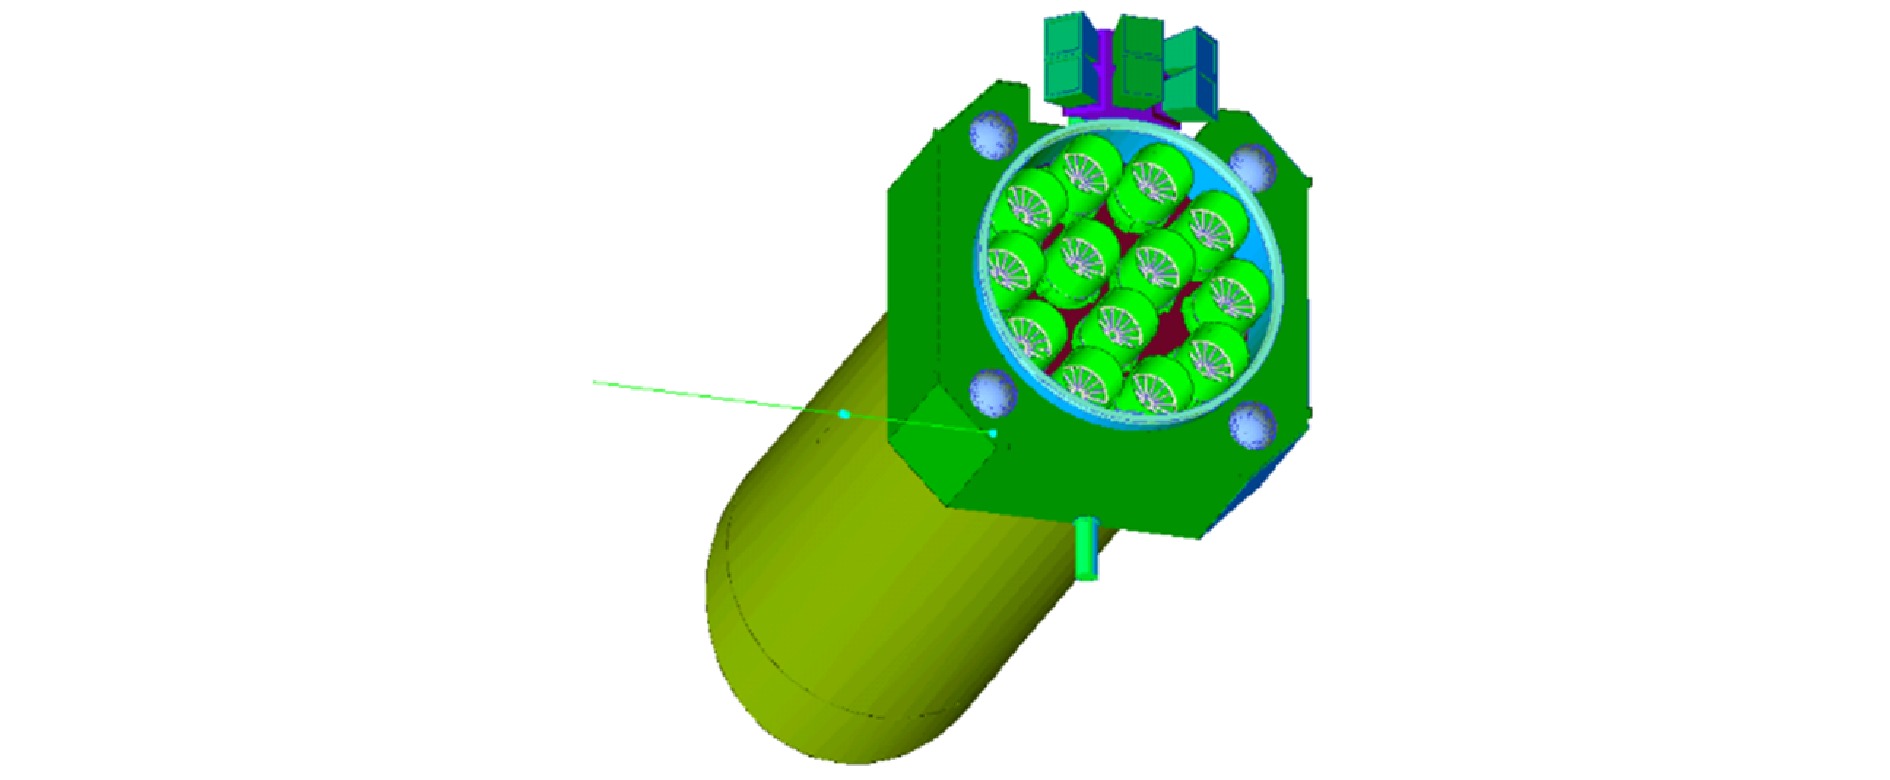 图 6 eXTP整星模型
Figure6. Mass model of the eXTP satellite.
面密度分布计算采用径迹追踪方法[27], 在敏感探测位置(即探测敏感区域, SDD位置)各向同性发射虚粒子, 虚粒子具有直线径迹, 仅实现发射方向直线上经过的各种不同材料结构的位置点统计, 依据在各种结构中的径迹长度与密度, 可计算得到该方向总的面密度值. 图7为SFA中SDD位置的面密度分布图.
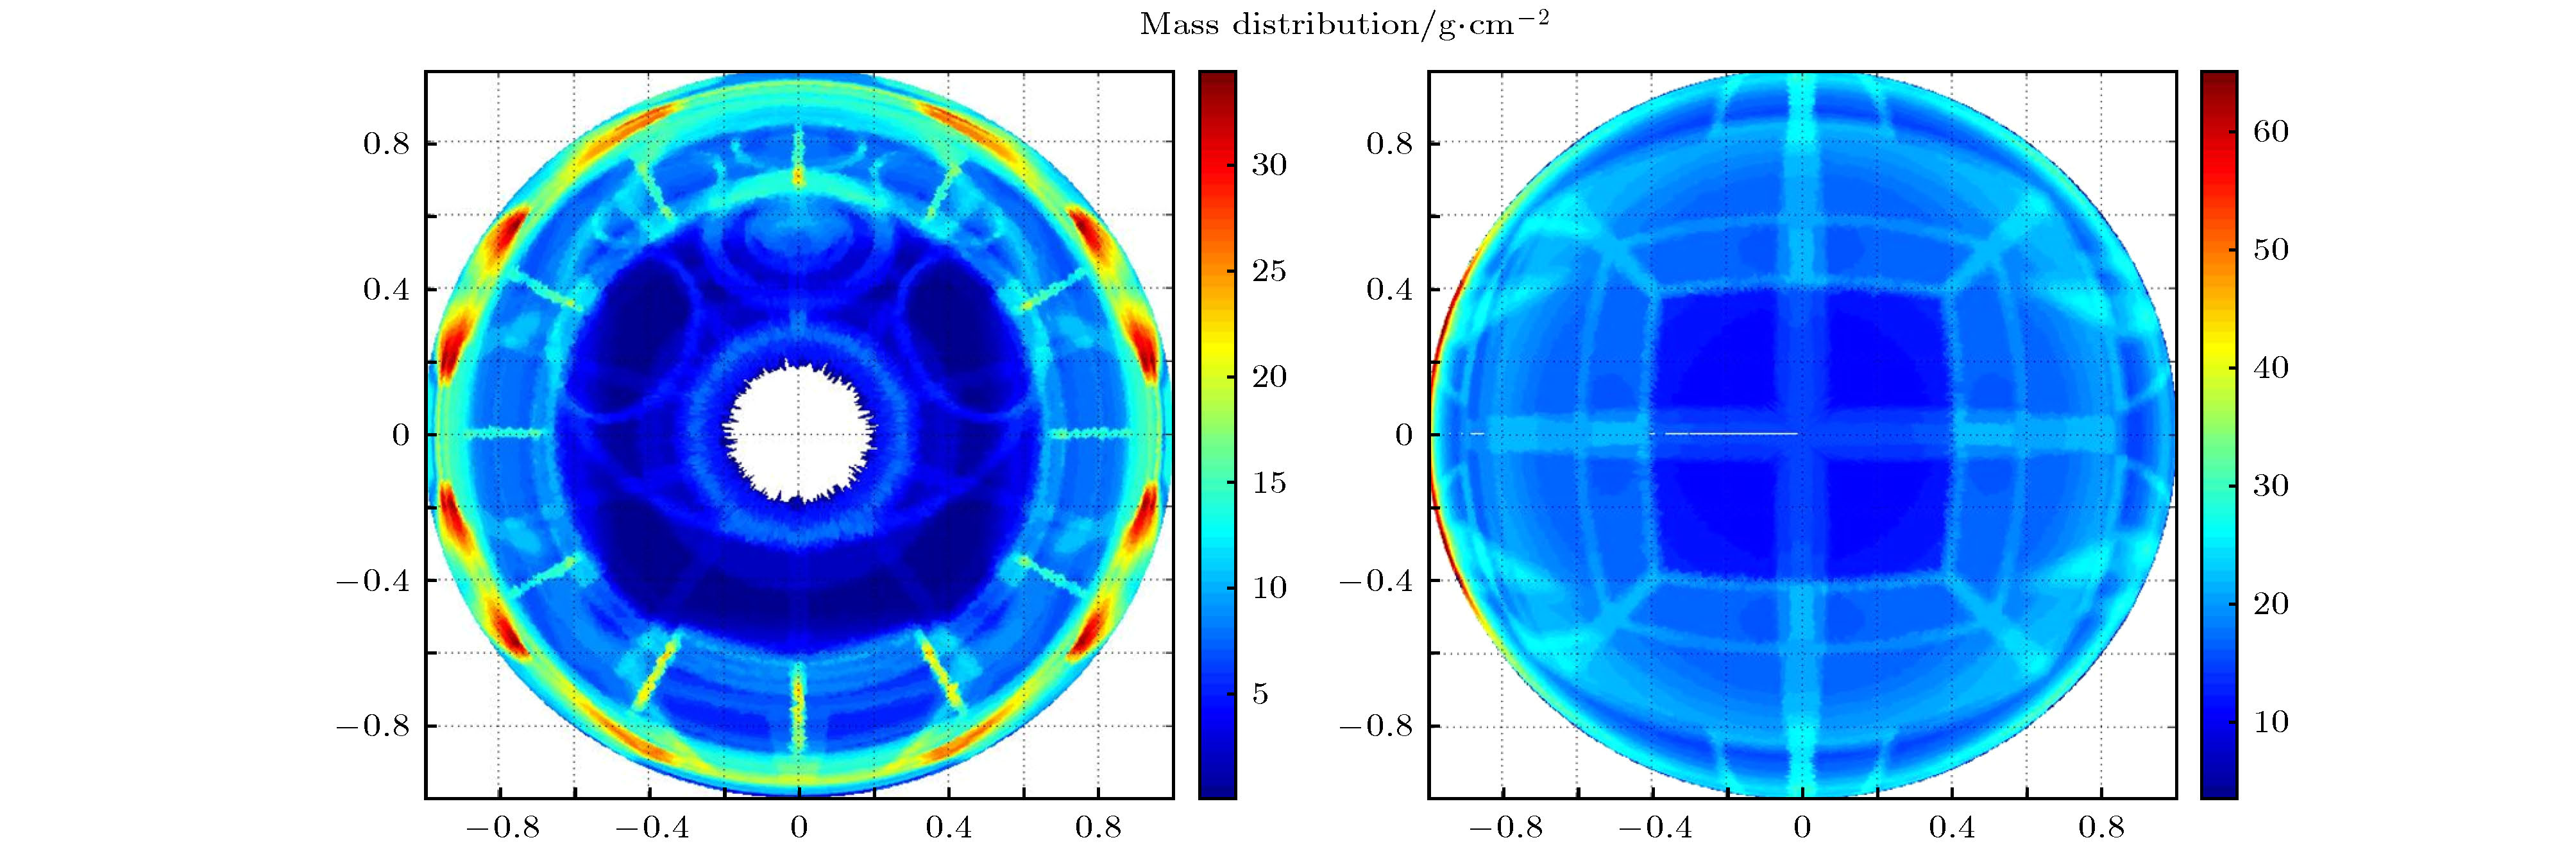 图 7 SFA探测单元中SDD位置的面密度分布图(左: 正向; 右: 背向)
Figure7. Planar density distribution at the position of SDD (left: frontview; right: backview).
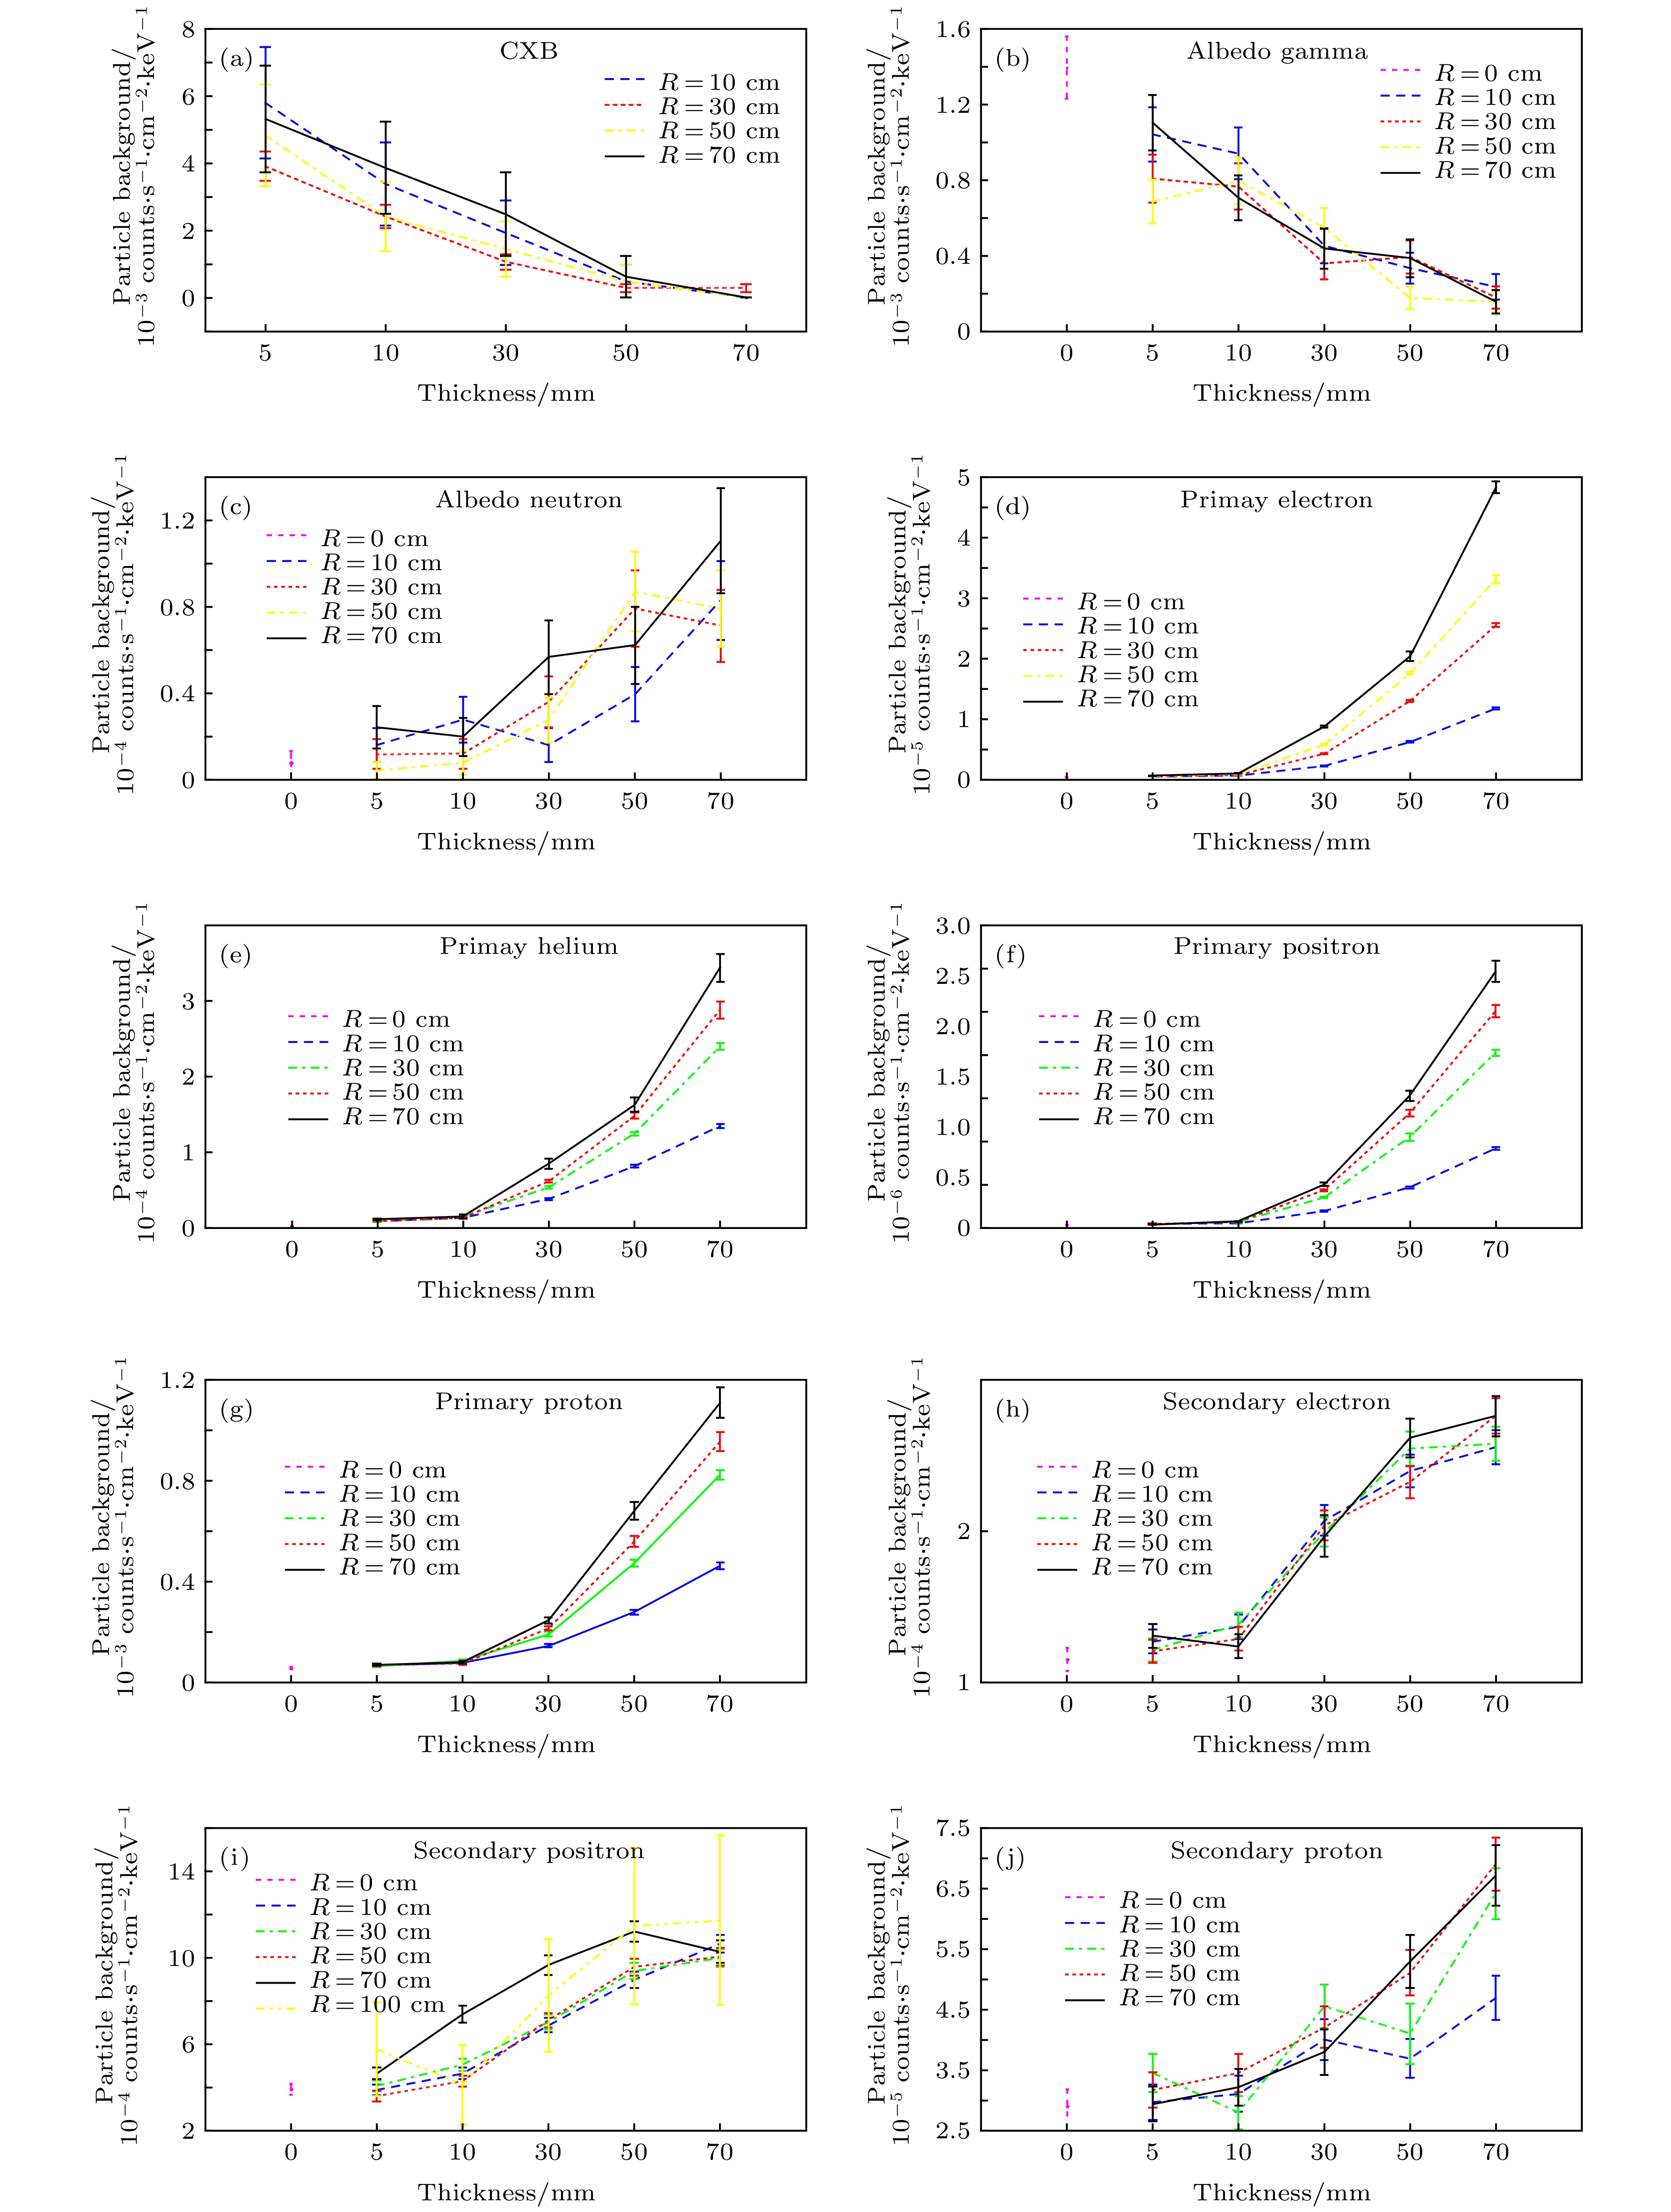 图 8 粒子本底水平随球壳尺寸及厚度变化
Figure8. Particle background evolution as a function of the size and the thickness of the aluminum spherical shell.
图8给出了基于简化铝球壳结构得到的不同成份粒子本底水平随球壳半径和厚度的变化, 其中纵坐标为能量沉积在0.5—15 keV范围内的计数率(单位为counts·s–1·cm–2·keV–1). 从图8可以看出, 基于简化铝球壳得到的各种成份粒子本底主要依赖于球壳的厚度变化, 即面密度. 其中, 原初本底成份在铝球壳半径为10 cm时有较大不一致. 由于焦平面探测器尺寸(直径D)为3 cm, 铝球壳半径为10 cm时, 焦平面探测器的几何效应引入较大偏离, 随着球壳半径(R)变大, R/D越来越大, 其影响越来越小. 图9为每种本底成份对应同一厚度不同球壳尺寸粒子本底的平均结果, 显示了各个成份粒子本底水平与铝球厚度(面密度)关系. 可以看出, 面密度大于10 g/cm2后, 粒子本底主要来源于宇宙弥散X射线、宇宙线原初质子及次级正电子. 宇宙弥散X射线造成的本底随屏蔽厚度的增加越来越小, 而原初质子随面密度增加反而有越来越多的趋势. 其中, 宇宙弥散X射线造成的本底对面密度特别敏感. 因此, 在进行屏蔽设计时要首先考虑宇宙弥散X射线的屏蔽, 在其控制在一定水平后, 再综合考虑其他成份的贡献. 图10显示了将图9 中对应各种成份本底相加得到的总的粒子本底水平随铝球厚度(面密度)变化. 可以看出, 总的粒子本底水平在面密度小于13.5 g/cm2时, 呈逐渐减小趋势, 在大于13.5 g/cm2时, 呈增加趋势.
 图 9 不同成份粒子本底随球壳厚度变化拟合曲线
Figure9. Fitting curves of different particle backgrounds as a function of the thickness of the aluminum spherical shell.
 图 10 SFA-SDD总的粒子本底水平随简化球壳厚度变化
Figure10. Total particle background evolution as a function of the thickness of the aluminum spherical shell .
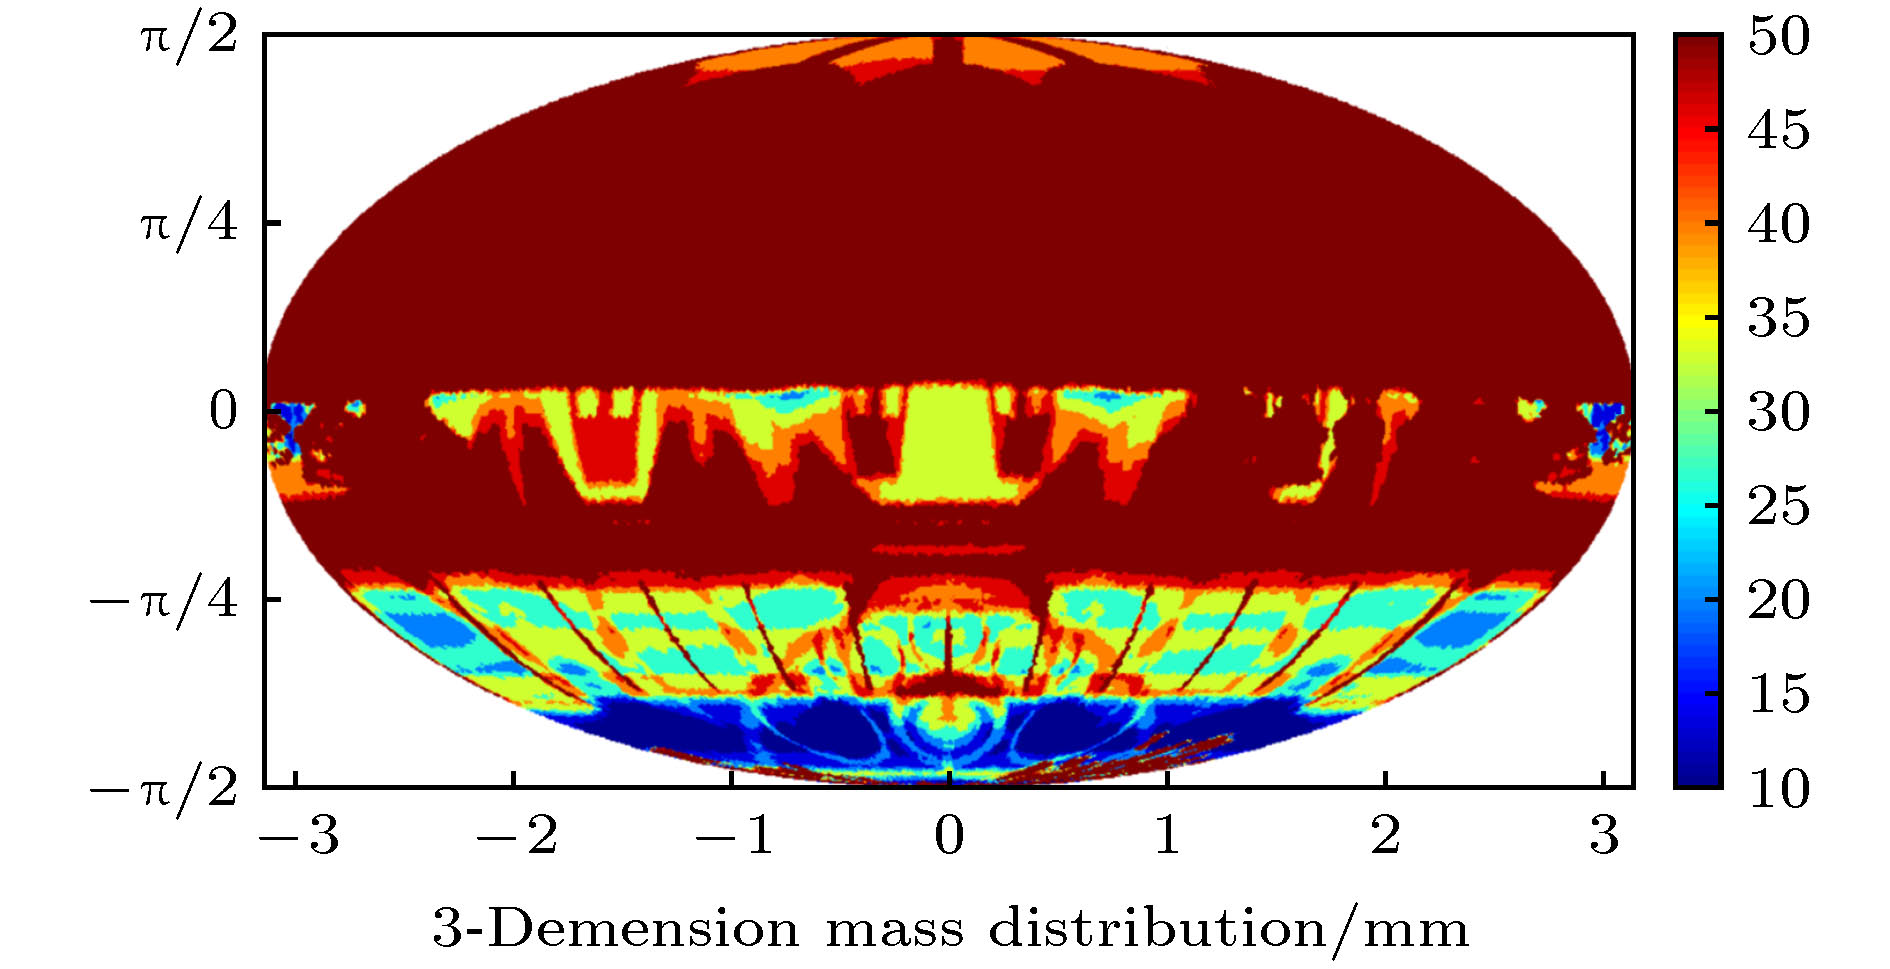 图 11 eXTP-SFA整星结构下敏感探测区(SDD位置)的等效铝厚度分布
Figure11. Equivalent aluminum thickness distribution of the whole eXTP at the SDD position.
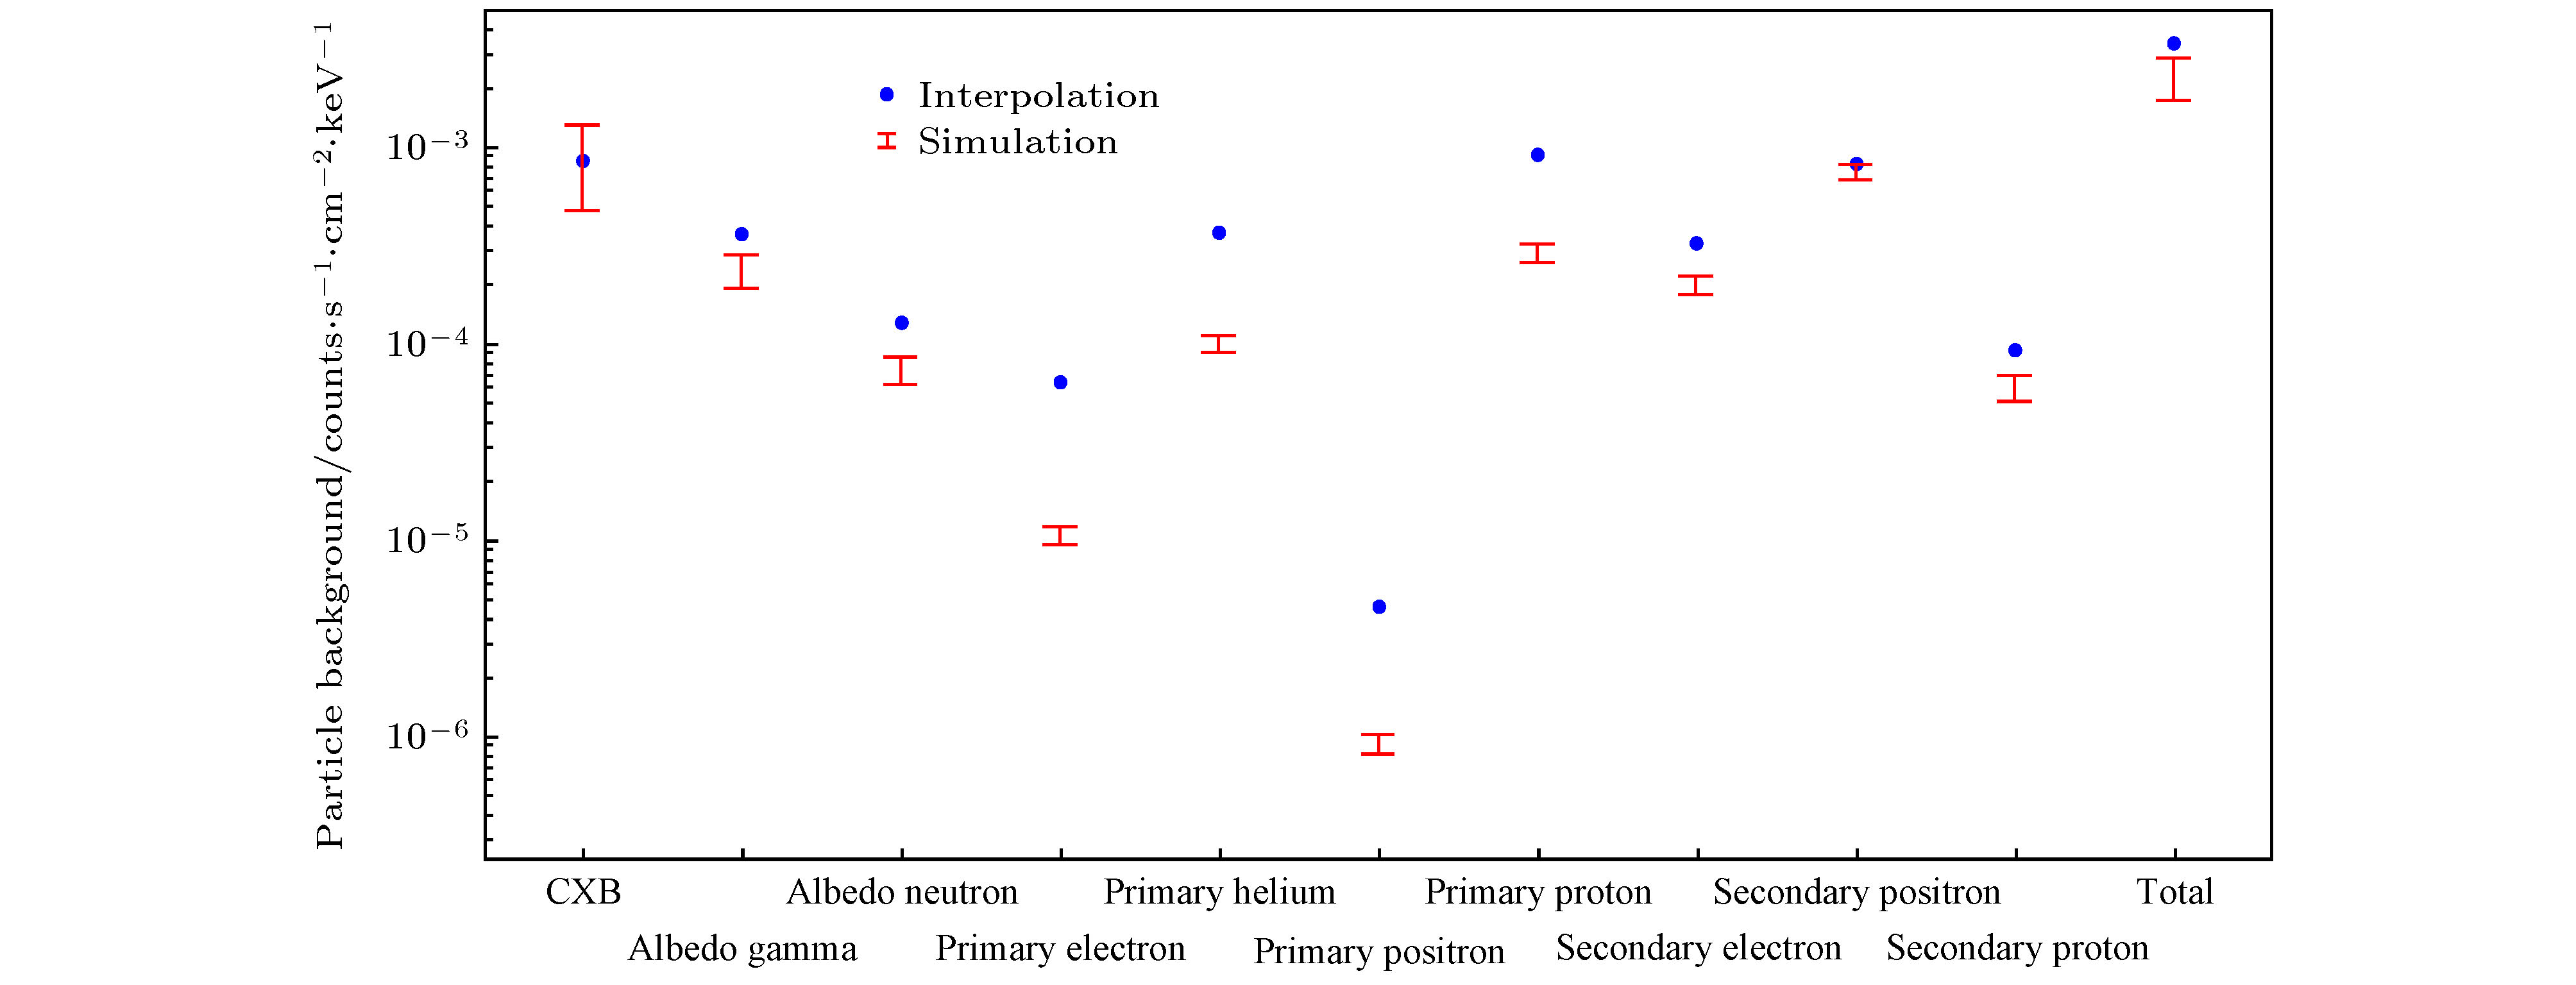 图 12 面密度分布插值法得到的粒子本底水平与模拟计算结果对比
Figure12. Comparison of particle background level obtained with interpolation of planar density distribution and with simulation.
为了更进一步检验面密度插值法结果的可靠性, 对这些区域采取加厚屏蔽措施, 即增加准直筒高度使准直筒限制视场与聚焦镜外延衔接, 同时增加准直筒安装板厚度到20 mm, 修改前后结构对比见图13, 其敏感探测区(SDD位置)的不同方向等效铝厚度分布见图14. 图15给出了修改SFA结构后(见图13, 对应面密度分布见图14)模拟计算结果与面密度分布插值法结果的对比图. 有效探测能段内, 总的粒子本底水平分别为(3.0 ± 0.7) × 10–3 和2.9 × 10⁻³ counts·s–1·cm–2·keV–1. 由于整星质量模型的计算效率非常低, 基于质量模型计算结果的差异主要由统计误差引起. 面密度分布插值法估计粒子本底水平与使用实际质量模型通过模拟计算得到的结果有很好的一致性.
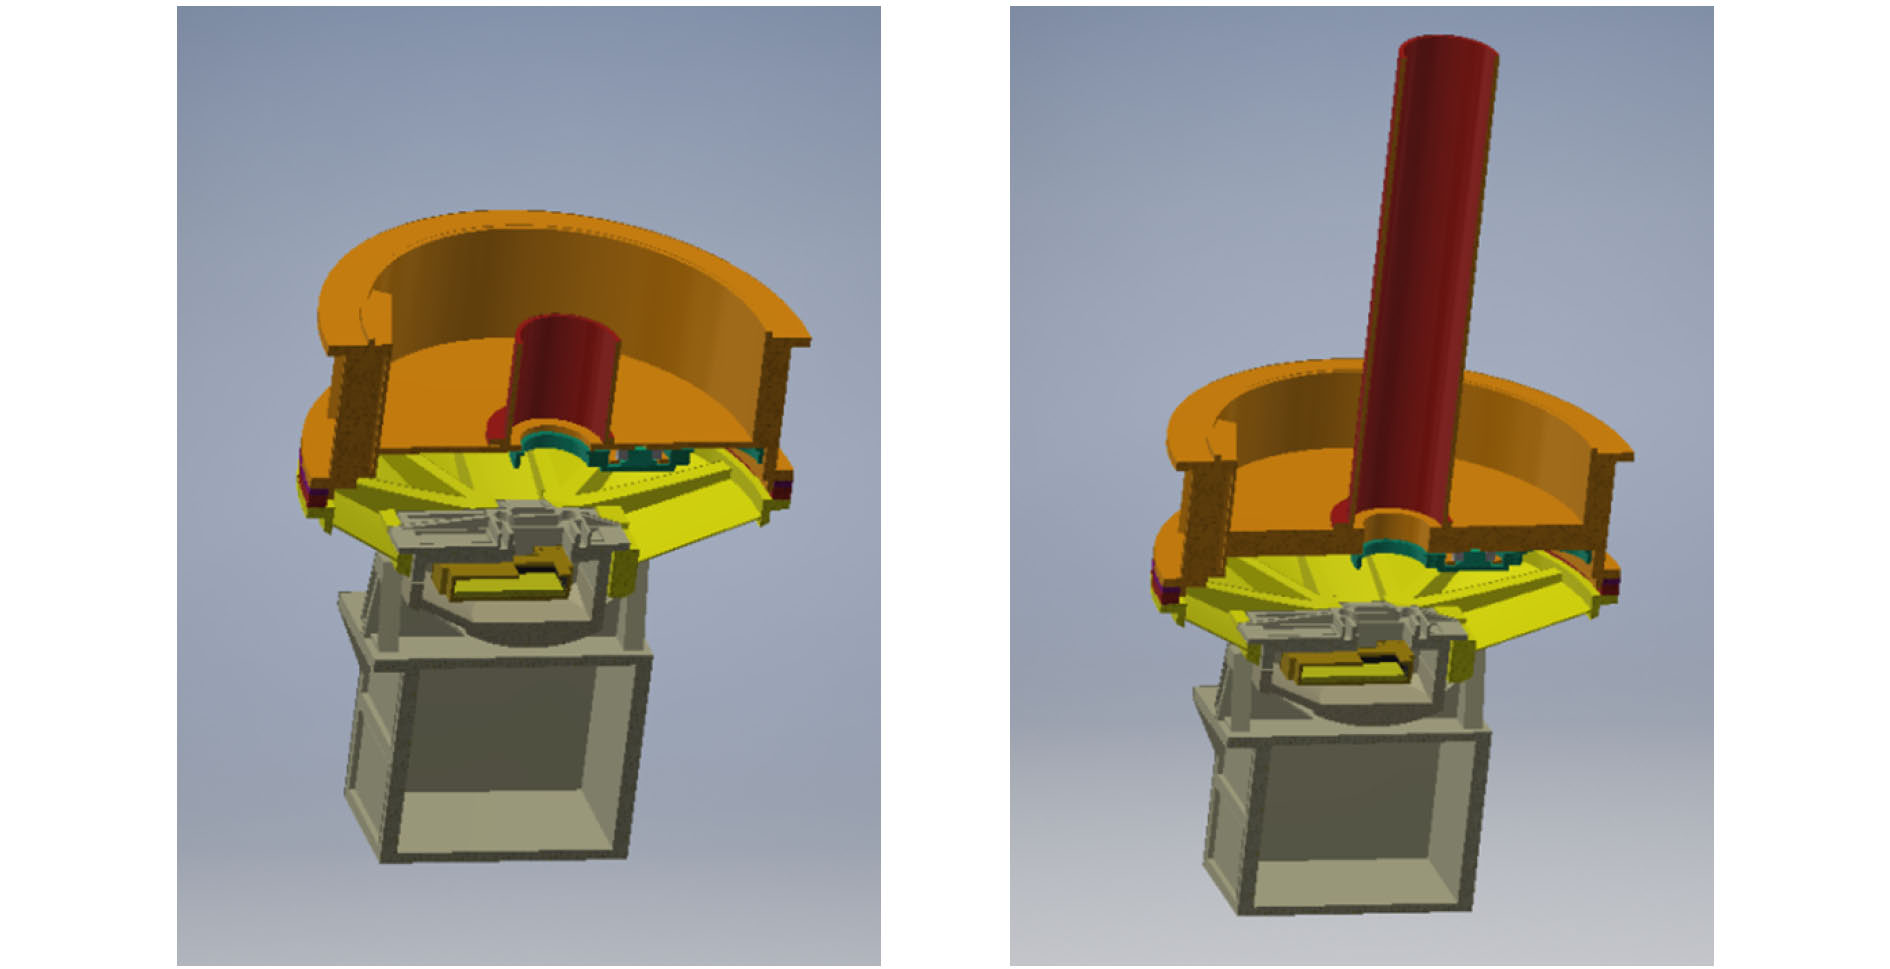 图 13 结构更改前后质量模型剖视图(左: 更改前; 右: 更改后)
Figure13. Structure of the mass model before and after structure modifications (left: before modifications; right: after modifications).
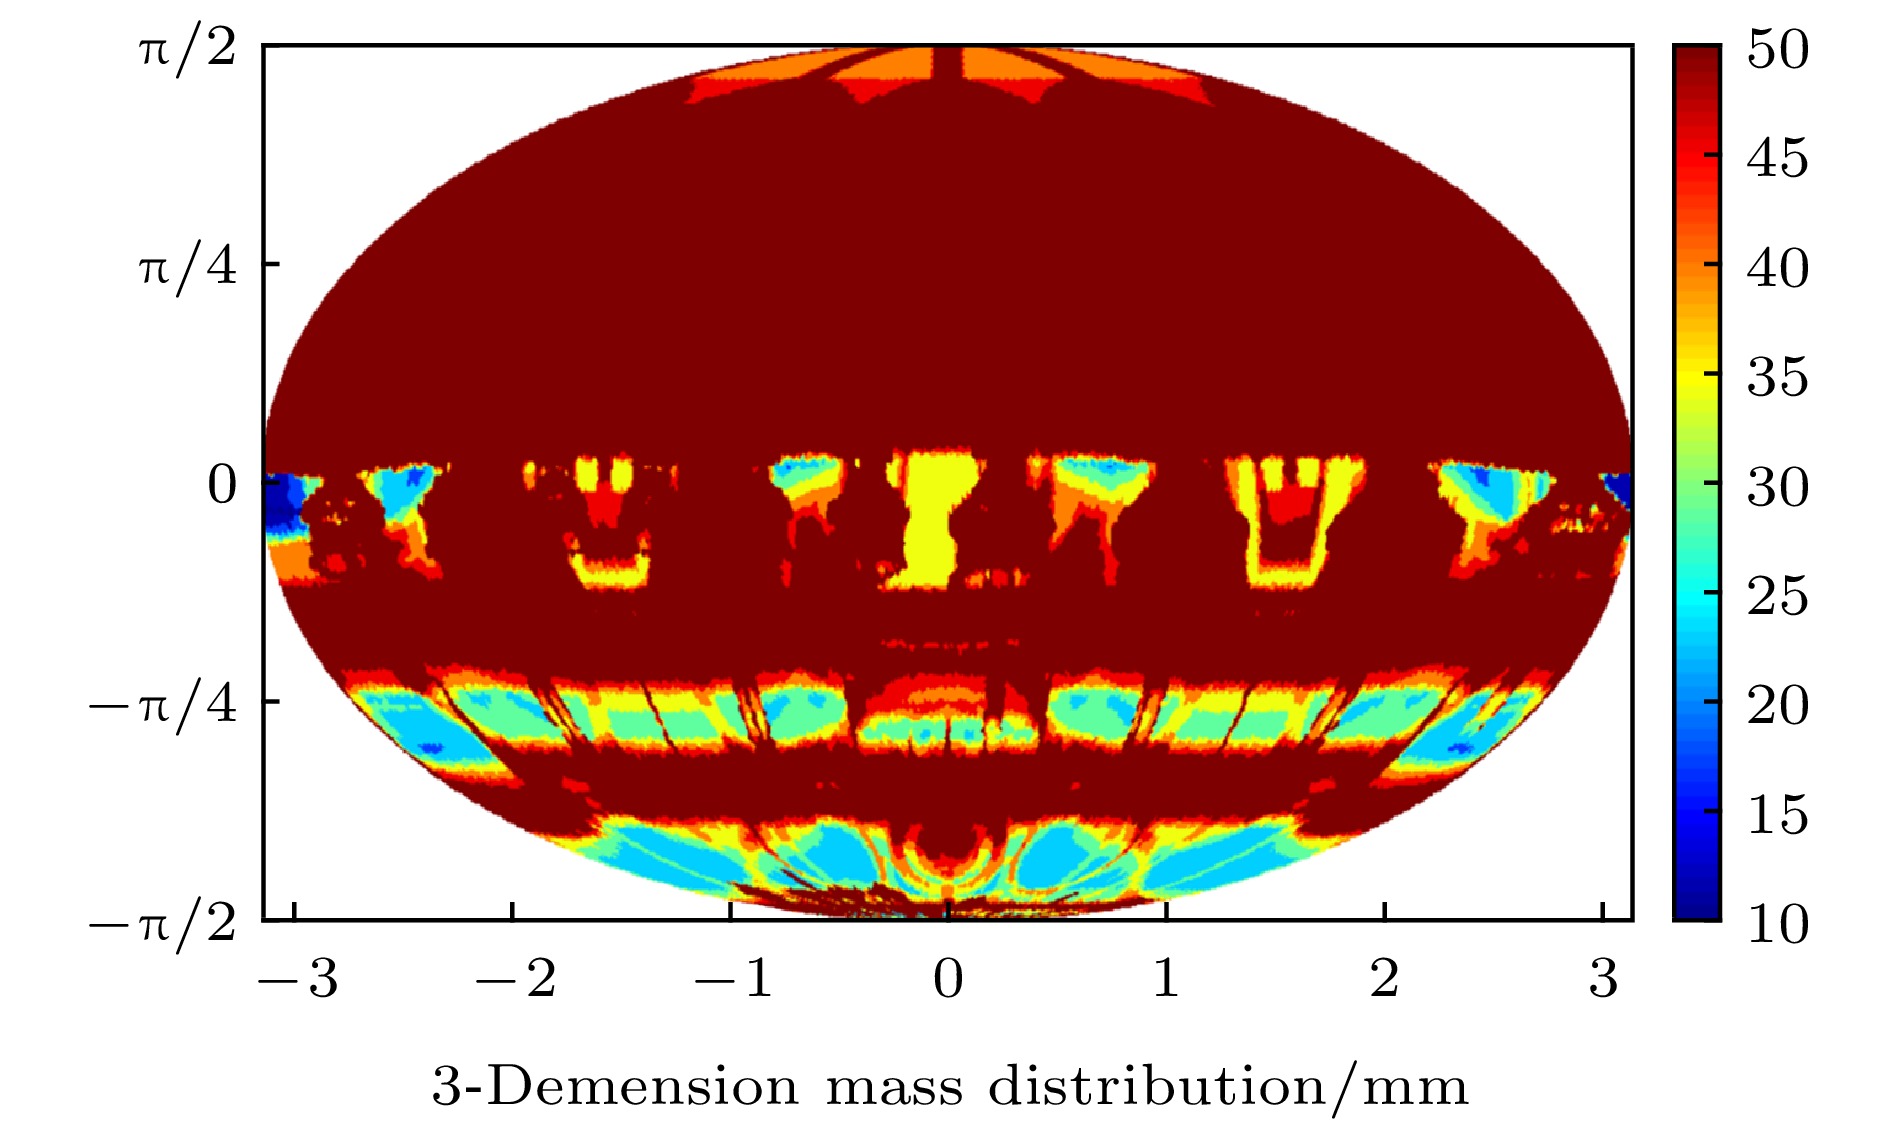 图 14 结构更改后等效铝厚度分布
Figure14. Equivalent aluminum thickness distribution after the structure modifications.
 图 15 结构更改后面密度分布插值法得到的粒子本底水平与模拟计算结果对比
Figure15. Comparison of the particle background levels after the structure modifications, from the interpolation of planar density distribution and the simulation, respectively.
屏蔽厚度增加对粒子本底水平的影响, 以占比较高的次级正电子成份为例. 由于次级正电子成份能谱较软, 随厚度再增加, 粒子本底水平开始趋于稳定并逐步减小, 见图16. 随厚度变化趋势主要和空间辐射环境有关. 粒子能谱较软, 则其达到峰值对应的面密度会变大. 影响粒子本底水平的主要为内壁薄层内的次级粒子成份, 屏蔽增厚, 内壁薄层处的粒子流强降低, 粒子本底水平降低.
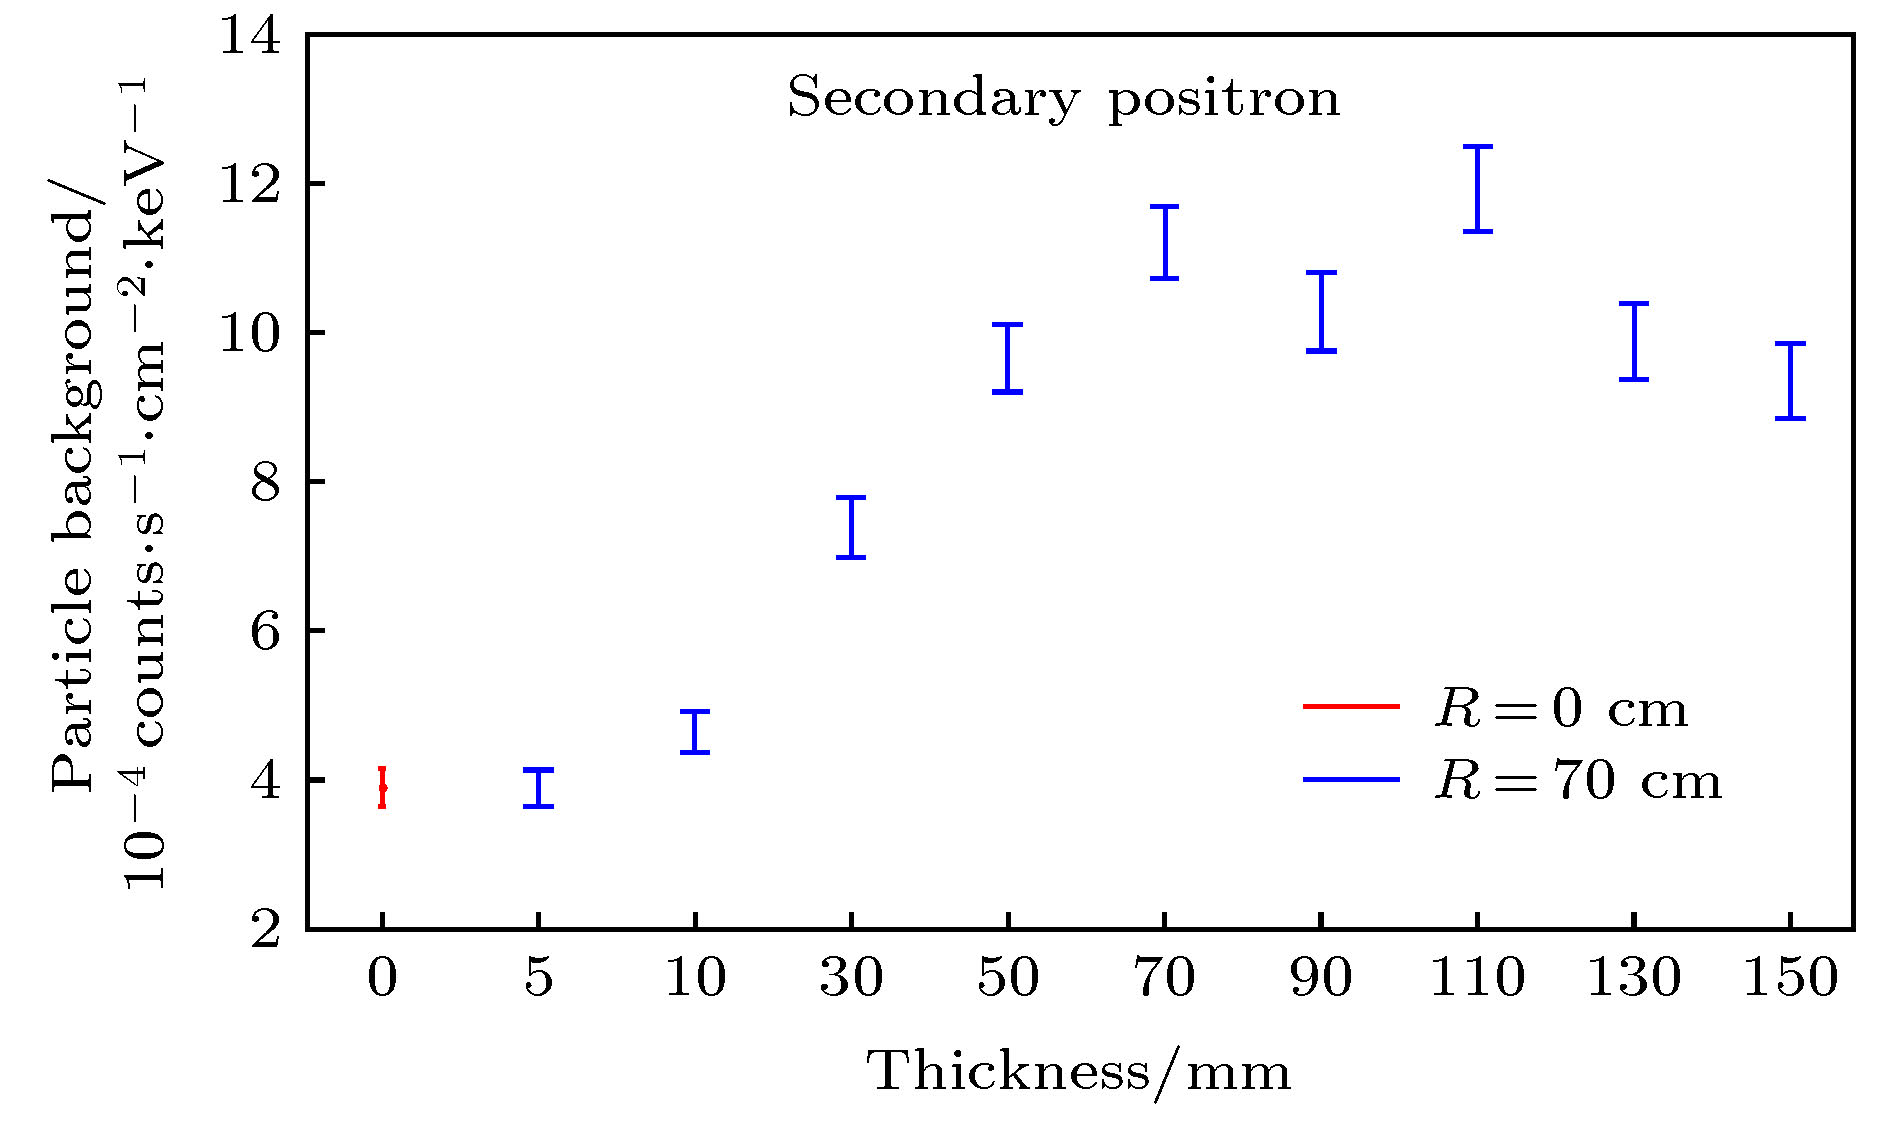 图 16 次级正电子成份随屏蔽厚度增加变化趋势
Figure16. Variation of the secondary positron composition as a function of the shielding thickness.
次级粒子对空间聚焦性X-ray粒子本底的贡献. 由于SFA-SDD耗尽层较厚, 宇宙线质子电离能损落在探测能段之外, 对粒子本底贡献更多是次级粒子成份. 次级粒子对仪器本底的贡献, 在神舟二号X 射线探测器上体现得非常明显, 在返回舱与留轨舱分离之后, 安装在留轨舱上的两个XD探头的背景计数率分别减少了50%以上[28]. 对于聚焦型空间X-ray仪器, 其探测能段更软, 本文没有深入研究能引起粒子本底的次级成份来源、机理及量化, 而只是给出了探测能段内总本底水平量化综合评估的结果.
面密度分布插值法使用的粒子本底随面密度变化曲线是基于eXTP-SFA焦平面探测器SDD设计得到的, 对于不同焦平面探测器类型, 其结果会有差异, 此差异可能来自探测器面积、材料、像素尺寸、耗尽层厚度、封装材料厚度以及视场方向多层结构等[29]. 因此其描述粒子本底水平随面密度变化更多的是反映整体结构贡献, 而对不同的空间项目可能会有一定差异. 但相对于整星计算, 可以节约大量时间, 初步确定粒子本底水平, 加快方案的尽快确定及后续精细分析进程.
感谢中国科学院微小卫星创新研究院提供的eXTP整星结构模型. 感谢中国科学院高能物理研究所卢方军研究员的讨论与建议.
