 ,1, 葛全胜1,2, 王焕炯,1
Spatio-temporal variations in the thermal requirement of the first flowering dates of Salix babylonica and Ulmus pumila in China during 1963-2018
TAO Zexing,1, GE Quansheng1,2, WANG Huanjiong,1通讯作者:
收稿日期:2019-07-26修回日期:2020-04-6网络出版日期:2020-07-25
| 基金资助: |
Received:2019-07-26Revised:2020-04-6Online:2020-07-25
| Fund supported: |
作者简介 About authors
陶泽兴(1989-), 男, 湖北十堰人, 博士后, 主要从事植被地理和物候学研究。E-mail:

摘要
关键词:
Abstract
Keywords:
PDF (3691KB)元数据多维度评价相关文章导出EndNote|Ris|Bibtex收藏本文
本文引用格式
陶泽兴, 葛全胜, 王焕炯. 1963—2018年中国垂柳和榆树开花始期积温需求的时空变化. 地理学报[J], 2020, 75(7): 1451-1464 doi:10.11821/dlxb202007009
TAO Zexing, GE Quansheng, WANG Huanjiong.
1 引言
植物花期变化及其影响因素是物候学研究的重要内容之一。花期与传粉者活动时间的匹配度对植物成功完成生殖过程具有重要意义[1,2]。揭示花期变化的影响因素并准确预测开花期可为赏花活动安排和致敏花粉防治提供科学指导[3,4]。在北半球亚热带和温带地区,植物开花期的完成需要一定积温[5],因此积温是衡量植物生长发育对温度条件需求的重要指标[6]。相对于工业革命前水平,人类活动已导致全球升温近1.0 ℃[7]。气候变暖使北半球大部分木本植物开花的积温需求在春季更快得到满足,导致开花始期显著提前[8,9]。已有大量研究利用积温模型估算出植物完成开花的积温需求,进而实现对植物花期的有效模拟[10,11]。例如,张爱英等[12]利用积温模型对北京地区3种观赏植物的开花始期和开花盛期进行了模拟,结果发现模型模拟的均方根误差为1.93~3.59 d。总体而言,积温模型在单站点对植物春季物候期的模拟误差通常为2~6 d,而在多站点的模拟误差大致为7~9 d[13,14]。积温模型的基本假设是植物春季物候期的积温需求在年际和站点间不变。为进一步提升积温模型的模拟效果,需考虑积温需求的时空异质性。利用遥感数据提取的物候期表明,森林生长季开始> 0 °C的最低积温需求在欧洲和亚洲约为563 °C·d,而在北美约为673 °C·d[15]。Cong等[16]计算了1998—2012年青藏高原春季植被生长季开始的积温需求,结果发现植被生长季开始在湿冷地区仅需极少的积温,但在干暖地区需要近1000 °C·d(> 0 °C积温)。除此之外,植物春季物候的积温需求在不同年份间也存在差异。Fu等[17]发现1980—2012年欧洲13种木本植物展叶始期的积温需求增加了近50%。在劳伦斯,美国白蜡(Fraxinus americana)极端温暖年份展叶的积温需求与非极端年份相比明显高[18]。因此,要提升对植物春季物候期的预测能力,急需系统研究积温需求的时空变化及其影响因素。
冬季冷激是植物开花积温需求时空变化的决定因素之一[19]。许多研究表明冬季冷激增加将减少植物春季物候的积温需求[20,21]。在欧洲,芬兰****对苹果和梨发育的控制实验发现,在低温下(6 ℃或9 ℃)冷激时间越长,在合适温度下(21 ℃)恢复生长的速度越快[22]。将挪威云杉(Picea abies)接受不同冷激时长后移入温室,发现冷激时间越长芽开放所需积温越少[23]。还有研究构建了植物春季物候积温需求与冷激日数的函数关系。例如,早期研究发现北美云杉(Picea sitchensis)芽开放所需积温随秋冬季冷激日数(低于5 ℃的日数)的增加而呈指数形式减少[24]。在美国东南部对桃(Prunus persica)的实验也同样证明,冷激与花芽开放所需积温呈指数函数关系[25]。
迄今为止,中国关于植物开花积温需求时空变化及与冷激关系的研究相对较少,这在很大程度上限制了物候模型的发展和植物春季物候期的准确预测。本文基于“中国物候观测网”观测数据和3种积温算法,计算了1963—2018年两种广布木本植物开花始期积温需求的空间格局和在典型站点的年际变化,分析了积温需求与冷激日数的关系。本文的目标是:①揭示中国典型木本植物开花始期积温需求的时空变化规律;②构建积温需求与冷激日数的函数关系,实现积温需求的时空模拟。
2 数据与方法
2.1 物候与气象数据
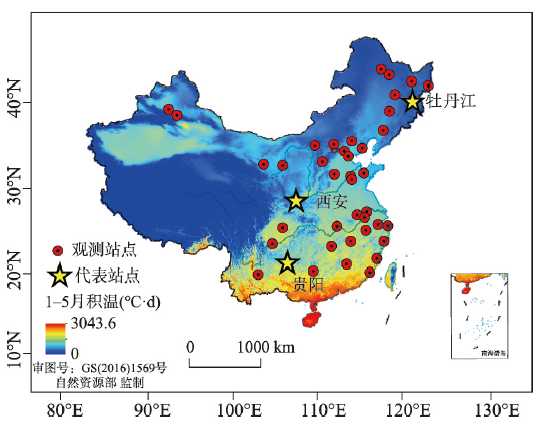
本文选取在中国分布广泛,观测资料丰富的垂柳(Salix babylonica)和榆树(Ulmus pumila)为研究对象。1963—2018年垂柳和榆树的开花始期数据来源于中国物候观测网(www.cpon.ac.cn)。开花始期定义为有一朵或同时有几朵花的花瓣开始完全开放的日期[26]。由于物候观测数据不连续,为尽可能保证积温需求计算的准确性和可重复性,本文将观测年份少于5年的站点剔除。筛选后垂柳和榆树开花始期的观测站点分别有36个和30个(表1),记录数量分别为523条和504条。各站点的热量条件存在很大差异。从1981—2010年1—5月大于5 °C积温来看,亚热带站点积温最高达到3000 °C·d,而温带地区积温多在1000 °C·d以下(图1)。由于研究开花始期积温需求的时间变化需要足够长的观测序列,因此本文选择物候观测记录最完整的3个代表性站点研究积温需求随时间的变化。3个站点分别为贵阳(26.65°N, 106.63°E,垂柳和榆树分别有30年、32年数据)、西安(34.21°N, 108.96°E,分别有39年、31年数据)、牡丹江(44.57°N, 129.58°E,均有42年数据)。其中,贵阳热量条件最好(1—5月积温1100 °C·d),其次是西安(1—5月积温700 °C·d),牡丹江最少(1—5月积温300 °C·d)。Tab. 1
表1
表1物候观测站和对应气象观测站位置
Tab. 1
| 编号 | 物候 观测站 | 观测地点 | 垂柳观测起止年(年数) | 榆树观测起止年 (年数) | 气象站 (编号) | 纬度 (°N) | 经度 (°E) |
|---|---|---|---|---|---|---|---|
| 1 | 嫩江 | 嫩江农场 | 1975—1994(10) | 1974—1991(16) | 嫩江(50557) | 49.19 | 125.24 |
| 2 | 五大连池 | 龙镇农场 | 缺测 | 1974—1979(5) | 北安(50656) | 49.00 | 126.78 |
| 3 | 佳木斯 | 黑龙江农科院 佳木斯分院 | 1983—1988(5) | 1966—1996(22) | 佳木斯(50873) | 46.81 | 130.34 |
| 4 | 虎林 | 虎林市气象局 | 1983—1987(5) | 1964—1987(7) | 虎林(50983) | 45.77 | 132.97 |
| 5 | 哈尔滨 | 黑龙江省森林植物园 | 1963—1979(5) | 1963—2014(26) | 哈尔滨(50953) | 45.75 | 126.63 |
| 6 | 牡丹江 | 牡丹江农气试验站 | 1978—2018(42) | 1965—2018(42) | 牡丹江(54094) | 44.57 | 129.58 |
| 7 | 石河子 | 石河子大学 | 1984—1996(12) | 1963—1996(16) | 石河子(51356) | 44.35 | 85.95 |
| 8 | 长春 | 吉林省自然博物馆 | 2003—2018(16) | 1986—2018(25) | 长春(54161) | 43.88 | 125.35 |
| 9 | 乌鲁木齐 | 新疆林科院 | 1985—2018(5) | 1963—1990(8) | 乌鲁木齐(51463) | 43.75 | 87.60 |
| 10 | 沈阳 | 沈阳农业大学 | 1964—2018(23) | 1964—2018(26) | 沈阳(54342) | 41.80 | 123.38 |
| 11 | 承德 | 河北旅游职业学院 | 缺测 | 1974—1996(10) | 承德(54423) | 40.85 | 118.06 |
| 12 | 呼和浩特 | 内蒙古大学 | 1979—2012(12) | 1964—2004(12) | 呼和浩特(53463) | 40.80 | 111.68 |
| 13 | 张家口 | 张家口气象局 | 1974—1993(10) | 1974—1993(10) | 张家口(54401) | 40.78 | 114.90 |
| 14 | 北京 | 颐和园 | 1974—2018(6) | 1963—2012(43) | 北京(54511) | 40.02 | 116.33 |
| 15 | 秦皇岛 | 秦皇岛市地理学会 | 1980—1993(12) | 1980—1993(12) | 秦皇岛(54449) | 39.88 | 119.25 |
| 16 | 天津 | 园林绿化所 | 1980—1992(9) | 1980—1992(12) | 天津(54527) | 39.39 | 117.07 |
| 17 | 原平 | 原平县水利局 | 1977—1982(5) | 1976—1982(7) | 原平(53673) | 38.73 | 112.71 |
| 18 | 民勤 | 民勤沙生植物园 | 缺测 | 1974—1996(20) | 民勤(52681) | 38.63 | 103.08 |
| 19 | 银川 | 宁夏气象科研所 | 2003—2018(20) | 2006—2018(13) | 银川(53614) | 38.48 | 106.22 |
| 20 | 邢台 | 达活泉公园 | 1982—1996(15) | 1982—1996(15) | 邢台(53798) | 37.09 | 114.48 |
| 21 | 潍坊 | 潍坊市气象局 | 1967—1996(9) | 1985—1996(8) | 潍坊(54843) | 36.69 | 119.08 |
| 22 | 济南 | 山东省科学院 | 1965—2018(5) | 1963—2018(8) | 济南(54823) | 36.65 | 117.04 |
| 23 | 泰安 | 山东农业大学 | 1963—1985(12) | 1963—1981(6) | 泰安(54827) | 36.17 | 117.10 |
| 24 | 西安 | 西安植物园 | 1964—2018(39) | 1964—2015(31) | 泾河(57131) | 34.22 | 108.97 |
| 25 | 南京 | 九华山公园 | 1987—2017(17) | 1987—2018(10) | 南京(58238) | 32.04 | 118.78 |
| 26 | 合肥 | 合肥师范学院 | 1965—2018(37) | 1965—2018(35) | 合肥(58321) | 31.83 | 117.25 |
| 27 | 芜湖 | 安徽师范大学 | 1963—1996(18) | 1963—1996(14) | 芜湖(58334) | 31.28 | 118.38 |
| 28 | 武汉 | 狮子山 | 1963—1981(6) | 缺测 | 武汉(57494) | 30.52 | 114.31 |
| 29 | 杭州 | 杭州植物园 | 1963—1983(9) | 缺测 | 杭州(58457) | 30.25 | 120.12 |
| 30 | 宁波 | 宁波农业科学研究院 | 1968—1996(25) | 1981—1989(6) | 鄞县(58562) | 29.85 | 121.62 |
| 31 | 屯溪 | 黄山学院 | 1982—1996(14) | 缺测 | 屯溪(58531) | 29.69 | 118.29 |
| 32 | 南昌 | 江西农业大学 | 2008—2018(9) | 1985—1991(7) | 南昌(58606) | 28.77 | 115.83 |
| 33 | 长沙 | 中南林业科技大学 | 2007—2019(10) | 缺测 | 长沙(57679) | 28.20 | 113.07 |
| 34 | 温州 | 温州科技职业学院 | 1966—1974(9) | 缺测 | 温州(58659) | 27.98 | 120.63 |
| 35 | 贵阳 | 贵州大学 | 1963—2018(30) | 1963—2018(32) | 贵阳(57816) | 26.42 | 106.67 |
| 36 | 福州 | 福州农气试验站 | 2003—2018(10) | 缺测 | 福州(58847) | 26.08 | 119.33 |
| 37 | 桂林 | 桂林植物园 | 1964—2015(25) | 缺测 | 桂林(57957) | 25.18 | 110.20 |
| 38 | 昆明 | 昆明植物园 | 1963—2017(19) | 缺测 | 昆明(56778) | 25.04 | 102.73 |
| 39 | 厦门 | 厦门大学 | 1964—1988(8) | 缺测 | 厦门(59134) | 24.44 | 118.10 |
新窗口打开|下载CSV
图1
 新窗口打开|下载原图ZIP|生成PPT
图1两种木本植物物候观测站点分布
Fig. 1Distribution of the phenological observation sites for two woody plants
气象数据来源于中国气象数据网(data.cma.cn)。主要采用了中国地面气候资料日值数据集(V3.0),包括1962—2018年各物候观测站点最相邻气象站点逐日的平均气温、最高气温和最低气温数据。各物候站对应的气象站见表1。其中,西安、宝鸡、贵阳等气象站曾经迁址,因此使用迁站前后重复观测年份的气温数据对气温序列进行了均一化处理[27]。此外,通过最低、最高气温和正弦曲线模型可以模拟每日内的气温变化过程,从而生成逐小时的气温数据,用于后续积温需求的计算[28]。
2.2 研究方法
2.2.1 积温需求和冷激日数的计算方法 本文采用GDD(Growing Degree Days)、GDDS(Growing Degree Days-Sigmoid)和GDH(Growing Degree Hours)算法分别计算各物种在不同站点的积温需求。其中,GDD算法设定了一个下限温度阈值(Tb),当温度低于温度阈值时,植物的生长发育速率为0,无积温累积;但温度高于此阈值时,植物生长发育速率与温度呈线性正相关关系,积温可以表达为逐日温度超过阈值部分的累加和:式中:FGDD为积温需求,由于积温的算法是每日积温的累积量,需要乘以1 d,所以积温的单位是℃·d;t0为积温开始累积日期,设为1月1日;t1表示开花始期;x(t)为第t日的平均气温。根据以往研究,将阈值温度Tb设为5 ℃[24]。
GDDS算法假设植物生长发育速率与温度的关系呈“S”型曲线[29,30],公式表达为:
式中:FGDDS为积温需求,当第t日平均气温x(t)小于0 ℃时,当日累积的积温为0 ℃·d。
GDH算法假设植物生长发育存在上限温度阈值、下限温度阈值和最适温度[31]。当气温达到最适温度时,植物的生长发育速率最大。与前两种算法不同,GDH算法根据逐小时的气温计算积温,公式如下:
式中:FGDH为积温需求;GDH为生长度时;Th代表一日内第h小时的气温;Tc、TL和Tu分别为上限温度阈值、下限温度阈值和最适温度,分别设定为36 ℃、4 ℃和25 ℃。
冷激日数同样通过逐小时的气温数据进行计算。当小时温度低于阈值温度Tchill时计算为1个冷激时,将24 h冷激时的累加和除以24即为冷激日数,公式如下:
式中:FCDH为冷激日数;冷激的开始和结束日期tchill 0和tchill 1分别设定为前一年11月1日和2月29日(闰年)或3月1日[32],阈值温度Tchill设为5 ℃[24]。
本文首先利用各积温算法和冷激算法计算了所有站点和年份垂柳和榆树开花始期的积温需求和对应冷激日数。对于各站点,计算积温需求和冷激日数的多年平均值,用于空间上积温需求的分布格局及与冷激的关系分析。此外,对3个代表性站点,利用积温需求与年份间的回归分析,计算两种植物开花始期积温需求的变化趋势,并分析积温需求的年际变化及与冷激日数的关系。
2.2.2 积温需求与冷激日数的关系分析 已有研究发现积温需求随冷激日数的增加呈指数形式减少[24,25]。除北美云杉和桃外,欧洲的山毛榉(Fagus sylvatica)和无梗花栎(Quercus petraea)也呈现类似的规律[33]。因此,在空间维度上,本文用指数函数拟合积温需求与冷激日数的关系。但在时间维度上,由于同一站点多年间冷激日数的变化范围相对于站点间较小,用线性函数能更好的拟合积温需求与冷激日数的关系。最终,本文采用的积温需求与冷激日数的公式如下:
式中:Fki和Cki分别代表第i个物种在第k个站点的积温需求和冷激日数,在空间维度的分析中表示积温需求和冷激日数的多年平均值;ai、bi和ti是第i个物种空间维度上的参数;ci、di是第i个物种时间维度上的参数。这5个参数均通过最小二乘法来确定。
除了在空间或时间维度的分析,本文将所有站点和年份的积温需求和冷激日数作为时空耦合样本,利用公式(6)中的指数函数(空间维度)分别构建了垂柳和榆树基于3种积温算法的冷激日数—积温需求模型,并用模型拟合优度(R2)和均方根误差(RMSE)评估了模型效果。
3 结果与分析
3.1 积温需求的空间分布及与冷激的关系
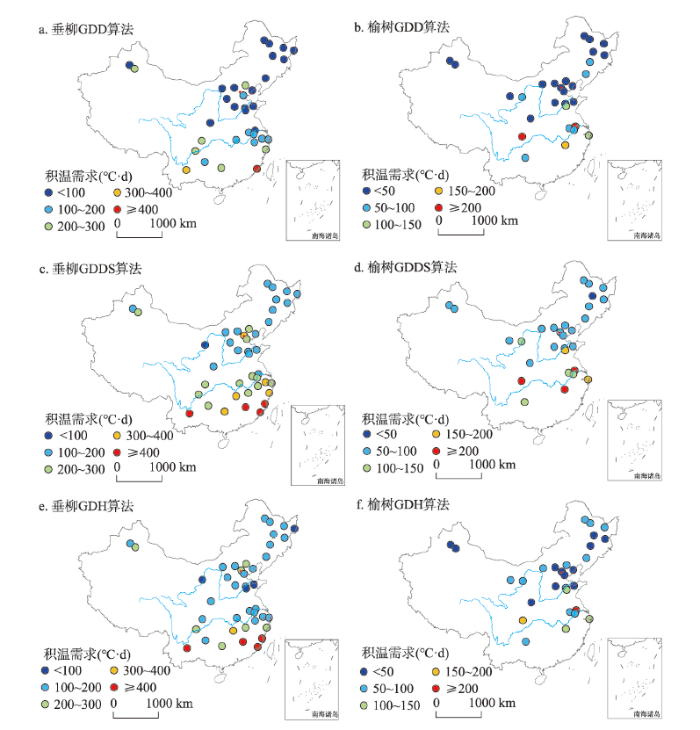
各站点垂柳和榆树开花始期的多年平均积温需求在空间上呈现从南往北逐渐降低的规律(图2)。在40 °N以北大部分站点,垂柳和榆树开花始期的积温需求在200 °C·d以下。在30 °N以南站点,垂柳开花始期的积温需求大多在200 °C·d以上,特别是在东南沿海的南昌、赣州、厦门等站点,积温需求超过400 °C·d。榆树开花始期的积温需求在30°N左右呈现明显的站点间差异,其中在南充相对较大,超过300 °C·d。对比不同算法可以发现,GDD算法计算的垂柳和榆树开花始期的积温需求整体相对偏小,而GDDS算法计算的积温需求大于其他两种模型。图2
 新窗口打开|下载原图ZIP|生成PPT
图21963—2018年各站点垂柳和榆树开花始期的平均积温需求
Fig. 2Thermal requirements for the first flowering dates of Salix babylonica and Ulmus pumila at each site averaged from 1963 to 2018
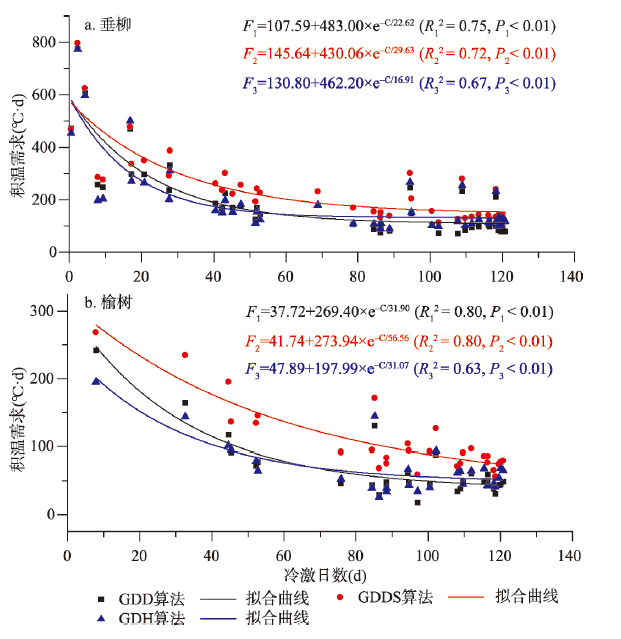
在空间上,垂柳和榆树开花始期的积温需求与冷激日数呈显著的指数函数关系(P <0.01),随着冷激日数的增加,两种植物开花的积温需求逐渐降低(图3)。当冷激日数达到40 d时,垂柳和榆树开花所需的积温需求仅为其冷激日数为10 d时的1/3~1/2。由指数函数的常数项可知,经过充分冷激后,垂柳和榆树仅分别需要不到150 °C·d和50 °C·d的积温就能够开花。就不同算法而言,指数函数对基于GDD和GDDS的开花积温需求与冷激日数关系的拟合效果最好,R2均达到0.7以上,而对基于GDH算法的模拟效果稍差,R2在0.6以上。
图3
 新窗口打开|下载原图ZIP|生成PPT
图3空间维度上垂柳和榆树开花始期积温需求与冷激日数的关系
Fig. 3Relationship between the thermal requirements and chilling days for the first flowering dates of Salix babylonica and Ulmus pumila across space
3.2 典型站点积温需求随时间的变化及与冷激的关系
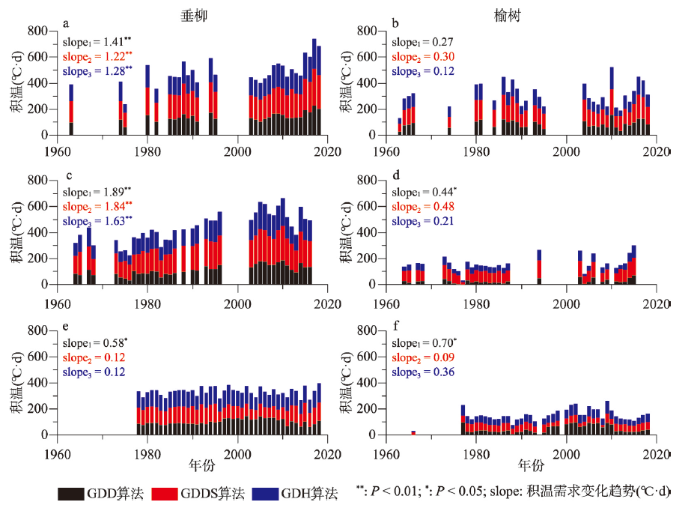
1963—2018年垂柳和榆树开花的积温需求在3个典型站点均呈增大趋势(图4)。垂柳开花积温需求在贵阳和西安的变化趋势分别达到1.28~1.41 °C·d/a(P < 0.01)和1.63~1.89 °C·d/a(P < 0.01),远大于其在牡丹江的变化趋势(0.12~0.58 °C·d/a)。榆树开花的积温需求变化相对较小,平均每年仅增加0.09~0.70 °C·d,但在贵阳和西安的趋势仍大于牡丹江。就年际波动来看,3种积温算法有较好的同步性。例如,贵阳垂柳开花始期积温需求均在1994年、2009年和2017年出现明显峰值,在1975年、2005年和2014年出现明显谷值。但值得注意的是不同站点开花始期积温需求的峰值和谷值出现年份存在差异。图4
 新窗口打开|下载原图ZIP|生成PPT
图41963—2018年垂柳和榆树开花始期积温需求在贵阳(a、b)、西安(c、d)和牡丹江(e、f)的年际变化
注:slope1、slope2和slope3分别为GDD、GDDS和GDH算法的积温需求变化趋势。
Fig. 4Interannual variation of thermal requirements for the first flowering dates of Salix babylonica and Ulmus pumila at Guiyang (a, b), Xi'an (c, d) and Mudanjiang (e, f) from 1963 to 2018
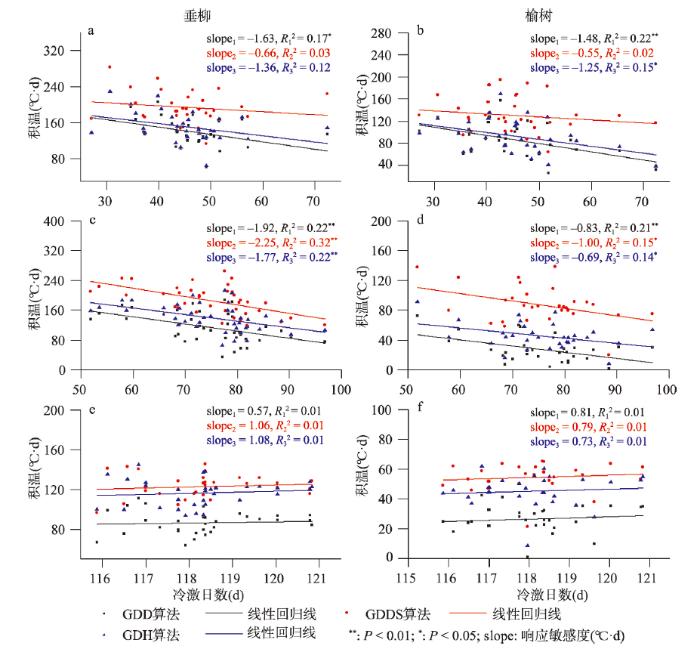
在时间维度上,垂柳和榆树开花始期的积温需求与冷激日数在部分站点存在明显相关关系(图5)。在贵阳和西安,二者主要表现为显著负相关(P < 0.01),即随着冷激日数增加,积温需求降低。平均冷激日数每增加1 d,垂柳开花始期的积温需求在贵阳和西安分别减少0.66~1.63 °C·d和1.77~2.25 °C·d。两站点榆树开花始期的积温需求对冷激日数的响应较弱,敏感度分别为-0.55~-1.48 °C·d/d和-0.83~-1.00 °C·d/d。在牡丹江,垂柳和榆树开花始期的积温需求与冷激日数的相关关系不显著,这可能与冷激日数的年际变化幅度有关。贵阳和西安冷激日数的变化幅度在40 d以上,而牡丹江由于气候寒冷,冷激日数的年际变化只有约5 d左右,因而无法对积温需求产生较大影响。
图5
 新窗口打开|下载原图ZIP|生成PPT
图5贵阳(a、b)、西安(c、d)和牡丹江(e、f)垂柳和榆树开花始期的积温需求与冷激日数的关系
注:slope1、slope2和slope3分别为GDD、GDDS和GDH算法的积温需求变化趋势。
Fig. 5Relationship between the thermal requirements and chilling days for the first flowering dates of Salix babylonica and Ulmus pumila in Guiyang (a, b), Xi'an (c, d) and Mudanjiang (e, f)
3.3 基于时空耦合样本的冷激日数—积温需求模型
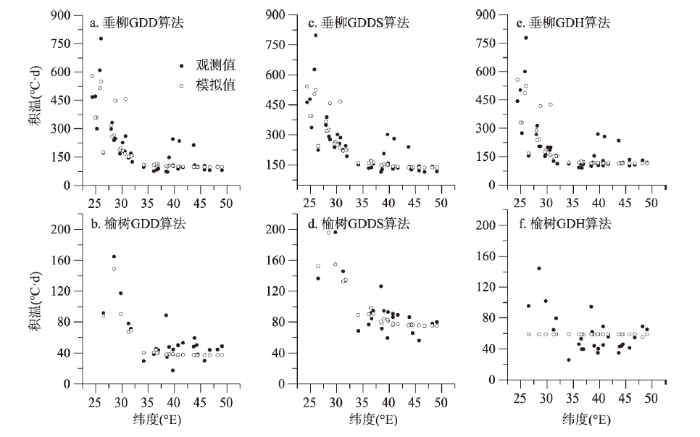
基于1963—2018年全部站点和年份的垂柳和榆树开花始期积温需求及对应冷激日数,建立了冷激日数—积温需求模型,公式如表2所示。总体而言,基于时空耦合样本建立的模型对垂柳开花积温需求的模拟效果较好,R2达到0.54~0.66。相比之下,建立的模型对榆树开花积温需求的模拟效果略差于垂柳,R2为0.33~0.64。对比不同积温需求算法可以发现,对于两种植物,冷激日数对GDD算法计算得到的积温需求的模拟效果最好,RMSE相对于其他两种算法更小。另外,对比积温需求观测值和模拟值发现(图6),在低纬度地区(低于35°N),各模型对垂柳和榆树开花的积温需求的模拟值通常略小于计算值。在35°N以北的中纬度地区,无论是观测值还是模拟值,开花的积温需求变异均小于低纬度地区。Tab. 2
表2
表2基于时空耦合样本的冷激日数—积温需求模型公式
Tab. 2
| 物种 | 积温需求算法 | 公式 | R2 | RMSE(°C·d) | P |
|---|---|---|---|---|---|
| 垂柳 | GDD | F=92.17+502.79×e-C/24.29 | 0.66 | 84.09 | < 0.01 |
| GDDS | F=122.47+428.79×e-C/34.99 | 0.60 | 85.09 | < 0.01 | |
| GDH | F=110.98+461.55×e-C/20.43 | 0.54 | 94.00 | < 0.01 | |
| 榆树 | GDD | F=36.30+774.01×e-C/15.89 | 0.64 | 29.75 | < 0.01 |
| GDDS | F=68.27+363.21×e-C/30.04 | 0.40 | 33.01 | < 0.01 | |
| GDH | F=29.82+132.32×e-C/47.74 | 0.33 | 32.32 | < 0.01 |
新窗口打开|下载CSV
图6
 新窗口打开|下载原图ZIP|生成PPT
图6基于冷激日数—积温需求模型的积温模拟值与观测值比较
Fig. 6Comparison between observed and simulated degree days based on chilling day-thermal requirement models
4 讨论
植物春季物候的积温需求具有显著的空间异质性[16]。本文研究结果表明垂柳开花始期在中国长江中下游地区的积温需求是东北地区的近4倍。榆树开花始期在低纬度站点的积温需求也明显大于中纬度站点。这与前人的研究结果相一致。例如,Fu等[34]发现北半球植被生长季开始期的积温需求具有显著的纬度差异性,在中纬度地区达500 °C·d,但在高纬度地区小于100 °C·d(0 ℃为阈值)。Bennie等[35]发现芬兰29个站点柔毛桦(Betula pubescens)从低纬度地区到高纬度地区发芽的积温需求逐渐降低。积温需求的种间差异主要由遗传基因控制。但对同一物种而言,积温需求的空间差异主要与植物在不同气候条件下的表型可塑性有关,但也无法排除本地适应性的影响[35]。1963—2018年冬季气温升高使植物在冬季经历的冷激日数减少。例如,本文中涉及的3个站点(贵阳、西安和牡丹江),冷激日数在1963—2018年间分别减少了8.79 d、23.40 d和1.72 d。由于冷激日数与积温需求呈负相关关系,因此冷激的减少是垂柳和榆树开花的积温需求呈增加趋势的主要原因。本文发现的积温需求增加与之前研究结果相一致。例如,Cong等[16]发现1998—2012年青藏高原春季植被生长季开始的积温需求在32°N以南地区主要呈现增加的趋势,且69%的地区增加趋势为0~5 °C·d/a。在欧洲也发现了类似现象,1980—2012年欧洲13种木本植物展叶始期的积温需求增加了近50%[17]。这种因低温导致积温需求减少从而促进芽开放的过程涉及到复杂的生理机制[36]。针对模式植物杨树(Populus tremula x tremuloides)的研究表明,在休眠期的低温处理会使转录因子SVL和它的下游基因TCP18的表达量降低,SVL的降低还会使休眠芽中赤霉素(GA)含量增加和乙烯(ABA)含量降低[37]。由于TCP18和ABA是杨树发芽的抑制因子,GA是杨树发芽的促进因子,因此冷激减少会减缓芽发育速率,延长杨树在之后温暖条件下的发芽时间[37],使积温需求增加。
从本文研究结果看,冷激日数的年际变化存在区域差异,使开花始期积温需求的变化趋势在不同站点存在较大差别。在低纬度地区,由于冬季气温较高,气候变化很容易使冷激日数发生较大变化(图5a和5c的横轴),且平均的冷激日数相对中纬度地区偏少,使得冷激与积温关系处在最开始影响较大的情形(例如图3中冷激日数小于40 d的部分)。因此,在低纬度地区,积温需求的增加幅度会更大。相比之下,中纬度地区冬季气温低,气候变暖不容易改变冷激日数(图5e),且在冷激—积温关系曲线中处于较为平缓的阶段。因此,中纬度地区植物开花的积温需求变化也相对较小。例如,垂柳开花始期的积温需求在贵阳的增加速率为每年增加1.28~1.41 °C·d(P < 0.01),而在牡丹江的变化趋势仅为0.12~0.58 °C·d/a。因此,积温需求随时间的变化不仅与气候变暖的程度有关,还有当地气候能提供的冷激量有关。
目前,国内外在植物春季物候预测中常用的模型,包括SW模型、DTS模型、UniChill模型、Unified模型等均未考虑植物在不同站点和年份间的积温需求变化,因此这些模型适用于冷激日数变化较小的中、高纬度站点或区域[38,39]。相比之下,Ge等[40]构建了时空耦合(TSC)模型,基于冬季平均温度分别计算植物在不同站点的积温需求。利用该模型模拟的桃(Amygdalus persica)、杏(Armeniaca vulgaris)、紫荆(Cercis chinensis)和紫丁香(Syringa oblata)在中国42个站点的开花始期和实际观测值的误差多为4~6 d [41],比其他模型在大尺度区域对植物春季物候的模拟误差小(7~9 d)[13,14]。这说明在预测多站点或较大尺度区域的春季物候时,考虑积温需求的空间差异可有效的提高模型精度。本文建立了垂柳、榆树开花始期积温需求和冷激日数的函数关系,可为大尺度春季物候模型的构建提供理论基础。
虽然本文证实了冷激日数对植物开花积温需求的影响,但我们注意到垂柳和榆树在部分站点和年份的冷激日数非常接近,开花的积温需求仍有差异。这说明除冷激外,植物春季物候的积温需求还受其他因素影响。有研究发现,积温需求与前一年冬季降水总量呈正相关关系,与太阳辐射总量呈负相关关系,但降水和光照可能只是通过影响植物表面温度间接影响积温需求[17]。此外,实验证明光周期对植物积温的累积有一定的补偿效应[20]。例如,Caffarra等[42]在欧洲的研究中指出,光周期对柔毛桦萌芽期的影响表现在两个方面。首先,光周期与温度相互作用,影响休眠诱导过程。其次,光周期在积温阶段改变积温速率,超过一定阈值的昼长将加快温度的积累。在今后的物候研究中,应定量化分析光周期对植物开花或展叶积温需求的影响。
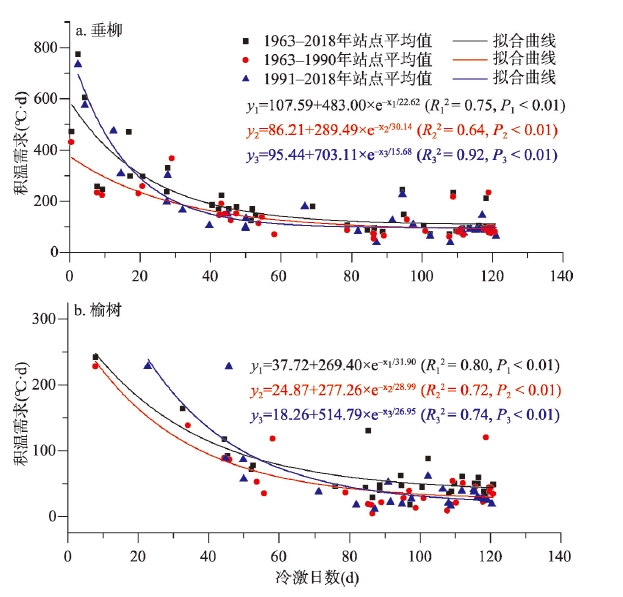
为了尽可能利用现有数据,本文利用时段内有观测数据的年份,计算了各站点积温需求的平均值。由于部分站点的观测数据主要分布在气候偏冷的前半段,因此可能影响整个积温需求空间分布结果。为评估这种不确定性,本文将数据分为1963—1990年和1991—2018年两个时段,将两时段的空间分布结果相对比(图7)。结果发现:各站点积温需求的空间格局在不同时段间相似,均呈从南往北逐渐降低的规律。主要差异在低纬度地区(冷激日数较少地区),后一时段的积温需求高于前一时段。另外,物候数据的不连续可能对积温需求的时间变化趋势估计产生一定的影响。贵阳和西安物候观测数据在1970年和2000年前后均有一定的缺失。在积温需求整体上升的情形下,前后的缺失在一定程度上弱化了增加趋势,从而使趋势估计结果偏低。因此,本文对积温需求变化趋势的大小估计存在一定的不确定性,但两站点积温需求的增加趋势是明显的。
图7
 新窗口打开|下载原图ZIP|生成PPT
图7不同时段开花始期积温需求(GDD算法)与冷激日数的关系
Fig. 7Relationship between thermal requirements (based on the GDD method) of the first flowering date and chilling days in different periods
5 结论
本文基于“中国物候观测网”1963—2018年垂柳和榆树在40余个站点的开花始期数据,利用3种积温算法,系统分析了两种植物开花始期积温需求的空间格局和年际变化,建立了积温需求与冷激日数的关系,主要结论有:(1)垂柳和榆树开花始期的积温需求存在明显的空间差异。积温需求(以5 ℃为阈值)在40°N以北大部分站点低于200 °C·d,在40°N以南多数站点超过200 °C·d。1963—2018年垂柳和榆树开花的积温需求在有长时间观测序列的3个站点均呈增大趋势,但只在贵阳和西安显著。其中,垂柳开花积温需求在贵阳、西安和牡丹江的变化趋势分别达到1.28~1.41 °C·d/a、1.63~1.89 °C·d/a和0.12~0.58 °C·d/a。榆树开花的积温需求平均每年增加0.09~0.70 °C·d。
(2)无论在时间维度还是空间维度,垂柳和榆树开花始期的积温需求与冷激呈显著负相关关系,即随着冷激日数的增加,积温需求逐渐降低。特别是在空间维度上,当冷激日数增加时,积温需求呈指数下降态势。贵阳和西安开花始期的积温需求增加主要与冷激日数的减少有关。在贵阳和西安,冷激日数平均每减少1 d,垂柳开花始期的积温需求分别增加0.66~1.63 °C·d和1.77~2.25 °C·d,榆树开花始期的积温需求分别增加0.55~1.48 °C·d和0.83~1.00 °C·d。由于牡丹江冷激日数较多(超过110 d)且年际变幅小(5 d左右),冷激日数变化对积温需求的影响较弱,因而积温需求呈现不显著的变化趋势。
(3)基于时空耦合样本建立的冷激日数—积温需求模型对垂柳开花积温需求的模拟效果较好,R2达到0.54~0.66。相比之下,模型对榆树开花积温需求的模拟效果略差于垂柳,R2为0.33~0.64。就不同积温算法而言,冷激日数对GDD算法计算得到的积温需求模拟效果最好,因此建议在春季物候模型中使用GDD算法计算植物的积温需求。
参考文献 原文顺序
文献年度倒序
文中引用次数倒序
被引期刊影响因子
DOI:10.1007/s00484-011-0426-5URLPMID:21509461 [本文引用: 1]

Mismatches in phenology between mutually dependent species, resulting from climate change, can have far-reaching consequences throughout an ecosystem at both higher and lower trophic levels. Rising temperatures, due to climate warming, have resulted in advances in development and changes in behaviour of many organisms around the world. However, not all species or phenophases are responding to this increase in temperature at the same rate, thus creating a disruption to previously synchronised interdependent key life-cycle stages. Mismatches have been reported between plants and pollinators, predators and prey, and pests and hosts. Here, we review mismatches between interdependent phenophases at different trophic levels resulting from climate change. We categorized the studies into (1) terrestrial (natural and agricultural) ecosystems, and (2) aquatic (freshwater and marine) ecosystems. As expected, we found reports of 'winners' and 'losers' in each system, such as earlier emergence of prey enabling partial avoidance of predators, potential reductions in crop yield if herbivore pests emerge before their predators and possible declines in marine biodiversity due to disruption in plankton-fish phenologies. Furthermore, in the marine environment rising temperatures have resulted in synchrony in a previously mismatched prey and predator system, resulting in an abrupt population decline in the prey species. The examples reviewed suggest that more research into the complex interactions between species in terrestrial and aquatic ecosystems is necessary to make conclusive predictions of how climate warming may impact the fragile balances within ecosystems in future.
[本文引用: 1]
[本文引用: 1]
[本文引用: 1]
[本文引用: 1]
[本文引用: 1]
URLPMID:28547481 [本文引用: 1]
[本文引用: 1]
[本文引用: 1]
[本文引用: 1]
[本文引用: 1]
[本文引用: 1]
[本文引用: 1]
[本文引用: 1]
[本文引用: 1]
[本文引用: 1]
[本文引用: 1]
[本文引用: 2]
URLPMID:16740492 [本文引用: 2]
[本文引用: 1]
[本文引用: 3]
[本文引用: 3]
URLPMID:28224350 [本文引用: 1]
DOI:10.1111/nph.15232URLPMID:29870050 [本文引用: 1]
Accurate predictions of spring plant phenology with climate change are critical for projections of growing seasons, plant communities and a number of ecosystem services, including carbon storage. Progress towards prediction, however, has been slow because the major cues known to drive phenology - temperature (including winter chilling and spring forcing) and photoperiod - generally covary in nature and may interact, making accurate predictions of plant responses to climate change complex and nonlinear. Alternatively, recent work suggests many species may be dominated by one cue, which would make predictions much simpler. Here, we manipulated all three cues across 28 woody species from two North American forests. All species responded to all cues examined. Chilling exerted a strong effect, especially on budburst (-15.8 d), with responses to forcing and photoperiod greatest for leafout (-19.1 and -11.2 d, respectively). Interactions between chilling and forcing suggest that each cue may compensate somewhat for the other. Cues varied across species, leading to staggered leafout within each community and supporting the idea that phenology is a critical aspect of species' temporal niches. Our results suggest that predicting the spring phenology of communities will be difficult, as all species we studied could have complex, nonlinear responses to future warming.
DOI:10.1111/gcb.12360URLPMID:24323535 [本文引用: 2]
It is well known that increased spring temperatures cause earlier onset dates of leaf unfolding and flowering. However, a temperature increase in winter may be associated with delayed development when species' chilling requirements are not fulfilled. Furthermore, photosensitivity is supposed to interfere with temperature triggers. To date, neither the relative importance nor possible interactions of these three factors have been elucidated. In this study, we present a multispecies climate chamber experiment to test the effects of chilling and photoperiod on the spring phenology of 36 woody species. Several hypotheses regarding their variation with species traits (successional strategy, floristic status, climate of their native range) were tested. Long photoperiods advanced budburst for one-third of the studied species, but magnitudes of these effects were generally minor. In contrast to prior hypotheses, photosensitive responses were not restricted to climax or oceanic species. Increased chilling length advanced budburst for almost all species; its effect greatly exceeding that of photoperiod. Moreover, we suggest that photosensitivity and chilling effects have to be rigorously disentangled, as the response to photoperiod was restricted to individuals that had not been fully chilled. The results indicate that temperature requirements and successional strategy are linked, with climax species having higher chilling and forcing requirements than pioneer species. Temperature requirements of invasive species closely matched those of native species, suggesting that high phenological concordance is a prerequisite for successful establishment. Lack of chilling not only led to a considerable delay in budburst but also caused substantial changes in the chronological order of species' budburst. The results reveal that increased winter temperatures might impact forest ecosystems more than formerly assumed. Species with lower chilling requirements, such as pioneer or invasive species, might profit from warming winters, if late spring frost events would in parallel occur earlier.
DOI:10.1111/gcb.14599URLPMID:30779408 [本文引用: 1]
Leaf phenology is one of the most reliable bioindicators of ongoing global warming in temperate and boreal zones because it is highly sensitive to temperature variation. A large number of studies have reported advanced spring leaf-out due to global warming, yet the temperature sensitivity of leaf-out has significantly decreased in temperate deciduous tree species over the past three decades. One of the possible mechanisms is that photoperiod is limiting further advance to protect the leaves against potential damaging frosts. However, the
DOI:10.1093/treephys/25.1.109URLPMID:15519992 [本文引用: 1]
DOI:10.1093/treephys/tpu038URLPMID:24876293 [本文引用: 1]
The timing of budburst of temperate trees is known to be controlled by complicated interactions of temperature and photoperiod. To improve the phenological models of budburst, better knowledge of the internal bud development preceding budburst in relation to environmental cues is needed. We studied the effect of accumulated chilling and forcing temperatures on the internal development of vegetative buds preceding budburst in Norway spruce [Picea abies (L.) Karst.]. Branches from 17-year-old trees of southern Finnish origin were transferred eight times at 1- to 2-week intervals from October to December 2007 from the field at Punkaharju (61 degrees 48'N, 29 degrees 20'E) to the greenhouse with forcing conditions (day length 12 h, +20 degrees C). After seven different durations of forcing, the developmental phase and primordial shoot growth of the buds were analysed at the stereomicroscopic level. Air temperature was recorded hourly throughout the study period. The accumulated chilling unit sum had a significant effect on the temperature sum that was required to attain a certain developmental phase; a higher amount of chilling required a lower amount of forcing. The variation in the rate of development of different buds within each sample branch in relation to the chilling unit and forcing temperature sum was low. Regarding primordial shoot growth, there was also an inverse relation between accumulated chilling and forcing, i.e., a higher accumulated chilling unit sum before forcing required a lower temperature sum to initiate primordial shoot growth and resulted in a stronger effect of accumulated forcing. A second-order regression model with an interaction of chilling and forcing explained the variation of primordial shoot growth with high precision (R(2) = 0.88). However, further studies are required to determine the final parameter values to be used in phenological modelling.
[本文引用: 4]
DOI:10.21273/HORTSCI.46.2.245URL [本文引用: 2]
[本文引用: 1]
[本文引用: 1]
[本文引用: 1]
[本文引用: 1]
DOI:10.1177/0143624407078642URL [本文引用: 1]
[本文引用: 1]
[本文引用: 1]
[本文引用: 1]
[本文引用: 1]
[本文引用: 1]
[本文引用: 1]
[本文引用: 2]
DOI:10.1098/rstb.2010.0128URLPMID:20819808 [本文引用: 1]
We are now reaching the stage at which specific genetic factors with known physiological effects can be tied directly and quantitatively to variation in phenology. With such a mechanistic understanding, scientists can better predict phenological responses to novel seasonal climates. Using the widespread model species Arabidopsis thaliana, we explore how variation in different genetic pathways can be linked to phenology and life-history variation across geographical regions and seasons. We show that the expression of phenological traits including flowering depends critically on the growth season, and we outline an integrated life-history approach to phenology in which the timing of later life-history events can be contingent on the environmental cues regulating earlier life stages. As flowering time in many plants is determined by the integration of multiple environmentally sensitive gene pathways, the novel combinations of important seasonal cues in projected future climates will alter how phenology responds to variation in the flowering time gene network with important consequences for plant life history. We discuss how phenology models in other systems--both natural and agricultural--could employ a similar framework to explore the potential contribution of genetic variation to the physiological integration of cues determining phenology.
URLPMID:30301891 [本文引用: 2]
[本文引用: 1]
[本文引用: 1]
[本文引用: 1]
DOI:10.1007/s00484-013-0671-xURLPMID:23689929 [本文引用: 1]
Recent shifts in phenology reflect the biological response to current climate change. Aiming to enhance our understanding of phenological responses to climate change, we developed, calibrated and validated spatio-temporal models of first leaf date (FLD) for 20 broadleaved deciduous plants in China. Using daily meteorological data from the Chinese Meteorological Administration and the Community Climate System Model, version 3 (CCSM3) created using three IPCC scenarios (A2, A1B and B1), we described the FLD time series of each species over the past 50 years, extrapolating from these results to simulate estimated FLD changes for each species during the twenty-first century. Model validation suggests that our spatio-temporal models can simulate FLD accurately with R(2) (explained variance) >0.60. Model simulations show that, from 1952 to 2007, the FLD in China advanced at a rate of -1.14 days decade(-)(1)) on average. Furthermore, changes in FLD showed noticeable variation between regions, with clearer advances observed in the north than in the south of the country. The model indicates that the advances in FLD observed from 1952-2007 in China will continue over the twenty-first century, although significant differences among species and different climate scenarios are expected. The average trend of FLD advance in China during the twenty-first century is modeled as being -1.92 days decade(-)(1) under the A2 scenario, -1.10 days decade(-)(1) under the A1B scenario and -0.74 days decade(-)(1) under the B2 scenario. The spatial pattern of FLD change for the period 2011-2099 is modeled as being similar but showing some difference from patterns in the 1952-2007 period. At the interspecific level, early-leafing species were found to show a greater advance in FLD, while species with larger distributions tended to show a weaker advance in FLD. These simulated changes in phenology may have significant implications for plant distribution as well as ecosystem structure and function.
[本文引用: 1]
[本文引用: 1]
[本文引用: 1]
