 ,1, 姚欣1, 龚咏喜2, 康朝贵3,4, 施迅5, 王法辉6, 王姣娥7, 张毅1, 赵鹏飞1, 朱递1, 朱欣焰8
Analytical methods and applications of spatial interactions in the era of big data
LIU Yu,1, YAO Xin1, GONG Yongxi2, KANG Chaogui3,4, SHI Xun5, WANG Fahui6, WANG Jiao'e7, ZHANG Yi1, ZHAO Pengfei1, ZHU Di1, ZHU Xinyan8收稿日期:2019-07-23修回日期:2020-04-14网络出版日期:2020-07-25
| 基金资助: |
Received:2019-07-23Revised:2020-04-14Online:2020-07-25
| Fund supported: |
作者简介 About authors
刘瑜(1971-), 男, 山东人, 教授, 中国地理学会会员(S110007302M), 主要研究方向为地理信息科学。E-mail:

摘要
关键词:
Abstract
Keywords:
PDF (1385KB)元数据多维度评价相关文章导出EndNote|Ris|Bibtex收藏本文
本文引用格式
刘瑜, 姚欣, 龚咏喜, 康朝贵, 施迅, 王法辉, 王姣娥, 张毅, 赵鹏飞, 朱递, 朱欣焰. 大数据时代的空间交互分析方法和应用再论. 地理学报[J], 2020, 75(7): 1523-1538 doi:10.11821/dlxb202007014
LIU Yu, YAO Xin, GONG Yongxi, KANG Chaogui, SHI Xun, WANG Fahui, WANG Jiao'e, ZHANG Yi, ZHAO Pengfei, ZHU Di, ZHU Xinyan.
1 空间交互
地理空间中不同位置的事物间存在不同强度的联系,并以物质、能量、信息等不同的形式进行移动和交换,这个过程被称为空间交互①(① 在人文地理学研究中,也被称为空间相互作用。)(Spatial Interaction)[1,2,3,4]。空间交互重点关注地理现象发生的起点(Origin)和终点(Destination)位置及其相互关系,因此在地理信息系统中通过OD数据或者流(Flow)数据表达。地理学有着悠久的空间交互研究传统,Ullman用“Geography as Spatial Interaction”的说法强调空间交互对于地理研究的重要意义,并归纳了影响空间交互产生的3个因素:互补性(Complementary)、介入机会(Intervening Opportunities)和可运输性(Transferability),作为构建模型所要考虑的基本要素[1]。Haggett借鉴物理学热传递的3种方式,把交互形式分为对流、传导和辐射3种类型[5];而对空间交互的定量研究[6,7,8],则更早于这些概念和理论的提出。考虑到大多数空间交互通过流的形式体现,因此本文行文中将“空间交互”和“流”交替使用。就空间数据结构而言,大多数传统空间数据可看作为“一阶量”,即抽象为映射 f: P→V,其中定义域P为地理单元集合,值域V为属性值(或向量)的集合,相应数据结构可组织为<x, s>,x表示地理单元的位置,s表示属性值。数据的空间复杂度是O(n),其中n为地理单元的数量,采用简单的关系数据表即可实现管理。然而空间交互数据是一类“二阶量”,可以抽象为映射f: P×P→V,具有3种表达方式。最常用的一种形式为<x1, x2, s>,其中x1和x2表示交互起点和终点位置,s表示交互强度,这种形式反映了空间交互作为OD数据的特点,能够最直接、精确地表达交互的空间分布[9,10]。第二种形式为<x, θ, d, s>,其中x为端点(起点或终点)的位置,θ表示交互的方向,d为交互的距离,s表示交互强度,反映了空间交互作为流数据的特点[11,12,13]。此外,Goodchild等提出的Geo-dipoles是对“二阶量”数据结构的泛化,其形式为<x1, x2, Z, z(x1, x2)>,其中Z可以是空间交互的属性如强度和时间间隔,z(x1, x2)表示对应的属性值[14]。显然,空间交互的空间复杂度为O(n2),即n个地理单元需要n×n的矩阵来存储交互数据,这一方面提升了数据管理的难度,另一方面也意味着较高空间分辨率的交互数据获取成本较高。因此,尽管地理****早就认识到了空间交互的意义,然而在数据和方法上仍对其缺乏有效的支持,目前主流地理信息系统软件很少提供空间交互分析功能。
地理大数据为量化空间交互提供了全新的感知手段[15],由于其独特的个体粒度、高时空分辨率等优势,能更好支持不同空间尺度的交互模式发现及其动态演化特征模拟和预测,服务于交通、公共卫生、旅游等领域,为空间交互研究带来了新机遇。本文试图梳理空间交互理论方法和应用研究,以期为大数据支持下的相关工作提供指导。
2 空间交互与地理空间格局
Hettner[16]认为地理学的主题是认识地理区域之间的相互差异及其空间上的关联[16],这其中暗含了空间交互与地理空间格局的耦合关系。与空间交互这种客观存在的“观测二阶量(Observed 2nd-order measures)”相比,距离、相似度等度量可以看作是不同类型的“可导出二阶量(Derivable 2nd-order measures)”,例如,空间自相关系数、地统计半变异函数等均是对一阶属性之间的依赖关系的一种二阶表达[17,18]。二阶效应是地理空间格局研究的关键,对应于地理现象的复杂内在特性,包括与位置相关的属性依赖、位置的局部结构化作用和空间异质性等空间作用[19],而不同类型的空间二阶量相互作用有助于理解地理空间。具体而言,以下4种空间效应与空间交互模式密切相关。(1)距离衰减(Distance Decay)。一般而言,两个区域空间距离越近,依赖关系越强,发生交互的可能性越高[20]。这种效应的出现有两个原因:一是交互成本与距离呈正相关,由于成本约束,长距离交互强度被削弱;另一个是介入机会,即对于长距离交互目的地,存在较多的潜在目的地可作为替代,降低其被选择的可能性。
(2)空间依赖(Spatial Dependence)和社区结构(Community Structure)。从空间一阶量的角度,地理格局表现为不同属性的空间分异,这正是空间交互形成的根本原因,地理单元间的位置关系及其属性的空间依赖共同决定了可观察到的空间交互模式[21,22]。由于空间交互刻画了地理单元之间的联系程度,联系相对紧密的单元形成社区,社区之间的联系则相对稀疏,从而形成具有特定结构和功能的组团格局[23,24]。
(3)尺度效应(Scale Effect)。在地理分析中,尺度是一个重要的影响因素。空间交互强度的度量需要基于面状单元进行聚合,其中的尺度问题尤其需要关注。一般来说,基本空间单元越大,聚合程度越高,反映的信息量越少;而若空间单元过小,则会遇到数据稀疏问题,难以发现有意义的模式[25]。
(4)地理空间复杂性(Geospatial Complexity)。一方面,空间交互是造成标度律(Scaling Law)的重要原因,Bettencourt指出城市内基础设施网络的发展使得人群之间更容易产生交互机会,而城市社会经济规模与这种交互机会数量是成比例的,这使得城市效益和人口规模之间存在着超线性关系[26]。另一方面,将地理单元和空间交互分别表达为节点和边,可形成具有复杂性(如无尺度和小世界特征)的网络,因此可以通过网络分析方法发现不同尺度的空间模式,进而揭示其背后的地理格局。
3 基于地理大数据感知空间交互
随着ICT技术的快速发展,个体在任意时间和地点的活动信息都能被记录并通过移动设备进行上传,从而产生大量具有时空标记的地理大数据。这为量化不同尺度的空间交互提供了可能,一方面解决了传统空间交互研究中数据不足的问题,为从宏观到微观、从群体到个体研究空间交互开创了新途径;另一方面使得基于大数据构建的空间交互网络具有动态性、多语义、细粒度等优势,可以帮助理解空间交互模式提取中的尺度影响。依据获取方式的差异,下面主要介绍4类可用于感知空间交互的地理大数据。(1)交通出行数据,主要包括出租车、网约车、公交、地铁、共享单车等[27,28,29,30,31,32,33]。得益于智能交通以及物联网的快速建设,各种车载定位设备、手机导航应用以及公交刷卡系统积累了海量的个体出行数据,如导航数据、打车订单数据和进出站/上下车刷卡数据,通常记录了上下车的位置或站点,可以建立其对应的出发地和目的地间的交互。这类数据通常是基于街道单元的,因此具有一定局限性。同时由于没有一种交通出行方式占绝对主导地位,单一类型的出行很难反映全局的空间交互模式。在城际尺度,航班、列车时刻表、货车轨迹等数据也为度量空间交互强度提供了支持手段。
(2)手机数据,包括被动式的信令数据和主动式的通信数据[34,35,36,37]。这两种数据均基于手机与基站的信号联系确定用户位置,前者根据用户在不同区域提供服务的基站不同,按一定时间间隔采样获取活动轨迹点,然后从轨迹中提取出停留点并匹配空间单元,两个连续停留点可作为交互的起止区域,体现了用户在区域间的流动;后者通常是基于通话发起者和接收者所处位置确定空间交互的起止区域,反映区域间的信息流动。由于手机普及率高,因此数据覆盖范围广,而且对于信令数据来说基站每时每刻都可以收集数据,时效性强;不足之处在于基站定位不够精确,如何有效地识别停留点也是一个问题。
(3)社交媒体数据[24, 38-40],人们利用社交媒体软件在不同位置上传具有时空标记的照片或文本进行签到的数据,为重现空间移动路径提供了可能。基于社交媒体数据,有以下4种方式度量空间交互强度:① 根据签到位置序列点,任意两个连续签到点反映了用户在区域间的移动,从而构建区域交互;② 用户在注册社交媒体软件时需要填入所在地,当其在不同地区进行签到时,便产生了从注册地到签到地的交互;③ 通过手机App请求定位权限获取用户的移动轨迹,进而提取用户位置变化数据,这种方式和手机信令数据类似,也是通过提取停留点实现的;④ 通过网络舆情在不同区域的传播构建信息流,即事件在某区域发生后,其他地区的网络用户评论、转发与该事件相关的信息,通过信息在不同区域的传播构建空间交互。社交媒体数据优势在于数据公开,容易获取,并且文本和图片丰富了语义信息,但显然其用户覆盖是有限的,并且用户对签到地的选择是有偏的,无法全面反映空间交互模式[41]。
(4)地名共现也可用于度量空间交互强度[42,43,44,45,46],即两个地名在网页(如新闻文章)中同时出现体现了它们之间的联系。例如“北京选派优秀教师赴内蒙古支教”反映了北京到内蒙古的人口流动,可以通过地理信息检索和文本处理技术获取不同地名的频数来表征地理单元交互联系的强度。
4 空间交互模型研究
空间交互模型试图为预测地理单元间交互强度构建数学表达,其中地理单元的属性以及地理单元间的距离是揭示空间交互强度的重要变量。4.1 基础空间交互模型
空间交互建模主要研究给定两个空间分析单元之间产生某种联系的形式化表达,建立交互强度Tij与起点Oi、终点Dj、交互成本cij三个基本要素之间的函数关系:常用的空间交互模型包括:重力模型(Gravity Model)[6]、介入机会模型(Intervening Opportunities Model)[8]、最大熵模型(Maximum Entropy Model)[47]和辐射模型(Radiation Model)[48]。它们虽然函数形式各不同相同,但是都具有一定的理论基础,在研究和实践中被广泛应用。
重力模型的思想来源于牛顿力学,其基本假设是“交互强度与起始点的规模成正比,与距离成反比”。因此,其函数形式可表示为:
式中:Pi和Pj为起点和终点的规模,通常可以用人口、经济规模表达;γ和δ为规模参数;cij表示在i和j之间移动产生的成本,通常可以用距离代替;f (cij)为衰减函数。此外,不少****将人工神经网络方法与重力模型结合对空间交互强度进行估计,取得了更好的估计效果[49,50,51]。Wilson采用熵最大化方法[47],得到空间交互模型的解析函数形式为:
式中:Oi和Dj为i和j的输出和输入量;Ai和Bj为归一化因子;μ为衰减系数。介入机会模型不直接考虑起始点间的交互成本,而是假设“交互强度与目的地可提供的机会数成正比,与起始点之间的介入机会数成反比”。因此,其函数形式可表示为:
式中:Vij为起始点(不包括Oi和Dj)之间的介入机会数。辐射模型的思想来源于粒子的物理运动,其基本假设是“给定源点需求,交互将指向供给大于该需求的目的地,且源点与该目的地之间具有最小的交互成本”,本质上与介入机会机制一致。
在大数据支持下,研究者针对不同类型的空间交互检验了重力模型、介入机会模型和辐射模型及其变种的适用性。其中一个研究重点是通过选取合理的规模和成本因素,比较不同模型的准确度[52]。大量实证结果表明空间交互模型的效果显著依赖分析的空间尺度[53]。在较大空间尺度下,一般认为辐射模型表现最优;而在小空间尺度下,介入机会模型表现较好。此外,由于辐射模型具有无参数特性,其通用性低于重力模型和介入机会模型,通常无法在不同的空间交互系统中取得较好的建模效果。因此,借鉴重力模型和介入机会模型的思想,引入规模效应、起始点限制和“竞争—介入”等机制,产生了不同的参数化辐射模型[54]。在实证研究过程中,通常需要通过拟合和评估不同的模型参数来选取最合适的空间交互模型。
4.2 基于空间交互模型的个体移动性建模
当空间交互采用人在地理空间中的移动度量时,可以基于微观层面的个体移动模型解释宏观的空间交互模式,例如用起止点之间的出行概率刻画两个地理单元之间的联系,进而结合经典的个体移动性模型模拟个体在空间中的移动过程[55]。因此,可以认为空间交互模型和个体移动性模型是“一枚硬币的两个面”,它们分别在宏观和微观层面刻画地理单元的联系特征[24]。从大数据中提取的海量个体移动轨迹,为验证个体移动性模型提供了数据支持。主流个体移动性模型包括随机游走模型、列维飞行模型[56]、偏好返回模型[57,58]和近因模型[59]。这些模型一般都依赖于移动步长分布、新颖探索、偏好依附和记忆效应等条件[60,61],模拟个体在均质空间环境下的移动轨迹。因缺乏对地理环境因素的考量,这些基础模型对非均质空间的个体移动性建模效果不佳。通过加入出行目的地选取机制,可以将空间异质性引入个体移动性模型之中,结合空间交互机制设定不同的距离衰减函数,选取合适的出行概率进行地点探索和往返移动,在地理空间中获得更好的个体移动建模效果[11]。
5 空间交互分析方法研究
5.1 空间交互聚类
空间交互本身数据结构的复杂性使得直接观察其分布特征较为困难,而聚类是对数据分布模式的一种概括,特别是对于空间交互大数据而言,有助于发现较强的区域联系和主要移动趋势。目前挖掘空间交互聚集模式主要有3类方法:① 通过定义统计指标判断空间交互分布是否呈现全局或者局部的聚集,属于空间统计方法,需要通过假设检验确定其统计显著性。例如,Berglund等将局部Getis-Ord Gi*统计量直接应用到流数据发现其聚集的热点区域[62];Lu等探讨了流数据OD点的聚类显著性水平和流聚集模式的关联性[63];Liu等扩展点的空间自相关指数到矢量数据,自相关指数高的地方,流数据更倾向于集聚[64];Tao等则是扩展局部K函数进行流聚集检测[65]。② 通过定义流的相似度(或相异度)并采用经典聚类框架发现流聚簇。通常OD点越接近的空间交互越相似,因此可利用OD点的欧氏距离[9, 65-66]或拓扑距离[10]来度量流的距离,此外也可根据流本身的空间关系进行定义[67]。③ 基于动态优化策略。Gao等将流作为四维空间中的点,利用空间扫描统计方法发现动态扫描窗口中的流数据是否存在显著聚集性,同样需要进行假设检验[68];Song等[69]以及Tao等[70]都基于区域相邻关系定义流的邻接性,并分别使用蚁群算法和扩展AMOEBA算法[71]识别OD均为不规则区域的流聚类。5.2 空间交互可视化
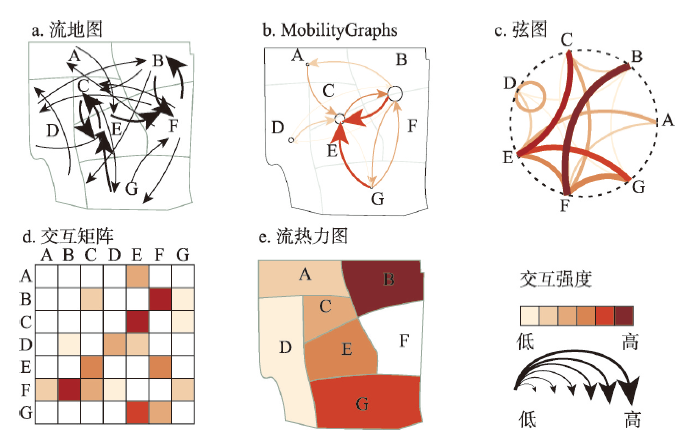
可视化以地图、图表等形式呈现空间交互数据,提供了重要的分析视角。对于具有高时空连续性的空间交互大数据而言,传统的可视化方法难以直接应用,因此相关优化方法和一些新的方法相继被提出。这些方法能够提取和表达空间交互数据的时空分布特征,同时空间交互大数据也能够支持在不同尺度和粒度下进行可视化以观察对应的分布模式。目前可视化方法主要有:① 基于流的方法。流地图[72]用一条有向线段表示空间交互,线段的属性如颜色、粗细表示交互强度[72](图1a)。这种方法能够直观的显示空间交互的分布,然而当数据量较大时,线段的交叉重叠使模式发现较为困难,而一些优化方法可以缓解这一问题,包括流抽样[10]、流分解[72,73]、地理单元合并[74,75]、空间布局优化[76,77,78,79]、符号设计优化[80,81]等。② 基于图的方法。MobilityGraphs[82](图1b)和弦图[83](图1c)分别为空间化和非空间化的方法,能够表现空间交互的网络结构特征,但也存在边交叉问题。③ 基于矩阵的方法。交互矩阵[84,85]将空间单元进行编码,用矩阵的第i行第j列的元素表示从区域i到区域j的交互强度,并可借助矩阵重排等技术突出交互模式(图1d)。Maptrix[86]则是将地图与交互矩阵结合,以解决交互矩阵无法反映空间位置的问题。基于矩阵的方法不会出现因边交叉产生的杂乱问题,然而当空间单元增多时,矩阵会变得庞大稀疏。④ 基于热力图的方法。流热力图[87]根据选定区域与其他区域的交互量对面状区域单元着色,如图1e所示。这种方法十分直观,然而一张图只能反映一个单元的交互分布。OD Map[88]可以认为是所有区域流热力图的组合,但是全局模式难以识别。⑤ 基于分区统计图的方法。Andrienko等[13]和Yao等[89]使用不同的数据聚合方式,设计了不同形式的统计图以展现区域在不同方向上的空间交互分布特征,能够发现区域空间交互模式差异。图1
 新窗口打开|下载原图ZIP|生成PPT
图15种空间交互可视化方法
注:b图中C和E、B和F间具有强交互关系而进行了合并;e图表示F与其他区域的交互。
Fig. 1Five visualization methods for spatial interactions
5.3 空间交互距离衰减效应量化
距离衰减是指空间交互的强度通常随着距离的递增而减弱[20, 90],该效应能够揭示空间交互作用机制。大数据样本量大的优势,有助于量化距离对不同尺度下、不同类型的空间交互强度的影响。已有研究表明,距离对城市间空间交互的影响比城市内的略小[11, 24, 35, 55, 91-92],对信息流等非空间移动形式表现的空间交互影响更不明显[42, 93]。在实际应用中,常通过模型拟合计算距离衰减系数来量化这种效应,主要包括以下两类方法。第一类是解析法。如果已知空间单元的吸引力,一种直接的方法是将重力模型等式进行对数变换后,将不同区域间的空间交互强度和距离代入得到散点图,通过线性拟合计算斜率作为距离衰减系数。线性法基于对数变换后的重力模型等式构建线性方程组,从而将问题转化为线性系统求解问题。在此基础上,线性规划[94]和线性回归[95]分别引入误差项和虚变量来进行优化求解;代数法则推导空间单元吸引力的解析解,通过与真实值进行比较确定最优距离衰减系数[91]。
第二类是模拟法。基于粒子群优化的逆重力模型拟合将空间单元的吸引力作为粒子,通过迭代优化,估计每个单元的吸引力以及最佳的距离衰减系数[92]。蒙特卡罗方法通过设置不同的距离衰减系数,基于重力模型计算区域间发生一次交互的概率,然后随机模拟生成大量交互,与真实交互模式进行对比,如果匹配程度高,说明该衰减系数设置较为合理,可以通过模拟个体行为来发现群体空间交互模式[11]。
5.4 基于空间交互的空间划分
空间划分是指将地理单元划分成特定的互不重叠的组团区域,同一区域内的地理单元具有位置和功能上的相似性或者互补性。Noronha等指出空间交互与功能区划分具有密切联系[96]。地理大数据的出现弥补了空间交互数据不足的问题,可以构建不同尺度下不同空间单元间的交互联系,从而提取不同层次下的空间划分结果,为全面研究区域空间结构提供了有力支撑。目前基于空间交互的空间划分研究主要聚焦于两个视角。一是聚合视角。首先确定基本空间单元,然后将这些单元不断合并,直到获得满足某种规则的分区。聚合规则的选取决定了空间划分的结果,主要包括:① 基于交互矩阵度量区域联系程度的聚类[97,98],这类方法或强调区域间交互的重要性,或侧重区域连通性和可达性;② 优化方法,例如,基于信息熵的方法认为一个理想的分区系统应当最大化区域间的熵,也即区域内的熵最小[99]。基于空间交互模型的方法则是以最小化分区后区域间交互量的模型估计值与真实值的偏差为目标[100]。此外,Kim等将空间分区转化成p功能区空间优化模型,使得每个功能区内空间单元到中心单元的交互量最大[101]。
二是空间交互网络视角。地理单元间的交互构成了嵌入空间的网络,可用社区发现算法[102]进行空间划分,揭示联系相对紧密的区域。在应用层面,很多研究基于不同类型地理大数据,揭示区域空间结构与层次关系,观察不同社区的空间交互特征,探究社区边界与区域边界的关系[23-24, 34, 103-104]。随着模块度方法的广泛使用,有不少****引入空间约束进行计算,以更好地发现空间组团结构[105,106]。此外,近年来利用矩阵分解技术进行地理社区发现也逐渐得到重视[32]。
5.5 其他分析方法
除了上述较为成体系的4类空间交互分析方法,还存在一些其他相关重要研究。在数据特征刻画方面,相关研究包括空间交互统计特征分析,如方向、距离、强度分布[12],以及网络特征分析,如度分布、集聚系数、中心性[107,108];在区域空间交互估计方面,Jang等根据面积比例关系、用地功能/土地覆盖类型、重力模型等对不同分区方式下的区域间流数据进行推算[109];Zhu等提出在一定约束条件下从连续空间分布快照推算区域间净流量的线性规划方法,探究了空间交互与空间分布的关系[110];在用地功能分类方面,考虑到空间单元属性与其空间交互模式紧密相关,Liu等在定义交互特征向量的基础上,使用期望最大化算法对城市用地类型进行推断,并在上海市出租车数据的应用中取得了较好的结果[31]。6 空间交互应用研究
6.1 空间规划与交通领域
各个尺度的空间规划和交通是空间交互的重要应用领域。海量人流、车流、物流、信息流等动态空间信息构建了地理空间单元之间的联系,使得城市、区域以及国家尺度的空间结构探知成为可能。在城市尺度,居民在城市中的时空行为体现了城市内部空间单元之间的交互,从而从动态角度弥补了传统城市空间结构研究中无法体现空间联系的不足。利用智能刷卡、出租车GPS轨迹等数据能够识别城市多中心结构,有效揭示城市整体与局部的空间结构演变规律[27, 111-113],分析城市职住空间分布格局[33, 114-115]。而在区域及更大尺度上,非交通数据如手机信令数据、社交媒体数据、互联网数据等应用较为广泛,如利用手机信令、豆瓣数据构建空间交互网络,剖析京津冀地区、长三角、珠三角等城市群组成结构及其形成机制[116]。在国家乃至全球尺度上,使用微博、微信、百度人口迁徙、Twitter等社交媒体数据构建复杂网络,进行区域划分,探究不同城市间的联系强度的差异[23-24, 117-119]。空间交互网络分析也成为识别和评价城市用地的新方法,如使用公交刷卡数据构建城市内部交互网络,区分城市用地类型和城市功能的动态使用情况[120],借助手机信令数据实现基于居民活动的城市各功能的空间划分[121,122]。基于地理大数据构建的空间交互网络,为交通研究提供了动态的、精细的空间组织依据,使得更深层次研究交通问题成为可能。在交通网络方面,运用大尺度的交通流数据,如航班时刻、铁路运营时刻表、航运物流等,重点分析全球或区域交互网络的复杂性、层级结构及组织模式[123,124,125,126]。在交通管理方面,可以集成多源大数据用于城市交通系统监测。基于车辆轨迹、地磁传感器数据、导航数据等,分析实时交通路况特征,预测其演化模式,进而诱导交通流量分流,缓解交通拥堵[127];另一方面,通过挖掘交通事故与交通流、环境因素的时空关联,实现对异常事件的感知、预测和处置,为交通事故的防控、应急和交通基础设施的优化提供方法与指导[128,129]。
6.2 公共卫生领域
6.2.1 空间交互与疾病传播 在各种疾病中,传染病与空间交互的关系最为明显。传染病的疫情过程表现为时空上的移动与扩散,而整个疫情的时空特点和个体之间传播的风险,均在很大程度上决定于病原体、宿主、被感染者的流动。传染病具有速度快、范围大、渠道多、突发性强、空间跳跃性强和随机性强等特点[130],从空间交互的角度对传染病的时空研究聚焦于其在不同地区(人群)之间或者不同地点(个体)之间的传播。为了有效控制疫情,模拟疫情在区域之间的传播尤为关键。例如,Wallace等提出了Patch-SIR模型将单个区域内部的传染过程推广到多区域尺度以揭示疫情传播与人口流动模式之间的关系,他们使用航班信息来估计区域间的人口迁移率,将模型应用于2009年春美国6个区域的甲型H1N1流感的爆发,并分析了模型参数的敏感性,对疫情预测具有重要参考价值[131]。在个体水平上,基于已有研究[132,133],Li等提出了疫情树林的概念框架模型,用来整合不同尺度不同来源的数据,对传染病疫情的时空动态进行刻画和分析,其关键在于对个体水平的传染关系进行准确判断,即判断究竟是哪个病例传染给了哪个病例[134]。针对2019年底在中国爆发的新型冠状病毒肺炎疫情,一些研究基于航空客流、百度和腾讯迁徙等数据估计了疾病传播的高风险区域[135],模拟了主要城市的传染病流行情况[136]。基于空间交互对传染病进行时空建模,掌握其时空传播规律,有助于进行疫情预测和制定相关防控政策。6.2.2 医疗设施布局分析 医疗资源空间布局的差异性是造成不同地区人们健康水平有别的重要原因之一。基于就医可达性评估,可以研究可达性的好坏是否会影响患者的健康水平,如晚期癌症的风险[137]或近期新型冠状病毒肺炎诊治的效果。另外对就医可达性科学精确地度量,还可以帮助缺医区的划分,对指导政府制定相关的补救措施、合理调配医疗资源具有重要的现实意义。如果评估发现了医疗资源配置的不合理、不均衡,则可以进一步研究如何采用各种优化手段,科学地调整和规划医疗设施的布局,提高医疗资源的使用效率,提倡医疗资源最大程度的均等共享[138]。
常见的空间交互在公共卫生资源管理中应用,还有医院服务区的界定。医院服务区是功能区的概念,比常用的行政单元更科学地刻画了医疗市场的有机联系。Jia等[139,140]以美国佛罗里达州2011年每个医院到每个邮码区的出院记录数量,测试并选取了拟合程度最高的距离衰减函数来取代传统Huff模型[141]中的幂函数,用改进的Huff模型来划分医院服务区。还有研究采用了社区发现算法划分医院服务区[142],划分的结果一方面可以用来作为评估医院服务质量及效率的研究单元,另一方面还可以为政府相关的医疗政策提供管理区参考。
6.3 旅游领域
大数据时代的到来使得获取海量精细尺度的、长时间跨度的游客行为数据成为可能,手机定位数据、旅行商数据、旅游网站评论数据、社交媒体、旅行博客数据丰富了研究的数据源[141]。目前,基于大数据的旅游流研究重点可概括为以下3点:① 通过不同类型地理大数据等提取旅游流,对其空间网络结构、分布模式、时空演化等特征进行分析。例如,Shao等利用从微博数据中提取的黄山市游客时空活动数据构建空间交互网络,进而通过社区发现算法对城市旅游区进行划分[144]。② 对旅游流进行估计和预测,包括空间交互模型[145]、统计回归[146]、深度学习[147]等方法。③ 研究旅游流与社会经济发展的相互影响。例如,Marrocu等分析了欧洲多个地区的旅游流对区域企业生产效率的影响,目的地企业可以利用作为外部消费者的游客偏好信息来提高经济效率[148];Yang等根据微博提取的中国343个城市间旅游流数据,建立重力模型分析航空和铁路交通对旅游流的影响[149]。7 讨论
大数据为空间交互研究带来了全新的机遇,相较于传统数据主要有以下3个方面的优势:① 数据量大,每条记录粒度小,可以提取不同空间尺度聚合所体现的空间模式,研究所提取模式和尺度之间的关系,有助于处理可变面积单元问题,也有助于选择合适的聚合尺度[150];② 多样化,人类活动目的的差异性是产生不同类型交互的直接原因,而空间单元作为人类活动的载体,其功能分异是形成不同类型交互的根本原因,类型丰富的空间交互大数据有助于构建多重交互网络,研究不同类型交互之间的相互影响[151]。③ 在时间上具有连续性,有助于研究空间交互网络的演化规律,并在此基础上进行交互动态乃至区域结构演化的预测。基于地理大数据开展空间交互研究时,也要注意其局限性:① 对数据进行时空切片后非常稀疏,这是其作为“二阶量”的特点导致的。例如,对于北京市五环内某一天的1亿条出行OD数据,将区域划分成30行×30列的网格,平均来说每一对网格单元间的有向交互量约为100000000/(900×899)≈123条。若进一步按小时划分,则每小时平均交互量仅为123/24≈5条。考虑到时空异质性导致数据分布不均匀,有相当多网格单元间的交互量很少甚至没有,为时空模式分析带来了困难。② 数据属性缺乏,除了起止坐标和时间属性,空间交互大数据其他属性信息的缺乏一定程度上限制了其在时空数据挖掘中的应用。③ 数据是有偏的。大数据并非“全数据”,只能片面地刻画空间交互特征。例如对于城市内出行,仅使用出租车、地铁等一种或两种数据就能“反映城市居民的空间移动模式”恐有以偏概全之嫌。有效解决以上问题的途径是集成多种空间交互网络展开研究,避免单一交互网络的代表性问题;或者将大数据进行分组(例如按照人群年龄、性别划分不同的出行数据),与普查、问卷访谈等小数据进行集成以丰富数据属性信息。
对于地理信息系统研究而言,目前相关软件针对一阶量的空间分析方法趋于完善,如聚类分析、插值分析、自相关分析、回归分析等,而对于空间交互这类二阶量的分析方法寥寥可数,这一方面在于二阶量数据结构的复杂性,导致分析建模较为困难;另一方面在于二阶量涉及两个空间对象,分布模式难以直接在地图上进行可视化和观察。在大数据时代,亟需实现分析方法“从一到二”的跨越,其中主要包含3个方向:① 将基于一阶量的分析方法拓展到二阶量,例如基于流数据的Geris-Ord Gi*统计量[62]、K函数[65]、自相关指数[64]等,这些方法的关键在于定义二阶量之间的空间关系。② 根据二阶量结构特点发展新的分析工具,揭示多重二阶量之间存在的相互影响关系及其时空效应。③ 引入其他领域的分析方法,如矩阵分析[32]、复杂网络方法[106]等,用于提取空间交互所反映的格局和过程。近年来,随着深度学习的发展,图卷积神经网络成为有效表征空间单元交互模式及其影响的工具[152],这有助于集成一阶量和二阶量,刻画地理空间分异格局。
8 总结
本文首先介绍了空间交互的内涵,从距离衰减、空间依赖和社区结构、尺度效应、地理空间复杂性4个方面揭示了空间交互与地理空间格局的关系,随后描述了利用多种地理大数据感知空间交互的方式,并且总结了常用的空间交互分析方法,介绍了其在不同领域的应用情况。总而言之,大数据支持下的空间交互研究具有以下几个特点:① 多尺度。由于数据在空间上具有连续性并且能够被聚合,可以在局部和宏观等不同空间尺度观察交互模式;② 动态性。空间交互的时态变化规律可被用来更准确的刻画人和地的特征,也为空间交互网络的演化和强度预测研究提供可能;③ 多领域应用。空间交互由于其类型多样,在多个领域中应用广泛,如空间规划、交通管理、疾病传播建模、旅游空间结构发现、基础设施评价等等。空间交互长期以来就是地理分析的核心概念,传统的空间交互研究由于缺少数据的支持,对于空间交互数据分布特征、演化过程研究不足,相关应用受到一定局限。由于位置感知技术的发展,海量具有时空标记的地理大数据的涌现,为感知空间交互提供了全新的手段,这种数据独有的微观个体粒度行为模式的刻画能力,为量化空间交互分布模式及动态演化,并揭示其与地理环境之间的相互作用,深入理解复杂地理格局和过程提供了可能性。因此需要根植于地理学的空间交互研究传统,抓住大数据带来的新机遇,引入机器学习、复杂性科学等领域的方法,开展更加全面的多源地理大数据支持下的空间交互新理论、新方法和应用研究。
致谢:
感谢东北大学修春亮教授在本文定稿过程中的讨论和有益的建议。参考文献 原文顺序
文献年度倒序
文中引用次数倒序
被引期刊影响因子
[本文引用: 2]
[本文引用: 1]
[本文引用: 1]
[本文引用: 1]
[本文引用: 1]
[本文引用: 2]
[本文引用: 1]
[本文引用: 2]
[本文引用: 2]
[本文引用: 3]
[本文引用: 4]
[本文引用: 2]
URLPMID:27740487 [本文引用: 2]
[本文引用: 1]
[本文引用: 1]
[本文引用: 2]
[本文引用: 1]
[本文引用: 1]
[本文引用: 1]
[本文引用: 2]
[本文引用: 1]
[本文引用: 1]
[本文引用: 3]
URLPMID:24465849 [本文引用: 6]
[本文引用: 1]
[本文引用: 1]
[本文引用: 2]
[本文引用: 2]
[本文引用: 1]
[本文引用: 1]
[本文引用: 1]
[本文引用: 2]
[本文引用: 3]
[本文引用: 2]
[本文引用: 2]
[本文引用: 2]
[本文引用: 1]
[本文引用: 1]
[本文引用: 1]
URLPMID:22666339 [本文引用: 1]
[本文引用: 1]
[本文引用: 1]
[本文引用: 2]
DOI:10.1080/13658816.2015.1034721URL [本文引用: 1]
DOI:10.1080/13658816.2017.1367797URL [本文引用: 1]
[本文引用: 1]
[本文引用: 1]
[本文引用: 2]
URLPMID:22367540 [本文引用: 1]
[本文引用: 1]
[本文引用: 1]
[本文引用: 1]
[本文引用: 1]
[本文引用: 1]
URLPMID:26600153 [本文引用: 1]
[本文引用: 2]
[本文引用: 1]
DOI:10.1038/ncomms9166URLPMID:26349016 [本文引用: 1]

The availability of massive digital traces of human whereabouts has offered a series of novel insights on the quantitative patterns characterizing human mobility. In particular, numerous recent studies have lead to an unexpected consensus: the considerable variability in the characteristic travelled distance of individuals coexists with a high degree of predictability of their future locations. Here we shed light on this surprising coexistence by systematically investigating the impact of recurrent mobility on the characteristic distance travelled by individuals. Using both mobile phone and GPS data, we discover the existence of two distinct classes of individuals: returners and explorers. As existing models of human mobility cannot explain the existence of these two classes, we develop more realistic models able to capture the empirical findings. Finally, we show that returners and explorers play a distinct quantifiable role in spreading phenomena and that a correlation exists between their mobility patterns and social interactions.
[本文引用: 1]
[本文引用: 1]
DOI:10.1038/nature06958URLPMID:18528393 [本文引用: 1]
Despite their importance for urban planning, traffic forecasting and the spread of biological and mobile viruses, our understanding of the basic laws governing human motion remains limited owing to the lack of tools to monitor the time-resolved location of individuals. Here we study the trajectory of 100,000 anonymized mobile phone users whose position is tracked for a six-month period. We find that, in contrast with the random trajectories predicted by the prevailing Levy flight and random walk models, human trajectories show a high degree of temporal and spatial regularity, each individual being characterized by a time-independent characteristic travel distance and a significant probability to return to a few highly frequented locations. After correcting for differences in travel distances and the inherent anisotropy of each trajectory, the individual travel patterns collapse into a single spatial probability distribution, indicating that, despite the diversity of their travel history, humans follow simple reproducible patterns. This inherent similarity in travel patterns could impact all phenomena driven by human mobility, from epidemic prevention to emergency response, urban planning and agent-based modelling.
DOI:10.1038/s41467-017-01892-8URLPMID:29158475 [本文引用: 1]
Studies of human mobility in the past decade revealed a number of general scaling laws. However, to reproduce the scaling behaviors quantitatively at both the individual and population levels simultaneously remains to be an outstanding problem. Moreover, recent evidence suggests that spatial scales have a significant effect on human mobility, raising the need for formulating a universal model suited for human mobility at different levels and spatial scales. Here we develop a general model by combining memory effect and population-induced competition to enable accurate prediction of human mobility based on population distribution only. A variety of individual and collective mobility patterns such as scaling behaviors and trajectory motifs are accurately predicted for different countries and cities of diverse spatial scales. Our model establishes a universal underlying mechanism capable of explaining a variety of human mobility behaviors, and has significant applications for understanding many dynamical processes associated with human mobility.
[本文引用: 2]
[本文引用: 1]
[本文引用: 2]
[本文引用: 3]
[本文引用: 1]
[本文引用: 1]
[本文引用: 1]
[本文引用: 1]
[本文引用: 1]
[本文引用: 1]
[本文引用: 3]
[本文引用: 1]
URLPMID:21149876 [本文引用: 1]
DOI:10.1109/TVCG.2009.143URLPMID:19834170 [本文引用: 1]
Spatial interactions (or flows), such as population migration and disease spread, naturally form a weighted location-to-location network (graph). Such geographically embedded networks (graphs) are usually very large. For example, the county-to-county migration data in the U.S. has thousands of counties and about a million migration paths. Moreover, many variables are associated with each flow, such as the number of migrants for different age groups, income levels, and occupations. It is a challenging task to visualize such data and discover network structures, multivariate relations, and their geographic patterns simultaneously. This paper addresses these challenges by developing an integrated interactive visualization framework that consists three coupled components: (1) a spatially constrained graph partitioning method that can construct a hierarchy of geographical regions (communities), where there are more flows or connections within regions than across regions; (2) a multivariate clustering and visualization method to detect and present multivariate patterns in the aggregated region-to-region flows; and (3) a highly interactive flow mapping component to map both flow and multivariate patterns in the geographic space, at different hierarchical levels. The proposed approach can process relatively large data sets and effectively discover and visualize major flow structures and multivariate relations at the same time. User interactions are supported to facilitate the understanding of both an overview and detailed patterns.
DOI:10.1109/TVCG.2008.135URLPMID:18988974 [本文引用: 1]
Graphs have been widely used to model relationships among data. For large graphs, excessive edge crossings make the display visually cluttered and thus difficult to explore. In this paper, we propose a novel geometry-based edge-clustering framework that can group edges into bundles to reduce the overall edge crossings. Our method uses a control mesh to guide the edge-clustering process; edge bundles can be formed by forcing all edges to pass through some control points on the mesh. The control mesh can be generated at different levels of detail either manually or automatically based on underlying graph patterns. Users can further interact with the edge-clustering results through several advanced visualization techniques such as color and opacity enhancement. Compared with other edge-clustering methods, our approach is intuitive, flexible, and efficient. The experiments on some large graphs demonstrate the effectiveness of our method.
DOI:10.1111/cgf.2009.28.issue-3URL [本文引用: 1]
URL [本文引用: 1]
Flow maps are thematic maps that visualize the movement of objects, such as people or goods, between geographic regions. One or more sources are connected to several targets by lines whose thickness corresponds to the amount of flow between a source and a target. Good flow maps reduce visual clutter by merging (bundling) lines smoothly and by avoiding self-intersections. Most flow maps are still drawn by hand and only few automated methods exist. Some of the known algorithms do not support edge-bundling and those that do, cannot guarantee crossing-free flows. We present a new algorithmic method that uses edge-bundling and computes crossing-free flows of high visual quality. Our method is based on so-called spiral trees, a novel type of Steiner tree which uses logarithmic spirals. Spiral trees naturally induce a clustering on the targets and smoothly bundle lines. Our flows can also avoid obstacles, such as map features, region outlines, or even the targets. We demonstrate our approach with extensive experiments.
DOI:10.1080/13658816.2017.1307378URL [本文引用: 1]
DOI:10.1177/1473871616681375URL [本文引用: 1]
DOI:10.1080/15230406.2016.1262280URL [本文引用: 1]
DOI:10.1109/TVCG.2015.2468111URLPMID:26529684 [本文引用: 1]
Learning more about people mobility is an important task for official decision makers and urban planners. Mobility data sets characterize the variation of the presence of people in different places over time as well as movements (or flows) of people between the places. The analysis of mobility data is challenging due to the need to analyze and compare spatial situations (i.e., presence and flows of people at certain time moments) and to gain an understanding of the spatio-temporal changes (variations of situations over time). Traditional flow visualizations usually fail due to massive clutter. Modern approaches offer limited support for investigating the complex variation of the movements over longer time periods.
DOI:10.1126/science.1248676URLPMID:24675962 [本文引用: 1]
Widely available data on the number of people living outside of their country of birth do not adequately capture contemporary intensities and patterns of global migration flows. We present data on bilateral flows between 196 countries from 1990 through 2010 that provide a comprehensive view of international migration flows. Our data suggest a stable intensity of global 5-year migration flows at ~0.6% of world population since 1995. In addition, the results aid the interpretation of trends and patterns of migration flows to and from individual countries by placing them in a regional or global context. We estimate the largest movements to occur between South and West Asia, from Latin to North America, and within Africa.
DOI:10.1111/pirs.1977.38.issue-1URL [本文引用: 1]
DOI:10.1080/13658810701349037URL [本文引用: 1]
DOI:10.1109/TVCG.2016.2598885URLPMID:27875157 [本文引用: 1]
Showing flows of people and resources between multiple geographic locations is a challenging visualisation problem. We conducted two quantitative user studies to evaluate different visual representations for such dense many-to-many flows. In our first study we compared a bundled node-link flow map representation and OD Maps [37] with a new visualisation we call MapTrix. Like OD Maps, MapTrix overcomes the clutter associated with a traditional flow map while providing geographic embedding that is missing in standard OD matrix representations. We found that OD Maps and MapTrix had similar performance while bundled node-link flow map representations did not scale at all well. Our second study compared participant performance with OD Maps and MapTrix on larger data sets. Again performance was remarkably similar.
DOI:10.3390/ijgi6020038URL [本文引用: 1]
DOI:10.1179/000870410X12658023467367URL [本文引用: 1]
DOI:10.1007/s12650-018-00543-4URL [本文引用: 1]
[本文引用: 1]
DOI:10.1016/j.jtrangeo.2003.12.006URL [本文引用: 2]
AbstractEndogenous nodal attractions are estimated using the general unconstrained gravity model for a 25-node US airline passenger database with known exogenous spatial interaction and impedance. A simplified algebraic method (SAM) is developed to derive satisfactory estimates for all nodal attractions and inter-nodal interactions with only a very small subset of the exogenous database. This method can be used for large-scale spatial interaction analyses in which obtaining a complete inter-nodal interaction matrix is impossible or a reduction of computation is necessary.]]>
DOI:10.1080/00330124.2012.679445URL [本文引用: 2]
DOI:10.1080/13658816.2012.689838URL [本文引用: 1]
DOI:10.1111/gean.1995.27.issue-4URL [本文引用: 1]
[本文引用: 1]
DOI:10.1111/j.1467-8306.1992.tb01899.xURL [本文引用: 1]
DOI:10.1111/jors.1971.11.issue-1URL [本文引用: 1]
DOI:10.1068/a070509URL [本文引用: 1]
[本文引用: 1]
DOI:10.1068/a090169URL [本文引用: 1]
DOI:10.1080/13658816.2015.1031671URL [本文引用: 1]
DOI:10.1016/j.physrep.2009.11.002URL [本文引用: 1]
DOI:10.1371/journal.pone.0015422URLPMID:21124970 [本文引用: 1]
Territorial subdivisions and geographic borders are essential for understanding phenomena in sociology, political science, history, and economics. They influence the interregional flow of information and cross-border trade and affect the diffusion of innovation and technology. However, it is unclear if existing administrative subdivisions that typically evolved decades ago still reflect the most plausible organizational structure of today. The complexity of modern human communication, the ease of long-distance movement, and increased interaction across political borders complicate the operational definition and assessment of geographic borders that optimally reflect the multi-scale nature of today's human connectivity patterns. What border structures emerge directly from the interplay of scales in human interactions is an open question. Based on a massive proxy dataset, we analyze a multi-scale human mobility network and compute effective geographic borders inherent to human mobility patterns in the United States. We propose two computational techniques for extracting these borders and for quantifying their strength. We find that effective borders only partially overlap with existing administrative borders, and show that some of the strongest mobility borders exist in unexpected regions. We show that the observed structures cannot be generated by gravity models for human traffic. Finally, we introduce the concept of link significance that clarifies the observed structure of effective borders. Our approach represents a novel type of quantitative, comparative analysis framework for spatially embedded multi-scale interaction networks in general and may yield important insight into a multitude of spatiotemporal phenomena generated by human activity.
DOI:10.1016/j.jtrangeo.2015.01.016URL [本文引用: 1]
[本文引用: 1]
DOI:10.1080/13658816.2014.999244URL [本文引用: 2]
DOI:10.1016/j.jtrangeo.2011.12.002URL [本文引用: 1]
Aviation systems are less geographically constrained compared to ground transportation because their routes are not so affected by geographical conditions. For this reason, aviation systems are endowed to some extent with a distinctive network topology and spatial pattern. In this article, the statistical features of China's aviation system (CAS) are investigated through a complex network approach by examining weekly flight patterns. The correlation study proves the existence of a spatial hierarchical structure within China's aviation network, which implies a more complex spatial mechanism. Subsequently the spatial structure of CAS is explored based on the flight distances between airport cities. In light of three measurements of node strength, population and GDP, It has been decided that the spatial effect of China's aviation system should be analyzed separately in term of different distance scales. Only for medium- and long-distance travel, the flight patterns conform to a gravitation law: therefore, the distance dependence function can be generalized as a scaling relationship. In summary, from a complex network angle, this paper provides preliminary but enlightening insights to understanding the unique spatial mechanism of aviation systems. (C) 2011 Elsevier Ltd.
DOI:10.11821/dlxb201412009URL [本文引用: 1]
As a new mode of transportation, the rapid development of high-speed rail (HSR) will bring a leap in the history of transportation and have a comprehensive impact on the regional structure, population mobility, geographical division of labors, regional linkages, land use, and so on. Therefore, it is significantly important to study the impacts of HSR on regional spatial interactions, especially under the background of regional economic integration. The paper researches the impact of high speed rail on the reconstruction of spatial economic linkages. Based on the GIS network analysis tools, this paper first calculates the time cost matrix of 333 prefecture-level administrative units and four municipalities, and then uses the gravity model to calculate the interurban economic linkages, and lastly analyzes the distribution of the total economic linkage and the economic linkages between any two cities. In order to analyze the impact of HSR on regional spatial interaction, this paper resumes three scenarios: the current transport network in 2012 without the HSR network (scenario 1), the current transport network in 2012 (scenario 3), and the planning HSR network in 2020 (scenario 3) based on the current transport network, to calculate the time cost matrix of 337 cities. Results indicate that: (1) Cities in the east have the highest economic linkages, and cities with the highest increase of economic linkages are located along the HSR lines, which will lead to regional restructuring; (2) The development of HSR lines will improve the economic linkages between cities, and the increasing rate during the first period (comparing scenario 2 with scenario 1) is much higher than that during the second period (comparing scenario 3 with scenario 2); (3) From different perspectives and regional scales, the development of HSR has different impacts on spatial difference; (4) It is possible for cities in a long distance to have high economic linkages with the construction of HSR lines, which could also change the linkage directions.
[本文引用: 1]
DOI:10.1111/tgis.2011.15.issue-4URL [本文引用: 1]
DOI:10.1080/13658816.2017.1413192URL [本文引用: 1]
DOI:10.1371/journal.pone.0015923URLPMID:21249210 [本文引用: 1]
The spatial arrangement of urban hubs and centers and how individuals interact with these centers is a crucial problem with many applications ranging from urban planning to epidemiology. We utilize here in an unprecedented manner the large scale, real-time 'Oyster' card database of individual person movements in the London subway to reveal the structure and organization of the city. We show that patterns of intraurban movement are strongly heterogeneous in terms of volume, but not in terms of distance travelled, and that there is a polycentric structure composed of large flows organized around a limited number of activity centers. For smaller flows, the pattern of connections becomes richer and more complex and is not strictly hierarchical since it mixes different levels consisting of different orders of magnitude. This new understanding can shed light on the impact of new urban projects on the evolution of the polycentric configuration of a city and the dense structure of its centers and it provides an initial approach to modeling flows in an urban system.
DOI:10.1177/0042098015601599URL
DOI:10.1080/13658816.2014.914521URL [本文引用: 1]
In essence, we first construct a weighted directed graph from these travel records. Each node in the graph denotes an urban area, edges denote the possibility of travel between any two areas, and the weight of edges denotes the volume of travel, which is the number of trips made. We then make use of (a) the graph properties to obtain an overall view of travel demand, (b) graph centralities for detecting urban centers and hubs, and (c) graph community structures for uncovering socioeconomic clusters defined as neighborhoods and their borders. Finally, results of this network analysis are projected back onto geographical space to reveal the spatial structure of urban movements. The revealed community structure shows a clear subdivision into different areas that separate the population's activity space into smaller neighborhoods. The generated borders are different from existing administrative ones. By comparing the results from 3years of data, we find that Singapore, even from such a short time series, is developing rapidly towards a polycentric urban form, where new subcenters and communities are emerging largely in line with the city's master plan.To summarize, our approach yields important insights into urban phenomena generated by human movements. It represents a quantitative approach to urban analysis, which explicitly identifies ongoing urban transformations.]]>
DOI:10.1016/j.cities.2018.11.021URL [本文引用: 1]
DOI:10.18306/dlkxjz.2018.03.010URL [本文引用: 1]
Urban railway systems can reduce environmental footprints by residents' commuting and alleviate traffic congestion in mega-cities. Investigating the characteristics of the spatiotemporal distribution of passenger flows is significant in the examination of traffic demand in public transportation systems. Moreover, the study can help decision makers in traffic demand management. Taking the metro system of Beijing as an example, this study calculated the travel time of over 4 million trips and their origin-destination (OD) matrix. In the investigation of the spatiotemporal patterns, we found that: (1) travel time distribution of all trips and trips during the morning and afternoon peaks well fit with Gamma distribution; (2) patterns of passenger flows between districts or ring roads are symmetric; and (3) spatial inequity has been captured from the evaluation of average transit trips per person per day.
[本文引用: 1]
[本文引用: 1]
[本文引用: 1]
DOI:10.11821/xb201208003URL [本文引用: 1]
The change of urban regional spatial structure influenced by information technology has become a hotspot of research at home and abroad. This study tries to analyze China's city network characteristics from the social network space perspective by using Sina microblog as an example. The result shows that China's city network based on the micro-blog social space has a clear hierarchical structure and level distinction. Firstly, the result shows the existence of regional characteristics, performance as a visible regional development pattern which contains "Three Main-regions and Four Sub-regions" according to the analysis of the level distinction in the city network and the connection rate between cities. Specifically speaking, the three main regions contain the Beijing-Tianjin-Hebei region represented by Beijing, Pearl River Delta region represented by Guangzhou and Shenzhen, and the Yangtze River Delta region represented by Shanghai, Hangzhou and Nanjing. The four sub-regions contain Chengdu-Chongqing region, west coast of the Taiwan Straits region represented by Fuzhou and Xiamen, Wuhan region represented by Wuhan and Changsha, Northeast China represented by Shenyang, Harbin and Changchun. Secondly, the result shows there is a significant difference of the network links among Eastern, Central and Western China. Links within Eastern China and the links between Eastern, Central and Western China constitute almost all of the current network systems. It is also found that the high-level cities have an absolute dominance in the city network pattern, and that Beijing is the contact center in China's city network, with an overwhelming advantage. Shanghai, Guangzhou and Shenzhen are the sub-contact centers in the China's city nework.
[本文引用: 1]
DOI:10.1080/15230406.2014.890072URL
Pervasive presence of location-sharing services made it possible for researchers to gain an unprecedented access to the direct records of human activity in space and time. This article analyses geo-located Twitter messages in order to uncover global patterns of human mobility. Based on a dataset of almost a billion tweets recorded in 2012, we estimate the volume of international travelers by country of residence. Mobility profiles of different nations were examined based on such characteristics as mobility rate, radius of gyration, diversity of destinations, and inflow-outflow balance. Temporal patterns disclose the universally valid seasons of increased international mobility and the particular character of international travels of different nations. Our analysis of the community structure of the Twitter mobility network reveals spatially cohesive regions that follow the regional division of the world. We validate our result using global tourism statistics and mobility models provided by other authors and argue that Twitter is exceptionally useful for understanding and quantifying global mobility patterns.
DOI:10.13249/j.cnki.sgs.2016.11.007URL [本文引用: 1]
The space of flows theory proposed by Manuel Castells has given birth to the network perspective of city network. In contrast with the traditional perspective of urban system which is based on the central place theory, city network perspective pays more attention to the interactions and linkages between cities and regions. Thus, the city network is becoming one of the new and hot topics in the field of urban geography. “Chunyun” is a well-known socio-economic phenomenon unique to transitional China, which refers to a blooming of population flows during the Spring Festival, or refers to the period when the blooming happens. Previously, the real population flows data in “Chunyun” were difficult to obtain. The situation had not changed until the “Big data on human migration during the spring festival from Baidu map” (“Baidu migration data” in short) came up. The big data were gathered from the locations provided by hundreds of millions smart phone users through Location Based Service (LBS) Baidu map data source, and was published in the form of interactive heat map that displays people’s travel routes in China during the Chunyun period. Based on Baidu migration data, using degree of external linkages, dominant flows and network-based rank-size analysis, the spatial pattern of city network in transitional China was studied in this article. The study process certificates that Baidu migration data is indeed a high quality data sources for the study of city network, and has turned up some interesting results: 1) The distribution of external linkage degree of cities in China follows Zipf’s law, but differs from the ideal Pareto distribution. 2) The factor of spatial distance and city level play key roles in the formation of urban network of China, and ensure the hierarchy and regularity of the network. 3) The spatial distribution of core linkages in the city network could be summarized as “Three-horizontal & Two-longitudinal”, which almost coincides with the rail arteries in China. The “Three-horizontal & Two-longitudinal” linkages are skeletons of the city network, which matter a great deal in building the interregional contact and coordinating the interregional relationship. 4) In overall, the strength of interactions within the city network differs between East and West China, and Hu's line is apparently the dividing line. As potential powers, the linkages along the Lanzhou-Xinjiang railway line have the opportunity to break the Hu's line. 5) Northeast China lacks regional centers and the linkages between cities forms a bunchy network. 6) There is a phenomenon of “near field deprivation” in North China and South China, that is, the core city have strong interactions with outer regions, but the smaller cities in its near field have poor external linkages with the core city and outer regions. 7) Belt-shaped region may become a popular mode and the future backbone of regional economic development in China.
[本文引用: 1]
DOI:10.1007/s11116-009-9186-zURLPMID:20953273 [本文引用: 1]
Ordinal measures are frequently encountered in travel behavior research. This paper presents a new method for combining them when a hierarchical structure of the data can be presumed. This method is applied to study the subjective assessment of the amount of travel by different transportation modes among a group of French clerical workers, along with the desire to increase or decrease the use of such modes. Some advantages of this approach over traditional data reduction technique such as factor analysis when applied to ordinal data are then illustrated. In this study, combining evidence from several variables sheds light on the observed moderately negative relationship between the personal assessment of the amount of travel and the desire to increase or decrease it, thus integrating previous partial (univariate) results. We find a latent demand for travel, thus contributing to clarify the behavioral mechanisms behind the induced traffic phenomenon. Categorizing the above relationship by transportation mode shows a desire for a less environmental-friendly mix of modes (i.e. a greater desire to use heavy motorized modes and a lower desire to use two-wheeled modes), whenever the respondents do not feel to travel extensively. This result, combined with previous theoretical investigations concerning the determinants of the desire to alter trips consumption levels, shows the importance of making people aware of how much they travel.
[本文引用: 1]
DOI:10.11821/dlxb201603011URL [本文引用: 1]
The purpose of this study is to explore the employment center system in the central city of Shanghai by using commuting data obtained from mobile phone signaling data in Shanghai. Based on the signaling data it is possible to identify the phone users' home residence and where their employment is. We compile the employment density map using the employment places data in order to identify the employment centers in Shanghai. Then the employment center system is measured based on two perspectives, namely employment density and commuting connection. We measure the level, the hinterland and influence sphere of each employment center in Shanghai central city. Our main conclusions are as follows: firstly, the employment center system in Shanghai central city is a weak multi-centric system with a strong primary center. Secondly, centers with higher employment densities also contain stronger commuting connections to other areas, and the discrepancies of commuting connections between centers are even more significant. Thirdly, centers with higher levels also have larger hinterlands, but their influence spheres are not necessarily larger. Fourthly, the mixed degree of residential and employment land use is a more significant determinant of the residential and employment land use pattern balance of employment center than the level of the center. Finally, influence spheres are alternately distributed in areas that lack employment centers. To some extent, this paper helps to solve the problems of identifying employment centers and measuring commuting connections. Previous studies have been unable to perfectly identify such centers due to either an overly large spatial unit of measurement or lack of commuting data. This paper will be helpful for constructing multi-center employment system in the central city of Shanghai.
[本文引用: 1]
DOI:10.1016/j.jtrangeo.2010.08.012URL [本文引用: 1]
This paper paper uses a complex network approach to examine the network structure and nodal centrality of individual cities in the air transport network of China (ATNC). Measures for overall network structure include degree distribution, average path length and clustering coefficient. Centrality metrics for individual cities are degree, closeness and betweenness, representing a node's location advantage as being directly connected to others, being accessible to others, and being the intermediary between others, respectively. Results indicate that the ATNC has a cumulative degree distribution captured by an exponential function, and displays some small-world (SW) network properties with an average path length of 2.23 and a clustering coefficient of 0.69. All three centrality indices are highly correlated with socioeconomic indicators of cities such as air passenger volume, population, and gross regional domestic product (GRDP). This confirms that centrality captures a crucial aspect of location advantage in the ATNC and has important implications in shaping the spatial pattern of economic activities. Most small and low-degree airports are directly connected to the largest cities with the best centrality and bypass their regional centers, and therefore sub-networks in the ATNC are less developed except for Kunming in the southwest and Urumchi in the northwest because of their strategic locations for geographic and political reasons. The ANTC is relatively young, and not as efficient and well-developed as that of the US. (C) 2010 Elsevier Ltd.
DOI:10.1016/j.jtrangeo.2014.02.002URL [本文引用: 1]
This paper analyzes the evolution process of the air transport network of China (ATNC) since 1930. Based on the network analysis results, the ATNC has significantly improved in connectivity based on (1) rising alpha, beta and gamma indices, (2) declining diameter and centre index and (3) decreasing average path length and increasing clustering coefficient. The network centralization index reveals a fluctuation phase before 1952, a pre-1980 centralization phase before the economic reform era, a centralization phase after the mid-1990s deregulation, and a decentralization phase between. The k-core decomposition method helps identify the evolution of core network and hierarchy of the ATNC over time. The spatial development model characterizes its structure change in six stages: (1) scattered development, (2) trunk line connection, (3) circular linkage, (4) hub formation, (5) a complex network structure, and (6) emerging multi-airport systems. (C) 2014 Elsevier Ltd.
DOI:10.11821/dlxb201602007URL [本文引用: 1]
The evolution of inter-city network influenced by globalization and information technology has become a hot topic in city and urban research. This study tries to explore the evolution of nodal hierarchy and communities in inter-city network based on passenger train network during the rapid development period of High-speed Railway (HSR) in China since 2003. Results indicate that: (1) the evolved HSR network in China enlarged the disparities of weighted degree centrality between regions, but decreased the disparities of that between communities, and led to an increasing concentrated city hierarchy with fewer cities having high centrality value, and a growing similarity between the city hierarchies measured by the passenger train network and by city attributes (such as population and GDP); (2) the city hierarchy measured by passenger train network followed a rank-size distribution in the national and regional levels, as well as in some communities. (3) Spatially, cities with higher hierarchy in passenger train network and larger improvement in weighted centrality indicator were mostly located in the eastern region or the areas with the distance to the nearest HSR stations below 50 km, developed economy and high population density; the cities in 2013 could be divided into 14 communities, including the communities with cities mainly located along Beijing-Shanghai, Beijing-Wuhan and Wuhan-Chengdu, Wuhan-Guangzhou, Beijing-Jiujiang, Hangzhou-Xiamen, Lanzhou-Urumqi trunk rail lines, and located in Northeast China, Shanxi Province, Inner Mongolia. (4) The evolution of communities was mostly influenced by the natural environment and administrative areas, especially by the development of HSR network.
[本文引用: 1]
DOI:10.1038/s41467-017-01892-8URLPMID:29158475 [本文引用: 1]
Studies of human mobility in the past decade revealed a number of general scaling laws. However, to reproduce the scaling behaviors quantitatively at both the individual and population levels simultaneously remains to be an outstanding problem. Moreover, recent evidence suggests that spatial scales have a significant effect on human mobility, raising the need for formulating a universal model suited for human mobility at different levels and spatial scales. Here we develop a general model by combining memory effect and population-induced competition to enable accurate prediction of human mobility based on population distribution only. A variety of individual and collective mobility patterns such as scaling behaviors and trajectory motifs are accurately predicted for different countries and cities of diverse spatial scales. Our model establishes a universal underlying mechanism capable of explaining a variety of human mobility behaviors, and has significant applications for understanding many dynamical processes associated with human mobility.
DOI:10.1080/13658816.2019.1697879URL [本文引用: 1]
[本文引用: 1]
DOI:10.1016/j.compenvurbsys.2018.05.004URL [本文引用: 1]
[本文引用: 1]
[本文引用: 1]
[本文引用: 1]
[本文引用: 1]
DOI:10.1080/24694452.2018.1511413URL [本文引用: 1]
DOI:10.1101/2020.07.02.20144543URLPMID:32637978 [本文引用: 1]
BACKGROUND: Highly sensitive, non-invasive, and easily accessible diagnostics for Severe Acute Respiratory Syndrome Coronavirus 2 (SARS-CoV-2) are essential for the control of the Coronavirus Disease 2019 (COVID-19) pandemic. There is a clear need to establish a gold standard diagnostic for SARS-CoV-2 infection in humans using respiratory tract specimens. METHODS: Searches will be conducted in the bibliographic databases Medline, Embase, bioRxiv, medRxiv, F1000, ChemRxiv, PeerJ Preprints, Preprints.org, Beilstein Archive, and Research Square. Relevant government documents and grey literature will be sought on the FDA's Emergency Use Authorizations website, the ECDC's website, and the website of the Foundation for Innovative New Diagnostics. Finally, papers categorized as diagnosis papers by the EPPI Centre's COVID-19 living systematic map will be added to our screening process; those papers are tagged with the diagnosis topic based on human review, rather than database searches, and thus this set of papers might include ones that have not been captured by our search strategy.
DOI:10.1016/S1470-2045(20)30315-6URLPMID:32682457 [本文引用: 1]
DOI:10.1080/00330120701724087URLPMID:18458760 [本文引用: 1]
The variations of breast cancer mortality rates from place to place reflect both underlying differences in breast cancer prevalence and differences in diagnosis and treatment that affect the risk of death. This article examines the role of access to health care in explaining the variation of late-stage diagnosis of breast cancer. We use cancer registry data for the state of Illinois by zip code to investigate spatial variation in late diagnosis. Geographic information systems and spatial analysis methods are used to create detailed measures of spatial access to health care such as convenience of visiting primary care physicians and travel time from the nearest mammography facility. The effects of spatial access, in combination with the influences of socioeconomic factors, on late-stage breast cancer diagnosis are assessed using statistical methods. The results suggest that for breast cancer, poor geographical access to primary health care significantly increases the risk of late diagnosis for persons living outside the city of Chicago. Disadvantaged population groups including those with low income and racial and ethnic minorities tend to experience high rates of late diagnosis. In Illinois, poor spatial access to primary health care is more strongly associated with late diagnosis than is spatial access to mammography. This suggests the importance of primary care physicians as gatekeepers in early breast cancer detection.
DOI:10.1080/00045608.2012.657146URLPMID:23335813 [本文引用: 1]
Despite spending more than any other nation on medical care per person, the United States ranks behind other industrialized nations in key health performance measures. A main cause is the deep disparities in access to care and health outcomes. Federal programs such as the designations of Medically Underserved Areas/Populations and Health Professional Shortage Areas are designed to boost the number of health professionals serving these areas and to help alleviate the access problem. Their effectiveness relies first and foremost on an accurate measure of accessibility so that resources can be allocated to truly needy areas. Various measures of accessibility need to be integrated into one framework for comparison and evaluation. Optimization methods can be used to improve the distribution and supply of health care providers to maximize service coverage, minimize travel needs of patients, limit the number of facilities, and maximize health or access equality. Inequality in health care access comes at a personal and societal price, evidenced in disparities in health outcomes, including late-stage cancer diagnosis. This review surveys recent literature on the three named issues with emphasis on methodological advancements and implications for public policy.
DOI:10.1111/j.1931-0846.2016.12207.xURL [本文引用: 1]
DOI:10.1080/00330124.2016.1266950URL [本文引用: 1]
DOI:10.2307/3144521URL [本文引用: 2]
DOI:10.1111/1475-6773.12616URLPMID:27861822 [本文引用: 1]
OBJECTIVE: To develop an automated, data-driven, and scale-flexible method to delineate hospital service areas (HSAs) and hospital referral regions (HRRs) that are up-to-date, representative of all patients, and have the optimal localization of hospital visits. DATA SOURCES: The 2011 state inpatient database in Florida from the Healthcare Cost and Utilization Project. STUDY DESIGN: A network optimization method was used to redefine HSAs and HRRs by maximizing patient-to-hospital flows within each HSA/HRR while minimizing flows between them. We first constructed as many HSAs/HRRs as existing Dartmouth units in Florida, and then compared the two by various metrics. Next, we sought to derive the optimal numbers and configurations of HSAs/HRRs that best reflect the modularity of hospitalization patterns in Florida. PRINCIPAL FINDINGS: The HSAs/HRRs by our method are favored over the Dartmouth units in balance of region size and market structure, shape, and most important, local hospitalization. CONCLUSIONS: The new method is automated, scale-flexible, and effective in capturing the natural structure of the health care system. It has great potential for applications in delineating other health care service areas or in larger geographic regions.
DOI:10.1016/j.tourman.2018.03.009URL
DOI:10.1016/j.compenvurbsys.2017.04.010URL [本文引用: 1]
DOI:10.1016/j.annals.2018.12.024URL [本文引用: 1]
DOI:10.1016/j.tourman.2016.06.006URL [本文引用: 1]
DOI:10.1016/j.asoc.2018.08.024URL [本文引用: 1]
DOI:10.1016/j.tourman.2010.06.010URL [本文引用: 1]
Firms productivity is crucially influenced by knowledge spillovers generated either by other firms located nearby or by direct contacts with consumers or by foreign demand in the case of traded products. In this paper we propose a new channel of efficiency-enhancing knowledge diffusion, which can be exploited by local firms to extract relevant information on consumer preferences: direct contacts with tourism flows. Tourists have the peculiar feature of being external consumers, who directly arrive to the destination region and this represents a remarkable advantage for the local enterprises, as the latter can exploit the new information and increase the overall efficiency level of the local economy. More specifically, we examine, within a spatial estimation framework, tourism flows as determinants of regional total factor productivity, controlling also for other intangible factors (such as human, social and technological capital) and for the degree of accessibility. We apply the analysis to a sample of 199 European regions belonging to the EU15 member countries, plus Switzerland and Norway. The empirical results show that tourism flows enhance regional efficiency and that a positive role is also played by intangible assets, infrastructures and spatial spillovers. (C) 2010 Elsevier Ltd.
DOI:10.1177/0047287517741997URL [本文引用: 1]
DOI:10.1109/ACCESS.2018.2869378URL [本文引用: 1]
DOI:10.1111/tgis.12340URL [本文引用: 1]
DOI:10.1080/24694452.2019.1694403URL [本文引用: 1]
