 ,1,2, 郑宏伟1,2, 陈春波1, 白洁1, 刘铁1,2
Water use analysis of Syr Darya river basin: Based on "Water-Energy-Food-Ecology" nexus and Bayesian network
SHI Haiyang1,2, LUO Geping,1,2, ZHENG Hongwei1,2, CHEN Chunbo1, BAI Jie1, LIU Tie1,2通讯作者:
收稿日期:2019-02-12修回日期:2020-02-10网络出版日期:2020-05-25
| 基金资助: |
Received:2019-02-12Revised:2020-02-10Online:2020-05-25
| Fund supported: |
作者简介 About authors
施海洋(1994-),男,江苏海门人,博士生,主要从事土地变化及其生态效应、遥感与GIS应用研究E-mail:shihaiyang16@mails.ucas.ac.cn。

摘要
关键词:
Abstract
Keywords:
PDF (4741KB)元数据多维度评价相关文章导出EndNote|Ris|Bibtex收藏本文
本文引用格式
施海洋, 罗格平, 郑宏伟, 陈春波, 白洁, 刘铁. 基于“水—能源—食物—生态”纽带因果关系和贝叶斯网络的锡尔河流域用水分析. 地理学报[J], 2020, 75(5): 1036-1052 doi:10.11821/dlxb202005011
SHI Haiyang.
1 引言
咸海流域主要包括上游的塔吉克斯坦和吉尔吉斯斯坦,下游的乌兹别克斯坦、土库曼斯坦和哈萨克斯坦,是中国“一带一路”倡议的核心区域,地理位置独特,地缘政治地位显赫。20世纪60年代以来,咸海流域大规模水土开发,水库、引水干渠等大型水利工程建设和超大型农业灌溉系统发展,导致引水量激增和入湖水量骤减。20世纪80年代末期咸海面积萎缩了50%左右,引发了著名的咸海生态危机,受到国际高度关注。苏联解体前,咸海流域用水统一调配与管理,上游产水可基本保障保证下游农业用水,上游短缺的能源也基本可得到下游丰富化石能源的补偿和满足。苏联解体后,下游国家出于自身利益考虑,不再补偿上游区域短缺的能源,上游国家被迫通过增加夏季水库蓄水来保证冬季发电用水,夏季减少向下游供水,影响下游农业生产;而上游非生长季的放水,又常会引发下游的洪涝灾害。同时,人口和社会经济发展致用水需求进一步增加,上下游国家对水权争夺愈演愈烈。目前咸海面积已萎缩了90%左右,生态危机有加剧的趋势:部分年份河流断流,水质恶化,土壤盐渍化严重导致土地弃耕,干旱加剧和湖底大部分裸露等导致沙尘盐尘天气灾害增加,生物多样性降低,渔业资源受到严重破坏[1]。治理和管理咸海生态危机要遵循可持续发展的理念,建立协调的“水—能源—食物—生态”纽带关系。咸海流域的社会经济发展高度依赖水资源,优化分配社会经济用水与生态用水是建立协调的纽带关系的关键所在。经过苏联的改造,上游的水电开发、下游的大规模农业开发与化石能源开采极大地提升了资源利用程度,使得流域内社会经济用水与上下游间能源关系和食物需求量及其结构高度相关。目前国际上“水—能源—食物—生态”纽带关系的研究热点在于不同角度下关系的形式[2,3,4],研究多未考虑或体现湿润区与干旱区的差异,而湿润区生态自适应能力较强,对纽带关系变化的敏感性远低于干旱区[5,6]。目前水资源优化分配方法在干旱区应用时缺少对敏感的纽带关系的系统性认识。常用的水资源优化分配方法如两阶段随机规划方法[7,8]:第一阶段确定用水项及上下界、第二阶段根据水利用收益在来水随机的情况下优化水资源分配。但实际上,用水及其收益受纽带关系中复杂因果关系的限制,这类方法放松了规划中的约束条件。在湿润区或发达地区应用时,用水对纽带关系敏感性低,放松约束条件带来的负面效应常常较小;在干旱区应用时,用水对纽带关系敏感性高,放松的约束条件可能导致求解出实际不可行的优化方案。因此,本文兼顾干旱区生态的脆弱性,基于“水—能源—食物—生态”纽带关系开展流域水资源利用分析与优化。
目前对社会、水、生态系统相互作用及其进化过程的研究主要是基于耦合建模方法[9]:直接耦合或通过中间变量连接分别建立水系统模型、社会经济模型、生态模型或其它模型,如CLEW[10]、WEF Tool 2.0[11]、WELF[12]。这类耦合建模方法中的不确定性表现在模型结构、模型参数率定、模型数据输入等方面,耦合模型的过程中还存在模型结构、时空尺度等不匹配的问题。同时,这些模型需要大量数据率定,易陷入子模型的局部最优,存在“异参同效”等问题。
对“水—能源—食物—生态”纽带关系的分析,受社会发展的稳定性影响很大。以往的研究中缺少对社会发展背景的细化。分析发达国家的纽带关系研究时,因社会经济发展稳定、对自然资源依赖度较小、获取自然资源能力较强等,变量间的关系往往较稳定。而在分析发展中国家的纽带关系时,由于社会发展不稳定、自然资源稀缺、获取自然资源能力弱、对自然资源依赖度高、可持续发展理念较弱、生态环境问题突出等,纽带中矛盾丛生,导致纽带震荡剧烈、稳定性差、不确定性高,这也解释了为何这些区域往往成为“水—能源—食物—生态”纽带关系研究的热点区域[6, 9, 13]。
咸海流域主要构成之一的锡尔河流域,其水文与生态过程、能源和粮食生产的相关观测数据不完备,且纽带关系严重依赖随机性较强的河川径流量。“数据少”“因果关系量化困难且不确定性高”的特点,给耦合建模方法的应用带来巨大困难。此外,流域的水土开发经历了苏联的兴衰,不同历史时期的用水模式方式迥异,纽带关系也随之变化。
贝叶斯网络是不确定性知识表达与推理的一种新方法,基于图论与贝叶斯概率公式,用概率测度的权重描述变量间的因果关系强弱,通过条件概率的推理方式进行诊断和预测。目前,已有一些研究利用贝叶斯网络研究水资源管理。大多数研究将贝叶斯网络作为水资源管理决策的支持工具,多集中于水质[14,15,16,17]、地下水[18,19]、灌溉用水[20,21]和供水[22,23]的管理,获得了较好的效果,体现出其对系统不确定知识的表达能力。但缺少对气候变化、人口增长、“水—能源—食物—生态”纽带关系等研究热点的协同考虑,忽略了这些外部因素在水资源管理中的重要性。贝叶斯网络为水资源管理提供了一种有效的新研究方案,与其他模型、规划方法和情景分析的结合拥有良好的发展前景[24]。
因此,本文基于“水—能源—食物—生态”纽带关系和贝叶斯网络,分析1970—2015年间锡尔河流域用水状况,为锡尔河流域水资源管理与决策提供知识支持,辅助评估节水方案情境下社会经济与生态环境所受到的影响。本文主要研究目标包括:① 基于对流域“水—能源—食物—生态”纽带中因果关系的认知确定贝叶斯网络的结构;基于1970—2015年不同时期用水特征和存在的主要矛盾,搭建锡尔河流域用水状况的贝叶斯概率网络并评估模型适用性;② 分析不同历史时期用水模式差异对咸海入湖水量的影响;③ 提出锡尔河流域用水优化模式。
2 数据与方法
2.1 研究区
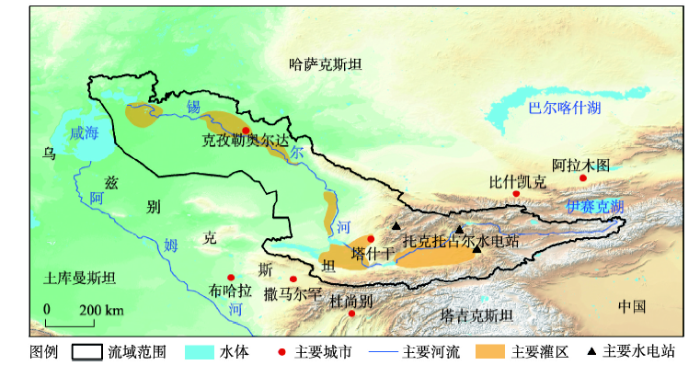
锡尔河(图1)发源于西天山,向西流入费尔干纳谷地,流经图兰低地后注入咸海,全长3019 km,为中亚最长的河流,流域面积2.19×10⁵ km2,年均径流量37.2 km3 [25]。上游水力资源丰富,最大水电站为吉尔吉斯斯坦境内的托克托吉尔水电站,总库容19.5 km3,多年平均发电量4.4×10⁹ kW h [25]。中下游化石能源相对比较丰富,且为乌兹别克斯坦和哈萨克斯坦重要的灌溉农业区,灌溉用水占比在90%以上,多数引水渠年久失修、渗漏现象严重,加之中下游地区气候干旱,导致锡尔河注入咸海的水量减少。图1
 新窗口打开|下载原图ZIP|生成PPT
图1锡尔河流域地理位置
注:该图基于国家测绘地理信息局标准地图服务网站下载的审图号为GS(2016)1665号标准地图制作,底图无修改。
Fig. 1Geographic location of the Syr Darya river basin
2.2 数据
本文搜集了1970—2015年流域内国家或州尺度水资源、能源和工农业生产及咸海生态相关的数据(表1)。根据国界和对水、能源和食物的生产和消费的显著区域差异,设定托克托古尔水梯级电站为本文上下游分界点。上游包括吉尔吉斯斯坦全国,下游包括乌兹别克斯坦的吉扎克州、塔什干州、纳曼干州、安集延州、费尔干纳州和锡尔河州,哈萨克斯坦的克孜勒奥尔达州和南哈萨克斯坦州。虽然咸海在20世纪80年代分为南北咸海,锡尔河流入北咸海,但实际上南北咸海休戚相关,南咸海的水量与生态状况也受锡尔河供水的影响,引发的盐尘暴等也影响锡尔河下游。因此,本文中咸海生态数据范围为整个咸海。下游数据由乌兹别克斯坦6个州和哈萨克斯坦2个州求和或按人口等加权平均求得。1987—1992年、2010—2015年的社会经济等数据存在部分缺失,生态指标中的水质采样、土壤采样等为时间点数据,本文使用线性插值进行了填补,最终将所有数据时空尺度统一处理为上下游尺度及年尺度。由于本文使用的时空尺度较大,因此受年内时间差异及局部空间异质性影响较小,所搜集数据能基本满足精度需求。Tab. 1
表1
表1数据来源
Tab. 1
| 数据种类 | 时间 | 数据说明 | 来源 | |
|---|---|---|---|---|
| 径流量 | 1970—2015年 | 水文站点数据, 日尺度和年尺度 | https://www.bafg.de/GRDC (1970—1989年) http://www.cawater-info.net/water_quality_in_ca/syr_e.htm (1911—2016年) | |
| 降水 | 1970—2015年 | 气象站点数据, 日尺度 | https://www.ncdc.noaa.gov | |
| 干旱指数 | 1979—2015年 | 遥感模型反演数据产品, 日尺度, 分辨率0.04°×0.04° | https://developers.google.com/earth-engine/datasets/catalog/IDAHO_ EPSCOR_PDSI | |
| 水库运行 | 1974—2015年 | 月尺度 | Siegfried T [26] (1974—2006年) http://www.icwc-aral.uz(2007—2015年) | |
| 用水 能源 | 1970—2015年 1991—2015年 | 年尺度和州尺度 年尺度和国家尺度 | https://www.cawater-info.net https://www.ceicdata.com | |
| 社会经济 | 1970—2015年 | 统计公报 年尺度和州尺度 | http://stat.gov.kz (2003—2015年), http://www.stat.kg (2012—2015年) https://stat.uz/uz(2000—2015年), https://data.worldbank.org.cnhttp://www.fao.org/statistics, 苏联国民经济统计年鉴(1960—1987年), 独联体统计委员会数据库(1992—2010年) | |
| 咸海水情 | 1970—2015年 | https://www.cawater-info.net | ||
| 生态指标 | 1980—2010年 | https://www.cawater-info.net, Micklin P [1, 25] | ||
新窗口打开|下载CSV
2.3 方法
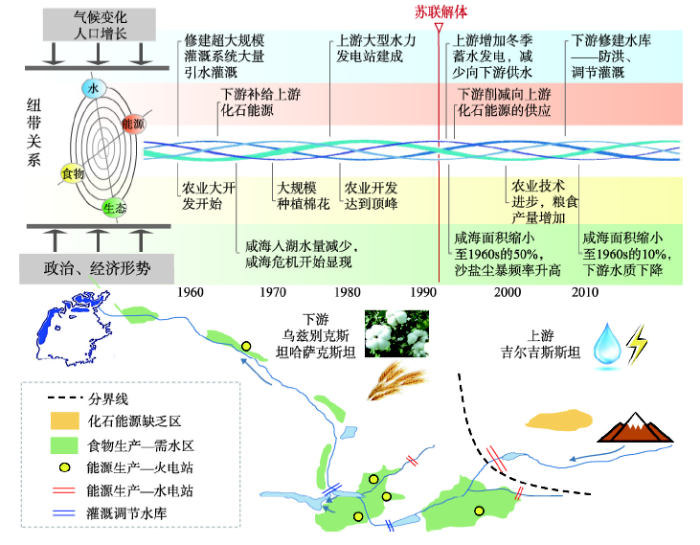
2.3.1 锡尔河流域“水—能源—食物—生态”纽带关系 根据不同社会背景下的管理方式,1970—2015年锡尔河流域的“水—能源—食物—生态”纽带关系可分为4个阶段(图2):① 农业大开发阶段(1970—1980年):这一时期苏联在流域进行大规模土地开垦,主要种植高耗水的棉花,并主要采用漫灌。期间修建了大型水库和干渠等水利灌溉工程,这些工程渗漏较为严重,农业用水效率较低,大量水资源在引用的途中被消耗,咸海水入水量逐年减少,咸海生态危机开始显现[27]。② 水土开发达到峰值且相对稳定阶段(1980—1991年):这一时期农业开发规模达到顶峰并且相对稳定,咸海入湖水量进一步减少。由于农业需水量极大,流域下游农业用水优先予以满足,上游发电需求缺口靠下游免费的化石能源进行补偿,大量农业灌溉回归水排入绿洲外围的咸水洼地,无法重复利用或回归锡尔河,造成严重的水资源浪费。流入咸海的水量极低,甚至有些年份出现断流[27]。③ 苏联解体后经济发展滞缓阶段(1991—2005年):苏联解体后新诞生的中亚国家在这一时期政治局势不稳,社会经济出现停滞甚至倒退。棉花生产远大于解体后国家的实际需求,农用地面积缩小,在种植结构上,受迫于人口增长导致的粮食安全压力,粮食作物种植面积占比增加。在水和能源关系方面,下游区域不再免费向上游免费补给能源,上游吉尔吉斯斯坦产生能源危机,电力需求无法满足,尤其是用电高峰期的冬季[28]。吉尔吉斯斯坦约90%的电力来自水力发电,为了在冬季生产更多电力,增加夏季上游水库蓄水,并在冬季下泄发电,给下游带来夏季农业用水短缺与冬季洪涝风险。长期的漫灌造成下游农田土壤盐渍化严重、肥力下降,同时大量农药、有机质与盐分进入锡尔河,导致下游水质恶化。1993年咸海面积较20世纪60年代缩小了50%,时至2004年,咸海的面积只剩下原来的25%[25]。沙、盐尘暴频次增加,威胁居民健康,咸海危机进一步发展。④ 经济复苏的阶段(2005—2015年):进入21世纪,中亚五国中化石能源丰富、工业基础相对较好的哈萨克斯坦和土库曼斯坦经济发展速度增快,经济上逐渐拉开与农业产值占比极高的乌兹别克斯坦、塔吉克斯坦、吉尔吉斯斯坦的差距。受农业地私有化及农产品出口前景的改善,下游农业生产积极性提高,加上农耕技术的进步,农业生产力有所提升。相对较富裕的哈萨克斯坦在锡尔河中游修建大型水库防洪、调节灌溉,缓解自身在水资源竞争中的劣势[29];同时,为保护咸海在该国境内部分的生态,在北咸海修建竣工科卡拉尔水坝,水坝将咸海南北两湖分离,北咸海水面开始扩大,湖水位开始回升,维持北咸海水位在42 m左右[25],但间接导致南咸海加速干涸。上游的吉尔斯斯坦与中下游的乌兹别克斯坦由于未改变原用水方式,在人口增加与气候变化的压力下,用水矛盾趋于升级。2010年前后咸海面积缩小到20世纪60年代的10%,生态危机进一步加重。图2
 新窗口打开|下载原图ZIP|生成PPT
图21970—2015年锡尔河流域“水—能源—食物—生态”纽带关系变化
Fig. 2Changes of Water-Energy-Food-Ecology nexus in Syr Darya river basin in the past 50 years
2.3.2 基于“水—能源—食物—生态”纽带因果关系的贝叶斯概率网络
(1)贝叶斯概率网络。1988年Pearl[30]结合图论与贝叶斯概率公式,提出贝叶斯网络的概念。贝叶斯网络是一个有向无环图模型,节点代表变量的概率分布、节点间的有向边代表由条件概率表表征的“因果关系”,利用贝叶斯条件概率公式将节点连接成网状。通过先验知识和观测数据获取网络节点的条件概率分布。当调整某些节点概率分布时,结合贝叶斯公式,贝叶斯网络能计算其他节点的后验条件概率分布,实现预测或诊断分析。
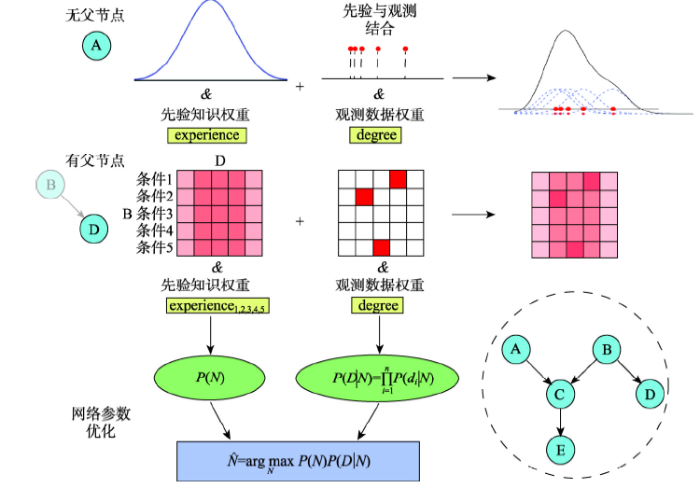
在给定网络先验联合概率分布的基础上,使用观测数据不断更新网络参数,其中使用EM算法(Expectation-Maximization algorithm)[31]迭代计算参数的期望和极大似然估计,能针对存在缺失的数据实现优化过程(图3)。本文使用Netica软件实现贝叶斯网络,该软件在贝叶斯网络建模研究中应用广泛[32]。Netica中用“experience”变量表示先验知识背后代表的观测数据或先验知识的可信度,而用“degree”变量表示观测数据的训练次数,将两者结合可动态调整先验知识与观测数据在概率分布确定中的权重。每次数据训练过程中,将“degree”叠加至“experience”上,不断更新先验知识及其权重。
图3
 新窗口打开|下载原图ZIP|生成PPT
图3节点参数的确定与贝叶斯网络的优化
注:上半部分表示有无父节点及连续或离散节点概率分布生成方式的差异,对于条件概率的每行需设置不同的“experience”权重;下半部分表示网络参数优化过程,其中P表示概率,N表示网络,di表示每条观测数据,D表示观测数据集。
Fig. 3Parameter calculation of nodes and optimization of Bayesian network
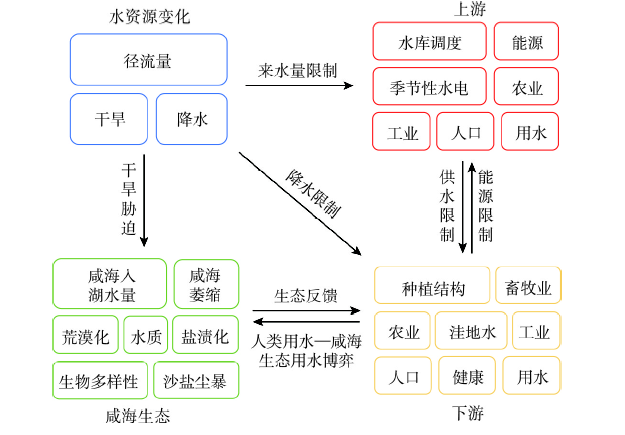
(2)基于“水—能源—食物—生态”纽带因果关系的锡尔河流域水资源利用贝叶斯网络结构。基于变化的“水—能源—食物—生态”纽带关系,本文建立锡尔河流域的用水贝叶斯网络(图4)。它包含以下4个模块:① 水资源模块:反映气候变化及其对水资源变化的影响,包括温度、降水、冰川和永久性积雪变化及其对径流量影响程度,用于表示山区来水量变化、下游绿洲用水区保水能力等。② 上游模块:反映水和能源的局部纽带关系,包括上游水力发电、能源进口及主要水库冬季放水量、夏季放水量等,描述上游发电用水与下游农业用水之间的季节用水矛盾。③ 下游模块:反映“水—食物”局部纽带关系。下游经济规模、用水规模等在流域中占比较高,因此细化了下游种植业、畜牧业、工业等不同产业用水的变化。④ 咸海生态模块:反映“水—能源—食物”局部纽带关系对生态的影响,衡量不合理用水和食物生产对土壤盐渍化、咸海萎缩、沙尘盐尘天气、生物多样性和居民健康的影响。
图4
 新窗口打开|下载原图ZIP|生成PPT
图4基于“水—能源—食物—生态”纽带关系的锡尔河流域用水贝叶斯网络结构示意图
Fig. 4The structure of Bayesian network of water use in Syr Darya river basin based on the Water-Energy-Food-Ecology nexus
本文定义3种因果关系,包括构成式因果关系、直接式因果关系和间接式因果关系。构成式因果关系是基于成分构成,如农业用水、工业用水和生活用水构成总用水量;直接式因果关系基于物理过程,如径流量变化与水库储水量的关系;间接式因果关系由需求间接驱动的,如人口增长与粮食产量的关系,人口增长驱动粮食作物产量的增加。
(3)贝叶斯网络模型参数化。为减小联合概率分布的计算量,对数据离散化处理,得到节点数据的状态分级(表2),对少数定性的节点进行评级(低、中、高)。离散化过程中不同的间隔数与分割点可能会对模型性能产生影响,同时也会影响先验的专家知识的设定。因此本文数据的离散化与先验知识的设定同步进行,依据专家知识和实际数据分布,指导节点的离散化。设定先验专家知识时,部分节点设置为正态分布的离散形式,如径流量节点3个状态的先验离散概率分布设定为(0.2, 0.6, 0.2)。对先验知识的权重“experience”变量的设定中,考虑观测数据的数量,令“experience < 0.3 degree”,保证网络参数化过程中观测数据所代表的信息量权重。
Tab. 2
表2
表2重要变量的具体解释与状态分级
Tab. 2
| 变量 | 解释 | 状态分级 | 单位 |
|---|---|---|---|
| 年径流量 | 乌奇库尔干等站 | 280~360, 360~440, 440~650 | 108 m3 |
| 下游降水量 | 克孜勒奥尔达、费尔干纳、吉扎克等地区气象站均值 | 170~190, 190~210, 210~230 | mm |
| 下游干旱指数PDSI | -8~-4, -4~0, 0~6 | ||
| 上游水库蓄水量 | 托克托古尔水库 | 0~6, 6~12, 12~20 | km3 |
| 水库夏季放水量 | 1800~2800, 2800~3800, 3800~4800 | 106 m3 | |
| 水库冬季放水量 | 3500~3800, 3800~4200, 4200~4500 | 106 m3 | |
| 上游水力发电量 | 0.3~0.8, 0.8~1.2, 1.2~1.5 | 1010 kW·h | |
| 上游进口天然气量 | 从下游进口 | 0~1, 1~2, 2~3 | 109 m3 |
| 下游棉花种植面积 | 700~750, 750~800, 800~850 | 103 ha | |
| 下游棉花产量 | 1100~2200, 2200~3300, 3300~4400 | 103 t | |
| 下游粮食作物种植面积 | 1000~1100, 1100~1200, 1200~1300 | 103 hm2 | |
| 下游粮食产量 | 1500~2500, 2500~3500, 3500~4500 | 103 t | |
| 下游大牲畜量 | 牛、羊数量 | 7000~10000, 10000~13000, 13000~16000 | 103头 |
| 下游灌溉定额 | 9500~10000, 10000~10500, 10500~11000 | m3/hm2 | |
| 下游总用水量 | 33~35, 35~37, 37~40 | km3 | |
| 流入洼地水量 | 流入Arnasay洼地水量 | 1.5~4.5, 4.5~6.5, 6.5~8.5 | km3 |
| 下游农业产值 | 2~4, 4~6, 6~8 | 109 US$ | |
| 下游总产值 | 10~30, 30~50, 50~70 | 109 US$ | |
| 下游人口 | 14~16, 16~18, 18~20 | 106人 | |
| 咸海入湖水量 | 卡扎林斯克站 | 2.5~4, 4~5, 5~6.5 | km3 |
| 咸海水量 | 10~100, 100~200, 200~300 | km3 | |
| 下游荒漠面积 | 包括Aralkum沙漠 | 14~16, 16~18, 18~20 | 104 km2 |
| 下游土壤盐分含量 | 克孜勒奥尔达地区 | 0~3, 3~8, 8~30 | g/kg |
| 下游沙、盐尘暴频率 | 0~30, 30~60, 60~100 | d/a | |
| 下游饮用水矿化度 | 克孜勒奥尔达地区 | 0~0.5, 0.5~1, 1~3 | g/L |
| 下游人均预期寿命 | 64~66, 66~68, 68~70, 70~72 | a |
新窗口打开|下载CSV
本文在2个时间尺度利用数据信息:① 年尺度,反映要素的年度变化,如丰、平、枯水年的径流量差异明显,而径流量的不确定性通过纽带关系传播,影响着流域的水资源利用;② 社会经济发展背景的阶段尺度,时间约10~15年,具体为1970—1980年、1980—1991年、1991—2005年和2005—2015年。因此,本文分4个时间段、区分不同的社会经济背景和发展阶段,分别输入各时段内年尺度数据,实现网络参数化。
(4)模型评估、验证和不确定性度量方法。可以从定性评估(如因果关系实际反馈)与定量验证(如通过比较观测数据和模拟结果评估预测精度[33]和敏感性分析[34])两个方面评估基于因果关系建立的贝叶斯网络。敏感性分析被广泛认为能更有效地评估模型表现[35,36,37,38],本文使用敏感性分析来测试贝叶斯网络输出变量对输入变量的敏感性。基于熵缩减(Entropy Reduction)的互信息MI(Mutual Information)与基于方差缩减(Variance Reduction)的信念方差VB(Variance of Belief)是常用的进行贝叶斯网络模型评估的敏感性分析指标[39,40],计算公式如下:
式中:V表示方差;H表示熵;Q表示目标节点;F表示其他节点;q和f分别表示Q和F的状态;Xq是与状态q对应的真实数值。为了方便对比,分别将互信息和信念方差归一化至0~100%的范围,得到互信息比率和信念方差比率。
同时本文以K次交叉验证计算误差矩阵评估精度[37, 41],比较最大后验概率的状态与实际值状态的一致性。其中,K次交叉验证是将训练集分割成K个子样本,一个单独的子样本被保留作为测试模型的数据,其他K-1个样本用来训练的方法。交叉验证重复K次,记录K次分别计算的混淆矩阵,再对得到的K个混淆矩阵进行平均,以评估整体模型性能。
度量结果不确定性时,贝叶斯可信区间能在后验概率分布中表示不确定性[37],用于表示处于特定可接受水平的后验概率分布。在极端事件的影响较大时,设置过高的贝叶斯可信度可能导致极端事件的影响被忽略。为兼顾节点分布上下界的极端值的影响,在1-b(0 < b <1)的可信度下,本文计算的贝叶斯可信区间表示概率分布上下0.5 b分位点之间的部分。
3 结果
3.1 参数化后的贝叶斯概率网模型
通过融合先验知识和数据,生成参数化后的贝叶斯概率网模型(图5)。节点的概率分布有效地表征了其不确定性,形成对水资源利用的系统性认识。为度量结果的不确定性,对部分节点的后验概率分布计算贝叶斯可信区间(表3)。为了降低忽略极端事件带来的风险,设置可信度为80%。改变父节点的状态变量时,后验贝叶斯可信区间能捕捉父节点的变化,反映不确定性对输入数据的动态响应。贝叶斯可信区间的形式有助于水资源管理者的决策过程。图5
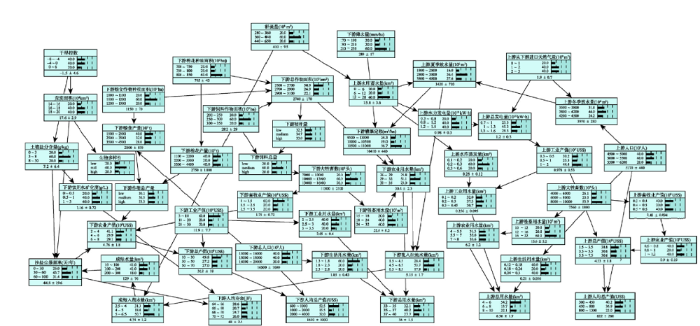 新窗口打开|下载原图ZIP|生成PPT
图5计算条件概率表后的锡尔河流域用水贝叶斯网络(2005—2015年)
注:节点中黑色条带表示各个状态的概率分布,下方“a±b”表示该节点分布的均值和标准差。
Fig.5Bayesian network of water use in Syr Darya river basin with conditional probability tables (2005-2015)
Tab. 3
表3
表3部分节点后验概率分布的贝叶斯可信区间估计
Tab. 3
| 节点 | 80%可信度的贝叶斯可信区间 | 单位 |
|---|---|---|
| 咸海入湖水量 | (2.95, 6.22) | km3 |
| 上游总用水量 | (4.37, 9.38) | km3 |
| 下游总用水量 | (33.71, 39.18) | km3 |
| 下游农业产值 | (2.49, 7.31) | 109 US$ |
| 下游沙、盐尘暴频率 | (13.27, 89.44) | d/a |
| 下游饮用水矿化度 | (0.55, 2.72) | g/L |
新窗口打开|下载CSV
3.2 模型评估与验证
本文挑选6个能反映流域“水—能源—食物—生态”纽带关系中各部分重要性的节点作为目标变量,基于Netica软件进行敏感性分析。结果表明互信息与信念方差呈现较一致的趋势,互信息越大、信念方差越大、目标变量对其敏感性越高,且节点与目标节点间中间变量增多时,对目标节点的影响减弱(图6)。基于该评估方法的敏感性分析结果与事实证据相吻合,能够验证模型的适用性。以节点“入湖咸海水量”为例,下游农业用水量、上游水库需水量、流入洼地水量等与流域实际水资源利用的主要方式相吻合,尤其是下游农业用水量,对咸海入湖水量影响很大,这与已有的认知一致[25]。同时,部分节点由于数据代表性低、受未考虑的因素影响大,对其他节点敏感程度较弱,没有反映出较强的因果关系。如节点“下游人均预期寿命”尽管受生态负反馈影响,但可能受未考虑的医疗水平等影响更大。图6
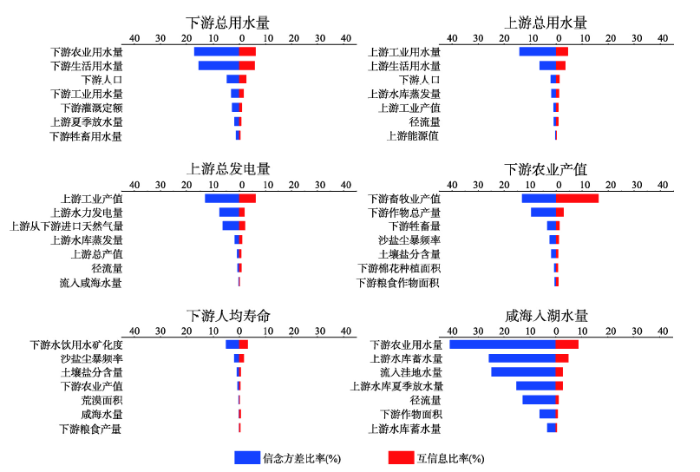 新窗口打开|下载原图ZIP|生成PPT
图6不同目标变量的敏感性分析
Fig. 6Sensitivity analysis of various target variables
同时,为评估模型对用水的预测能力,利用Netica对2005—2015年的数据集使用5次交叉验证,计算节点“下游总用水量”的混淆矩阵(表4)。网络在预测下游用水量时总体精度达到70%,表现出较高的精度,在预测未来下游用水时具有一定的可靠性。
Tab. 4
表4
表4基于混淆矩阵的节点“下游总用水量”精度验证
Tab. 4
| 实际下游 总用水量(km3) | 预测下游总用水量(km3) | |||
|---|---|---|---|---|
| 33~35 | 35~37 | 37~40 | 行总和 | |
| 33~35 | 2 | 0 | 1 | 3 |
| 35~37 | 0 | 3 | 1 | 4 |
| 37~40 | 0 | 1 | 2 | 3 |
| 列总和 总体精度(%) | 2 | 4 | 4 | 10 |
| 70 | ||||
新窗口打开|下载CSV
3.3 不同历史时期用水模式差异对咸海入湖水量的影响分析
不同的历史阶段锡尔河流域的用水模式差异显著,本文对不同历史阶段的咸海入湖水量进行敏感性分析,重点量化各历史阶段内咸海入湖水量对不同变量的敏感性以及对不同历史阶段同一变量敏感性的变化。苏联解体之前,咸海入湖水量对径流量、上游水库蓄水、下游灌溉定额、下游农业用水敏感性较大,但其敏感程度有减弱的特征(图7)。苏联解体后,咸海入湖水量对径流量、流入洼地水量、夏季上游放水量、上游水库蓄水量、下游农业用水量等因素的敏感性较大,并呈现加大的趋势。总体看来,整个时段咸海入湖水量对流入洼地水量、上游水库夏季放水量等的敏感性增大,对径流量变化的敏感性在降低,对下游农业用水的敏感性先减小后增大。图7
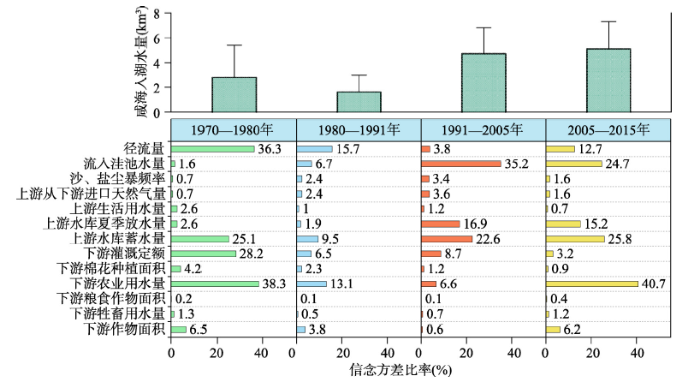 新窗口打开|下载原图ZIP|生成PPT
图7基于信念方差比率的对历史时期咸海入湖水量的敏感性分析
Fig. 7Sensitivity analysis of water inflow to the Aral Sea during historical periods based on ratio of variance of belief
上述特征表明,新建水库使适应径流量变化的能力增强。苏联解体后,中亚国家对水权的争夺加剧,导致流入洼地水量的增多,从而严重影响咸海的入湖水量,这也说明下游国家对灌溉回归水、丰水期的富余水利用不合理,为了争夺水权使得现有国家对咸海生态用水的考虑在减弱。虽然流入洼地的水形成的新湿地、湖泊也具有一定的生态服
务价值,但这无益于缓解咸海生态危机。上游冬季化石能源缺口使得上游水库夏季放水量减少对咸海入湖水量的影响增强,且大于上游从下游进口天然气量的增幅,这与上游试图加大水力发电以弥补由于人口增加带来的更大的能源缺口有关。一个显著变化表现在上游的水力发电不再试图依赖下游化石能源,增加水力发电以保证自身能源安全乃至跻身区域能源出口者行列成为新的目标[25]。实际上这种策略的产生,对水电资源丰富、化石能源短缺而人口高速增长的国家而言,是易于预知的。
3.4 不同情景下“水—能源—食物—生态”纽带关系目标变量对情景变量的响应
基于评估后的贝叶斯网络,能够分析不同来水量与管理情景下目标变量不同状态变化的相对可能性。通过指定输入变量的状态或调整其概率分布,可以预测输出变量各个状态概率的变化。本文以优化流域“水—能源—食物—生态”纽带关系、保证居民生活水平和提升区域合作程度为目标,分析不同情境下目标变量受益程度。尽管某个情景变量可能和其他情景变量相关,但是这种组合效应可以由所有情景变量的影响之和进行表征[35]。因此,本文分析每个情景变量作为情景发生时目标变量的变化(表5)。Tab. 5
表5
表5不同情景下目标变量对情景变量的响应
Tab. 5
| 目标变量 | 情景变量 | |||||||||||
|---|---|---|---|---|---|---|---|---|---|---|---|---|
| RF | DR | EI | UR | WR | IQ | DG | DC | DA | UA | DI | WD | |
| 下游总用水量(低) | -1.2 | +0.2 | +1.2 | +1.7 | -1.6 | -1.8 | +0.3 | |||||
| 上游总用水量(低) | -4.3 | +2.5 | -0.9 | |||||||||
| 下游人均产值(高) | +0.6 | +0.5 | +4.7 | |||||||||
| 上游人均产值(高) | +0.3 | +1.3 | ||||||||||
| 下游畜牧业产值(高) | +5.1 | |||||||||||
| 下游粮食产量(高) | +0.3 | -0.3 | +13.6 | |||||||||
| 上游能源总量(高) | +2.0 | +5.9 | -2.7 | +2.6 | ||||||||
| 咸海入湖水量(高) | +2.4 | +3.6 | +1.3 | +2.3 | +0.5 | +2.6 | +23.5 | |||||
| 咸海水量(高) | +1.5 | +0.6 | +3.5 | |||||||||
| 荒漠面积(低) | +9.6 | |||||||||||
| 土壤盐分含量(低) | +5.5 | |||||||||||
| 沙、盐尘暴频率(低) | +0.1 | +3.7 | +0.8 | +1.1 | ||||||||
| 用水矿化度(低) | +1.3 | |||||||||||
| 下游人均寿命(高) | +0.2 | |||||||||||
新窗口打开|下载CSV
与现状相比,减少流入洼地水量对增加咸海入湖水量最有效(+23.5%),下游对洗盐水、灌溉回归水和富余水的管理存在很大的提升空间。因此需提高洗盐与灌溉用水效率,如增加铺设排盐管、改造老化、渗漏严重的引水渠等,同时增强区域合作,合理利用富余水。增加下游粮食作物种植面积、改良种植结构有助于粮食产量增长(+13.6%)、保证粮食安全,减少高耗水的棉花的种植比例。干旱加剧给咸海和下游生态带来显著的负面影响,对荒漠化(+9.6%)、土壤盐渍化(+5.5%)、沙盐尘暴(+3.7%)、水质(+1.3%)等影响较大。因此需增强对丰水年富余水的储存与利用,以应对干旱。综上所述,本文提出锡尔河流域用水优化模式:提高洗盐与灌溉用水效率,改良种植结构、增加粮食作物占比,并预防干旱危害。
4 讨论
与国际上“水—能源—食物—生态”纽带关系的已有研究[2,3,4]相比,本文区分了干旱区与湿润区的差异、更加侧重于对干旱区脆弱的生态的考虑。相较于耦合建模方法[2,3,4],基于人水系统中的不确定性及其在因果纽带关系网中的传播特征,贝叶斯网络研究方法减小了模型复杂度、降低了建模成本、利用概率测度增强了对不确定性的度量;相较于传统水资源利用优化方法[7,8],增强用水项受到的因果关系约束,提出的用水优化模式考虑更符合实际。此外,对不同历史时期用水模式差异的分析提升了研究的维度,反映出社会背景变化对用水的巨大影响,提升了对复杂人水系统演变过程中因果关系的认知。同时,本文还从以下两个方面讨论本研究中的不足与可改进之处。4.1 贝叶斯网络建模能力
贝叶斯网络能够较好地对人水系统中的复杂因果关系建模,概率分布的形式能有效表达变量的不确定性,敏感性分析能区别不同社会历史背景下的差异。本文的贝叶斯网络分析能取得较好效果,与对先验知识较准确的认知、关键节点较充足的数据量有关。由于国际社会对咸海生态灾难的关注引发了大量科研人员的兴趣,产生的认识与数据支撑了本文网络的搭建与参数化。由于建模过程、数据量和对纽带关系的刻画方式与尺度存在差异,在目前的“水—能源—食物—生态”纽带关系中,耦合建模方法和贝叶斯网络建模效果均很难以量化指标比较。随着网络节点的不断增加与细化,贝叶斯网络可能会不断趋近于耦合模型的精细尺度结构,同样面临如何结合多领域专家知识与数据量不足以支撑网络的难题。因此,研究贝叶斯网络在水资源管理中的最优尺度可能是下一步需要关注的,需要同时考虑对问题的建模效果与模型复杂度和成本。4.2 水资源利用优化前景
未来流域的气候、人口、社会经济发展等可能出现新的显著变化,对纽带中新变化预知能力的不足将限制网络的预测能力。同时,贝叶斯网络难以对未出现过的因素进行评估,如先进的滴灌系统的普及程度。实际上,由情景分析的结果表明减少下游流入洼地水量是增加咸海入湖水量的有效措施,而流入洼地水量来自于富余水和灌溉回归水。苏联解体后的流域分水阿拉木图协议[42],主要是根据解体时的用水比例而确定,但当时咸海入湖水量极低,因此这种方案缺少对咸海生态用水的考虑。下游高负荷的农业生产维持的重要基础,是苏联计划经济体制下充足的中央农业补贴与巨大的农产品需求;解体后下游国家的农业生产规模缩小,需水量减小,但富余水排入洼地而非咸海。逐步推广滴灌系统能减小灌溉对地势的依赖,提高灌溉效率,减少流入洼地的大量灌溉回归水。目前锡尔河流域平均灌溉定额约10000 m3/hm2,而同属亚洲中部干旱区、潜在蒸发量相近的中国新疆,滴灌的平均灌溉定额小于5000 m3/hm2 [43];未来锡尔河流域的滴灌普及率若能达到50%,每年可为咸海节约出约8 km3生态用水,若80%节约的农业用水流入咸海,则咸海年新增入湖水量可达6.4 km3;若普及率提高至80%,每年能为咸海流域节约出约12 km3农业用水,若80%节约的农业用水能流入咸海,则每年新增咸海入湖水量达到9.6 km3以上,有望缓解咸海生态危机。在锡尔河流域,区域合作十分关键,中亚国家在苏联统一管辖下资源协调配置、发展水平较高。而苏联解体后,中亚各国社会经济发展中均存在短板。区域地缘的改变和政治权力的分离程度对于水资源利用的空间格局产生了巨大影响。受迫于流域内人口增长等带来的压力,仅凭流域内国家的调整来应对咸海危机并不现实。对流域的整体可持续发展而言,除了内部的协调与优化(包括节水灌溉、提升区域合作程度等),针对“水—能源—食物—生态”纽带关系中矛盾突出的部分,加强与外部的合作也十分重要。如加强与外部国家能源大国俄罗斯和工业大国中国合作,通过增强水电利用能力、提高灌溉系统效率、促进产业结构升级等,有望逐步实现更稳定与和谐的纽带关系。前提是这些国家必须通过某些组织机构形成有效的合作机制,如“一带一路”“上合组织”等。
5 结论
针对传统水资源规划在干旱区应用时约束条件存在不合理放松、耦合建模方法对数据需求大的缺点,本文基于“水—能源—食物—生态”纽带因果关系和贝叶斯概率网络分析了锡尔河的用水,得出主要结论如下:(1)在较低模型复杂度和成本下,建立的网络精度较高、适用性较好,能够模拟纽带中因果关系的强弱与不确定性、提升对复杂人水系统演变过程中纽带关系变化的认知;
(2)苏联时期,咸海入湖水量对农业开发增长的灌溉用水、上游水库建设的蓄水过程和径流量等较敏感;苏联解体后,因上下游国家发电与灌溉用水的争端,咸海入湖水量对下游国家不合理使用的灌溉水及上游水库蓄水量等节点高度敏感;
(3)提出了锡尔河流域用水优化模式。短期内,需提高洗盐与灌溉用水效率,改良种植结构、增加粮食作物占比,并预防干旱危害。长期而言,若先进节水灌溉的普及度达到50%,减少流入洼地水量,有望使每年新增咸海入湖水量达到6.4 km3以上;若达到80%,每年新增咸海入湖水量将达到9.6 km3以上。同时,流域内各国必须形成有效的合作机制。
参考文献 原文顺序
文献年度倒序
文中引用次数倒序
被引期刊影响因子
DOI:10.1126/science.241.4870.1170URL [本文引用: 2]
DOI:10.1016/j.ejrh.2015.11.010URL [本文引用: 3]
DOI:10.1016/j.jhydrol.2015.12.033URL [本文引用: 3]
DOI:10.1016/j.cosust.2018.04.003URL [本文引用: 3]
DOI:10.1038/nclimate2735URL [本文引用: 1]
DOI:10.1016/j.enpol.2011.04.023URL [本文引用: 2]

Extracting, delivering, and disposing water requires energy, and similarly, many processes for extracting and refining various fuel sources and producing electricity use water. This so-called 'water-energy nexus', is important to understand due to increasing energy demands and decreasing freshwater supplies in many areas. This paper performs a country-level quantitative assessment of this nexus in the MENA region. The results show a highly skewed coupling with a relatively weak dependence of energy systems on fresh water, but a strong dependence of water abstraction and production systems on energy. In case of Saudi Arabia it is estimated that up to 9% of the total annual electrical energy consumption may be attributed to ground water pumping and desalination. Other countries in the Arabian Gulf may be consuming 5-12% or more of total electricity consumption for desalination. The results suggest that policy makers should explicitly consider energy implications in water intensive food imports and future restructuring of water demand. This will help in making more integrated decisions on water and energy infrastructure systems. An integrated assessment may in some cases favor water reuse and changes in the agricultural sector as opposed to the expansion of energy intensive and financially expensive desalination systems. (C) 2011 Elsevier Ltd.
[本文引用: 2]
DOI:10.1016/j.agwat.2012.01.012URL [本文引用: 2]
An integrated optimization method is developed for supporting agriculture water management and planning in Tarim River Basin, Northwest China. The developed method couples two-stage stochastic programming (TSP) with inexact quadratic program (IQP). The hydrological model is provided for forecasting the available irrigation water. The simulation system is then embedded into an optimization framework, where the objective is to maximize the system benefit for water resources management. The developed method can not only deal with nonlinearities in the cost/benefit objective and uncertainties expressed as probabilities and intervals, but also support the analysis of policy scenarios that are associated with economic penalties when the promised water-allocation targets are violated. A case study is conducted for Kaidu-kongque watershed in Tarim River Basin. The results obtained can help generate desired policies for water resources management with maximized economic benefit and minimized system-failure risk. (C) 2012 Elsevier B.V.
DOI:10.1016/j.enpol.2011.09.039URL [本文引用: 2]
The areas of energy, water and food policy have numerous interwoven concerns ranging from ensuring access to services, to environmental impacts to price volatility. These issues manifest in very different ways in each of the three "spheres", but often the impacts are closely related. Identifying these interrelationships a priori is of great importance to help target synergies and avoid potential tensions. Systems thinking is required to address such a wide swath of possible topics. This paper briefly describes some of the linkages at a high-level of aggregation - primarily from a developing country perspective - and via case studies, to arrive at some promising directions for addressing the nexus. To that end, we also present the attributes of a modelling framework that specifically addresses the nexus, and can thus serve to inform more effective national policies and regulations. While environmental issues are normally the 'cohesive principle' from which the three areas are considered jointly, the enormous inequalities arising from a lack of access suggest that economic and security-related issues may be stronger motivators of change. Finally, consideration of the complex interactions will require new institutional capacity both in industrialised and developing countries. (C) 2011 Elsevier Ltd.
DOI:10.1038/nclimate1789URL [本文引用: 1]
DOI:10.1080/02508060.2015.1074148URL [本文引用: 1]
DOI:10.1016/j.cosust.2013.11.002URL [本文引用: 1]
Water, land and energy resources are all crucial contributors to food security. As a result of growing natural resource scarcity, the inter-connectedness of these sectors has become more apparent, as evidenced by growing tradeoffs and the incipient search for cross-sector efficiencies. Proactive engagement by the water, energy, land and food (WELF) sectors with important roles for national governments and international bodies is required to holistically assess and promote investment options that co-balance benefits across different sectors. Nexus assessments need to consider both human well-being and environmental outcomes, that is, the environment has to have 'a seat at the table' for nexus analyses. Outcomes must also be evaluated for the poor, whose well-being is tightly interrelated but often in conflict with maintaining environmental integrity. The Sustainable Development Goals (SDGs) represent a globally significant test for the implementation of nexus thinking.
[本文引用: 1]
DOI:10.1007/s00477-012-0676-8URL [本文引用: 1]
Bayesian networks (BNs) have become a standard in the field of Artificial Intelligence as a means of dealing with uncertainty and risk modelling. In recent years, there has been particular interest in the simultaneous use of continuous and discrete domains, obviating the need for discretization, using so-called hybrid BNs. In these hybrid environments, Mixtures of Truncated Exponentials (MTEs) provide a suitable solution for working without any restriction. The objective of this study is the assessment of groundwater quality through the design and application of a probabilistic clustering, based on hybrid Bayesian networks with MTEs. Firstly, the results obtained allows the differentiation of three groups of sampling points, indicating three different classes of groundwater quality. Secondly, the probability that a sampling point belongs to each cluster allows the uncertainty in the clusters to be assessed, as well as the risks associated in terms of water quality management. The methodology developed could be applied to other fields in environmental sciences.
DOI:10.1002/ieam.1509URL [本文引用: 1]
The Relative Risk Model (RRM) is a tool used to calculate and assess the likelihood of effects to endpoints when multiple stressors occur in complex ecological systems. In this study, a Bayesian network was used to calculate relative risk and estimate uncertainty (BN-RRM) in the Puyallup River Watershed. First, we calculated the risk of prespawn mortality of coho salmon. Second, we evaluated the effect of low impact development (LID) as a means to reduce risk. Prespawner mortality in coho salmon within the Puyallup watershed was the endpoint selected for this study. A conceptual model showing causal pathways between stressors and endpoints was created to show where linkages exist. A relative risk gradient was found throughout the watershed. The lowest risk was found in risk regions with the least urban development, and the greatest risk of prespawner mortality was found in the highly urbanized risk regions with the largest amounts of impervious surface. LID did reduce risk but only when implemented at high intensities within the urban watersheds. The structure of the BN-RRM also provides a framework for water quality- and quantity-related endpoints within this and other watersheds. The framework is also useful for evaluating different strategies for remediation or restoration activities. The adaptability of using BNs for a relative risk assessment provides opportunities for the model to be adapted for other watersheds in the Puget Sound and Salish Sea region. Integr Environ Assess Manag 2014;10:269-278. (c) 2013 SETAC
DOI:10.1111/fwb.12655URL [本文引用: 1]
[本文引用: 1]
DOI:10.1002/wrcr.20496URL [本文引用: 1]
DOI:10.1016/j.jenvman.2012.11.011URL [本文引用: 1]
DOI:10.1071/MF12141URL [本文引用: 1]
Agricultural intensification often has complex effects on a wide range of environmental and economic values, presenting planners with challenging decisions for optimising sustainable benefits. Bayesian Belief Networks (BBNs) can be used as a decision-support tool for evaluating the influence of development scenarios across a range of values. A BBN was developed to guide decisions on water abstraction and irrigation-driven land use intensification in the Hurunui River catchment, New Zealand. The BBN examines the combined effects of different irrigation water sources and four land development scenarios, with and without a suite of on-farm mitigations, on ground and surface water quality, key socioeconomic values (i.e. farm earnings and jobs, and contribution to regional gross domestic production (GDP)) and aquatic values (i.e. salmon, birds, waterscape, contact recreation, periphyton and invertebrates). It predicts high farm earnings, jobs and regional GDP with 150% increase in irrigated area, but a range of positive and negative aquatic environmental outcomes, depending on the location of water storage dams and the application of a suite of on-farm mitigations. This BBN synthesis of a complex system enhanced the ability to include aquatic values alongside economic and social values in land-use and water resource planning and decision making, and has influenced objective setting in Hurunui planning processes.
DOI:10.3390/w7105617URL [本文引用: 1]
DOI:10.1111/j.1539-6924.2010.01499.xURL [本文引用: 1]
DOI:10.1007/s11069-014-1302-5URL [本文引用: 1]
Drinking water security is a life safety issue as an adequate supply of safe water is essential for economic, social and sanitary reasons. Damage to any element of a water system, as well as corruption of resource quality, may have significant effects on the population it serves and on all other dependent resources and activities. As well as an analysis of the reliability of water distribution systems in ordinary conditions, it is also crucial to assess system vulnerability in the event of natural disasters and of malicious or accidental anthropogenic acts. The present work summarizes the initial results of research activities that are underway with the intention of developing a vulnerability assessment methodology for drinking water infrastructures subject to hazardous events. The main aim of the work was therefore to provide decision makers with an effective operational tool which could support them mainly to increase risk awareness and preparedness and, possibly, to ease emergency management. The proposed tool is based on Bayesian Belief Networks (BBN), a probabilistic methodology which has demonstrated outstanding potential to integrate a range of sources of knowledge, a great flexibility and the ability to handle in a mathematically sound way uncertainty due to data scarcity and/or limited knowledge of the system to be managed. The tool was implemented to analyze the vulnerability of two of the most important water supply systems in the Apulia region (southern Italy) which have been damaged in the past by natural hazards. As well as being useful for testing and improving the predictive capabilities of the methodology and for possibly modifying its structure and features, the case studies have also helped to underline its strengths and weaknesses. Particularly, the experiences carried out demonstrated how the use of BBN was consistent with the lack of data reliability, quality and accessibility which are typical of complex infrastructures, such as the water distribution networks. The potential applications and future developments of the proposed tool have been also discussed accordingly.
[本文引用: 1]
DOI:10.1146/annurev.earth.35.031306.140120URL [本文引用: 7]
[本文引用: 1]
DOI:10.1016/S0308-521X(02)00028-8URL [本文引用: 2]
URL [本文引用: 1]
Kyrgyz Republic lies in the core of central Asia, with mountains everywhere and glaciers forming and melting widely. It is rich in water resources in Kyrgyzstan, which is called “water towers” and controls water resources life-line of the five central Asia countries. There is large potential and strong desire for economic growth and social development in Kyrgyzstan. It is positive to analyze the water development and utilization of Kyrgyzstan for seeking a right way to solve the central Asia water resource problems. Firstly, the paper introduces its physical geography and conditions related to water resource generation, such as climate, topography and geomorphology, glacier and snowmelt and puts forward the total quantity of water resources in Kyrgyzstan. Secondly, on the basis of describing its social-economy variations since its independence, it analyzes the main water resource development projects, hydropower and variations of water usage. Finally, it discuses the main results and problems in the process.
URL [本文引用: 1]
Kazakhstan occupies an important position in central Asian area from the angle of country area, mine resources, water resources, population and economic aggregate. The Kazakhstan′s water resources development and utilization state has representation in central Asian area. Therefore, studying Kazakhstan′s water resources has important theory value and significance to maintain the man-water harmony and water resources sustainable development of central Asian area. The paper introduces the physical geography and water resources condition in brief, gives an assessment to surface and ground water quantity, and also total amount of water resources. Based on the overview of the economic society and development after its independence, the paper reviews the process of water resources engineering and irrigation system, especially gives an analysis of Kazakhstan′s water resources development and utilization (including total amount of water consumption, agricultural water and supply-need condition) and development circumstance after 1991 in detail, and gives an judgment to actual problems during water resources development and utilization. Finally, the paper makes an deep analysis of the related problems in the water exploitation.
[本文引用: 1]
[本文引用: 1]
DOI:10.1016/j.ecolmodel.2006.11.033URL [本文引用: 1]
[本文引用: 1]
[本文引用: 1]
[本文引用: 2]
DOI:10.1139/x06-135URL [本文引用: 1]
DOI:10.1016/j.ecolmodel.2012.01.013URL [本文引用: 3]
This paper presents a selected set of existing and new metrics for gauging Bayesian network model performance and uncertainty. Selected existing and new metrics are discussed for conducting model sensitivity analysis (variance reduction, entropy reduction, case file simulation); evaluating scenarios (influence analysis); depicting model complexity (numbers of model variables, links, node states, conditional probabilities, and node cliques); assessing prediction performance (confusion tables, covariate and conditional probability-weighted confusion error rates, area under receiver operating characteristic curves, k-fold cross-validation, spherical payoff, Schwarz' Bayesian information criterion, true skill statistic, Cohen's kappa); and evaluating uncertainty of model posterior probability distributions (Bayesian credible interval, posterior probability certainty index, certainty envelope, Gini coefficient). Examples are presented of applying the metrics to 3 real-world models of wildlife population analysis and management. Using such metrics can vitally bolster model credibility, acceptance, and appropriate application, particularly when informing management decisions. Published by Elsevier B.V.
[本文引用: 1]
DOI:10.1016/j.ecolecon.2008.02.012URL [本文引用: 1]
DOI:10.1016/0004-3702(88)90015-XURL [本文引用: 1]
DOI:10.11821/dlxb201809015URL [本文引用: 1]
This study, taking the Weihe River Basin in the Guanzhong-Tianshui Economic Region of China as a case, establishes a water conservation ecosystem service network model. Based on Bayesian belief networks, the model forecasts the distribution probability of water conservation ecosystem services projected under different land-use scenarios for the year 2050 with a CA-Marcov model. A key variable subset method is proposed to optimize the spatial pattern of the water conservation ecosystem service. There were three key study findings. First, under the protection scenario, the area of woodland increased by 18.12%, mainly from the conversion of cultivated land. The grassland and cities increased by 0.73% and 0.38%, respectively. The water and unused land were reduced by 5.08% and 0.92%, respectively. The probability of high water conservation value under this scenario is the largest in the three scenarios, and the design of protection scenario is conducive to the formulation of future land use policies. Second, the key factors influencing water conservation ecosystem service include precipitation, evapotranspiration and land use. The state set corresponding to the highest state of water conservation ecosystem service is {precipitation = Highest, evapotranspiration = High, land use = High}, mainly distributed in areas with high annual average rainfall and evapotranspiration and high vegetation coverage. Third, the regions suitable for optimizing water conservation ecosystem service are mainly distributed in the southern part of Maiji District in Tianshui, southwest of Longxian and south of Weibin District in Baoji, northeast of Xunyi County and northwest of Yongshou County in Xianyang, and west of Yaozhou District in Tongchuan. Identifying the optimization regions of water conservation ecosystem service based on Bayesian belief networks, not only helps to develop a better understanding of the water conservation ecosystem services processes, but also increases the rationality of the scenario design and pattern optimization. On this basis, the key variable subset method is crucial to sound eco-environment construction and policy formulation in the study area.
[本文引用: 1]
[本文引用: 1]
DOI:10.1016/j.agwat.2013.06.014URL [本文引用: 1]
