 ,2,3, 高兴川41.
 2.
3.
4.
Comparison of inter-city travel network during weekdays and holiday in China
LI Tao1,2, WANG Jiao'e,2,3, GAO Xingchuan41. 2.
3.
4.
通讯作者:
收稿日期:2018-09-21修回日期:2019-11-28网络出版日期:2020-04-25
| 基金资助: |
Received:2018-09-21Revised:2019-11-28Online:2020-04-25
| Fund supported: |
作者简介 About authors
李涛(1985-),男,山西长治人,博士后,副教授,硕士生导师,主要从事交通运输地理研究E-mail:taoli-2008@163.com。

摘要
关键词:
Abstract
Keywords:
PDF (7668KB)元数据多维度评价相关文章导出EndNote|Ris|Bibtex收藏本文
本文引用格式
李涛, 王姣娥, 高兴川. 中国居民工作日与节假日的城际出行网络异同性研究. 地理学报[J], 2020, 75(4): 833-848 doi:10.11821/dlxb202004012
LI Tao.
1 引言
信息化与全球化的快速发展,技术、社会与空间的复杂交互作用推动着主导的空间组织逻辑由地方空间(Space of Places)向流动空间(Space of Flows)转变[1]。社会经济与高速交通技术迅速发展所产生的“时空压缩”效应在大大增强居民可移动性的同时,城际出行也逐步呈现出规模化、常态化、动态化和复杂化特征。在此背景下,基于“流空间”理论与网络化视角研究城际出行对于掌握区域尺度上居民空间移动规律和城际空间关联动态特征具有重要意义。城际出行网络是由城市、城市间的硬件链接网络及之上的居民空间移动流三大要素组成。目前,国内外对城际出行网络的研究大致分为3类:基于城际出行流反演的城市网络研究、人口流动网络研究和城际出行(通勤、长距离出行)网络研究。既有对城市网络的研究主要基于基础设施[2,3,4,5,6]、企业组织[7,8,9,10]、社会文化联系[11]3类主体所构建的关系流展开。在城际出行流反演的城市网络研究方面,主要利用公路、铁路和航空等方式客货流数据构建城市网络进而揭示其组织结构特征。如基于铁路和航空流对比的中国城市网络结构研究所揭示的地域空间组织规律[12,13,14];随着网络复杂化程度的增加,复杂网络理论与方法成为主要的研究工具[15,16]。在人口流动网络研究方面,主要集中于利用人口普查数据或1%人口抽样调查数据对人口流动格局、影响因素等方面的研究[17,18]。在城际出行网络方面,主要集中在利用长距离出行调查和通勤调查数据直接揭示城际出行网络特征。Limtanakool等基于欧洲长途区际出行调查数据对分别由商务流、旅游流和休闲流构成的城际出行网络进行了对比研究,揭示出不同出行目的下的行为特征差异和网络结构异质性[19];De Montis等基于意大利城际通勤数据构建了城际出行网络,并利用复杂网络方法对城际出行(通勤)系统的结构特征进行了分析[20];Neal基于美国航空流数据,系统地探讨了不同性质航空流(商务流和旅游流)和不同季节航空流(夏季和冬季)所构成的网络特征差异[21]。近年来,基于位置服务技术的大数据使得居民出行实时动态记录成为可能,该数据在揭示春运期间人口流动格局中得到了应用。例如,刘望保等[22]、魏冶等[23,24]对中国城市间人口日常流动格局、春运期间人口流动空间格局特征进行了系统研究。
国内外直接对城际出行网络的研究主要集中在长距离城际出行与人口迁徙网络特征的研究方面,针对不同城际出行网络的比较研究集中在不同性质出行构成的网络比较上,专门针对工作日和节假日的城际出行网络对比研究并不多见。居民出行目的、出行时间以及地域属性的差异都会导致出行行为的异质性。工作日与节假日具有完全不同的时间属性,且出行目的差异较大,开展基于工作日和节假日的城际出行网络对比研究,可在一定程度上揭示不同时段的城际出行网络结构特征差异。据此,本文利用“腾讯迁徙”记录的城际居民出行数据,构建有向加权居民城际流动联系矩阵,从城市节点、城际关联和网络集聚3个层面对工作日和国庆黄金周中国城际出行网络结构异同特征进行分析,旨在从时间维度解读中国城际出行网络的发育特征,并间接透视工作日与节假日不同出行行为所形成的城际空间关联动态特征。
2 数据与研究方法
2.1 研究思路
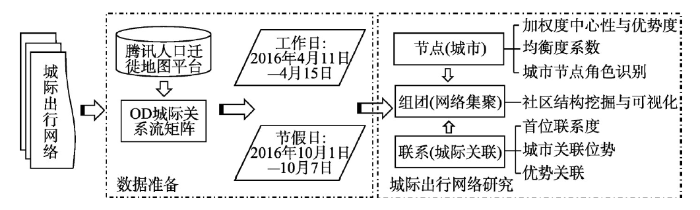
本文以2016年4月11日—4月15日和2016年10月1日—10月7日分别代表工作日和节假日(以下称黄金周)时段,获取全国362个城市(包括中国大陆293个地级行政单元、4个直辖市和65个县级行政单元)在上述两个时段的腾讯人口迁徙流数据,并据此构建OD城际关系流矩阵;按照节点(城市)—联系(城际关联)—组团(网络集聚)逻辑关系,首先分别对工作日和节假日时段城市节点等级结构与空间格局特征、城际联系空间分布进行了比较,并在此基础上,从网络整体集聚角度利用社区结构挖掘与可视化模型对两时段中国城际出行网络进行组团划分,比较分析城际出行网络组团在工作日和节假日的动态变化特征及其形成因素;最后对本研究的主要结论和讨论进行了分析总结(图1)。图1
 新窗口打开|下载原图ZIP|生成PPT
图1研究思路与框架
Fig. 1Analytical framework
2.2 数据收集与基本特征
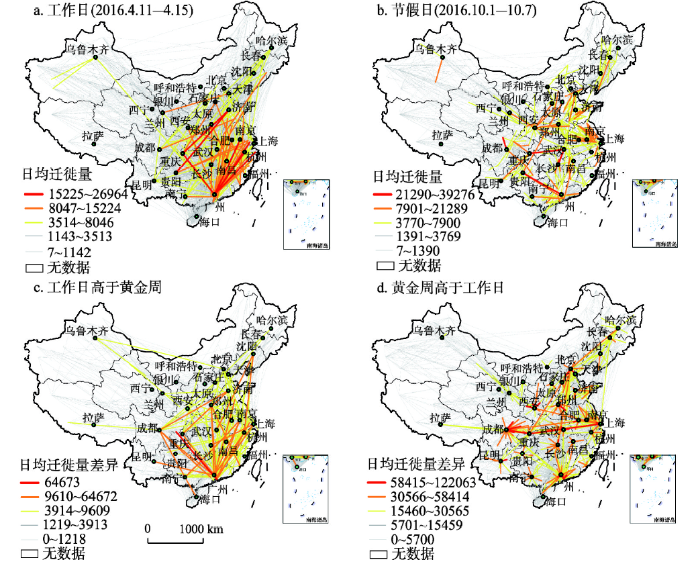
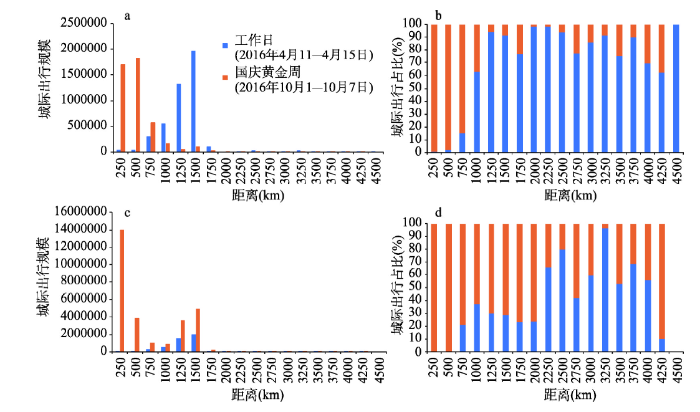
腾讯人口迁徙数据的主要特点是:① 提供了以地级市为主要单元、每日迁入、迁出各城市排名前10位的记录。② 识别了基于公路、铁路、航空3种单交通方式和综合3种方式的流动数据。本文采用基于综合方式的居民出行数据。采用大数据研究居民出行空间特征时,数据的无量纲测度和相对指标要优于绝对数值所反映的特征[25]。本文所采用数据也是无量纲测度的人口出行规模,虽并非人口出行量的绝对数值,但亦可从规模、结构等方面反映城际出行网络的空间格局与特征。虽然腾讯平台只提供了各市的前10位流入和流出记录,但其余人口流动记录可通过其他城市记录予以适当补充以刻画出全国人口城际出行规律,该数据已在揭示春运期间中国城市发展特征中得到了应用[26]。腾讯人口流动数据以日为统计单位,可覆盖用户大部分长、短途完整出行行为,在一定程度上避免了长途数据的低估和短途的虚增问题。本文利用“腾讯人口迁徙地图”平台,获取了2016年4月11日—4月15日(工作日)①(①为了避免数据误差,准确揭示工作日出行一般特征,本文取周一至周五共5 d作为工作日出行数据。)和2016年10月1日—10月7日(简称黄金周)两个时段共12天的出行数据,共涉及全国362个城市。在此基础上,构建了以城市为节点、人口流动为边的有向加权城际人口出行矩阵。分析发现,中国居民黄金周的日均出行规模基本为工作日的2倍以上(表1),且主要表现为以核心城市为枢纽向周边城市的短距离出行占主导的特点,工作日则主要表现为长距离出行特征(图2)。Tab. 1
表1
表1工作日与黄金周中国城际出行网络规模统计
Tab. 1
| 时间 | 节点数 | 边数 | 联系总值 | 平均值 | 最大值 | 最小值 | CV |
|---|---|---|---|---|---|---|---|
| 工作日 | 362 | 8430 | 34817749 | 4130 | 191590 | 7 | 2.22 |
| 黄金周 | 362 | 8588 | 72681843 | 8463 | 263724 | 7 | 1.94 |
新窗口打开|下载CSV
图2
 新窗口打开|下载原图ZIP|生成PPT
图22016年中国工作日与黄金周中国城际出行网络空间差异
注:基于国家测绘地理信息局标准地图服务网站下载的审图号为GS(2019)1823号的标准地图制作,底图无修改;a和b: 不重合关联差异;c和d: 重合关联差异。
Fig. 2The difference of intercity travel network between workdays and golden week in China
2.3 研究方法
2.3.1 城市位势测度指标 为揭示城市在网络中的位势,本文选用加权度中心性(WDCi)指数[27]和城市加权优势度系数(DITi)[28]两个指标,计算公式分别为:式中:Ti为网络中城市i的流入流出人口规模总和;J为网络中城市总数量,且i ≠ j;Di为城市i的度值,等于城市i的出度与入度之和;α为赋值参数,本文取值0.5;WDCi表征城市i在网络的绝对位势,该值越大,城市i在整个网络中的绝对位势等级越高;DITi表征城市i在网络中的相对优势,说明整个城际出行网络中各城市相对优势度水平的高低,该值越大,城市i相对优势度越强,DITi大于1,说明该城市的优势度高于网络平均水平。
为从整体上揭示网络中城市等级结构特征,参考熵值概念,引入城市均衡度系数ODIc[28],计算公式为:
式中:Zi表示城市i相关联的边强度之和与网络中所有城市关联边强度之和的比例;I表示网络中城市的数量。0 ≤ ODIc ≤ 1;当ODIc = 0时,表明网络中城市等级差异最大,该指数可用来说明整个城际出行网络中各城市等级差异水平。
2.3.2 城际关联位势测度指标 城际关联位势主要从边角度表征网络中任一对城际关联边的重要性,计算公式为[28]:
式中:tij为城市i和j之间的人口出行总规模,且i ≠ j;RSIij为城际关联优势度,表征的是整个出行网络中某一城市对联系强度占总联系强度的比例,0 ≤ RSIij ≤ 1,该值越接近于1,说明城市i与城市j关联对占总比例越高,优势度越高。
2.3.3 社区结构挖掘与可视化模型 考虑到本文构建了有向加权网络且网络数据表征了城际间实际关系流,因此采取Rosvall等提出的基于流数据Infomap算法识别社区结构[29]。该方法在进行社区挖掘时综合考虑了节点权重、连边权重和连接方向等拓扑属性,在挖掘具有实际流相互作用的网络社区结构中得到了很好的应用[6, 26]。为了直观比较两时段城际出行网络组团变化特征,本文利用Rosvall提出的冲积图(Alluvial Diagram)进行网络组团可视化比较[30],组团挖掘以及冲积图的绘制借助Map equation平台完成(
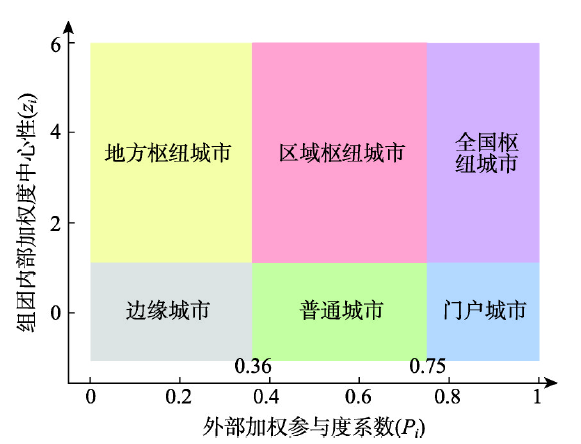
2.3.4 城市角色识别模型 本文采用Guimera等****提出的组内—组间重要性参数比较方法实现对网络中城市角色的划分[31]。基于网络中相似城市具有相似拓扑结构的特性,该方法的基本思路是在组团结构识别基础上,将城市在其所属组团内部连通性水平和在网络中所有组团外部连通性水平进行比较从而对城市角色进行识别。具体步骤为:① 计算城市在归属组团内部连通水平(zi),zi值越大,表明该城市在组团内部加权度中心性越高,反之亦然;② 计算城市与各个组团(包括归属组团)城市的外部连通水平,可称之为外部加权参与度系数(Pi),该指标表征的是与城市i相关的连接在不同组团之间的分配均衡水平,0 ≤ Pi ≤ 1,越接近于1,表明与城市i直接关联的连接趋于均衡的分配在各个组团,反之亦然;③ 分别以Pi和zi为横纵坐标进行可视化,基于数据的实际分布情况确定临界值并进行城市角色分类(图3)。组团内部加权度中心性(zi)和外部加权参与度系数(Pi)的计算公式为:
式中:Ki为城市i在归属组团Si的加权度中心性;
图3
 新窗口打开|下载原图ZIP|生成PPT
图3基于组内—组间重要性参数比较方法的城市角色甄别图示
Fig. 3Diagram of city role screening based on the method of intra-inter group importance parameter
3 中国城际出行网络等级结构与空间格局
3.1 城市节点
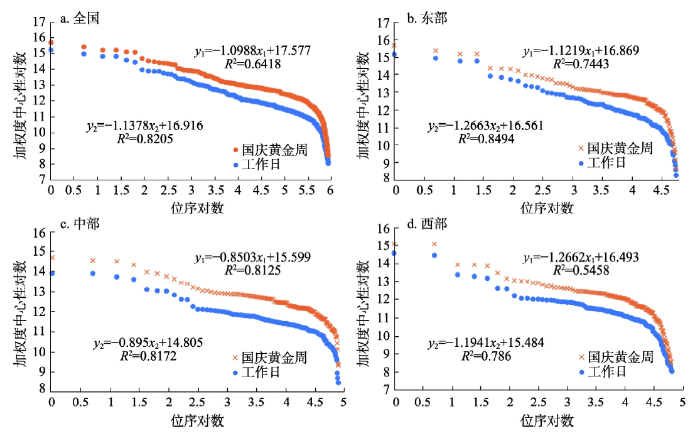
3.1.1 等级规模结构 工作日和黄金周网络度中心性均值分别为44.8和45.7,在不考虑权重的情况下各城市平均直接关联城市数基本一致。考虑权重时,两时段城市加权度中心性均值分别为185200和386605,相较于工作日,黄金周城市平均直接关联人口出行规模翻了一番。加权节点优势度均值也从工作日的3.91增加到了黄金周的5.09,黄金周出行规模显著高于工作日。两时段城市等级规模结构呈现出典型的帕累托分布模式,黄金周更趋扁平化(表2)。工作日和黄金周的城际出行网络节点均衡度系数(ODIc)分别为0.84和0.88,总体分布较为均衡,但相较于工作日,黄金周时段节点等级规模均衡性更为显著,更趋扁平化。利用位序—规模法则[32]分别对全国和东中西三大地带城市等级规模结构进行拟合(图4)。工作日与黄金周城际出行网络加权度中心性与其位序的拟合优度分别为0.64和0.82,说明基于人口出行数据的中国城际出行网络节点等级结构符合位序—规模分布特征。从齐夫(Zipf)参数q值来看,两时段的q值均大于1,且黄金周q值小于工作日,表明基于加权度中心性的城际出行网络节点等级规模结构呈现出典型的帕累托分布特征。黄金周时段,在出行频率和规模普遍增加的情况下,三大地带间差异显著降低。据国家旅游局统计数据显示,2016年国庆黄金周期间全国共接待游客5.93亿人次,说明黄金周长假闲暇时间和收入水平的增加带来的黄金周旅游出行人次的大幅增加在全国整体和东中西三大地带均得到了直接体现。三大地带内部加权节点优势度与其位序的拟合优度均在0.7以上,符合位序—规模分布特征。
Tab. 2
表2
表22016年工作日与黄金周中国城际出行网络结构指标统计
Tab. 2
| 区域 | 时段 | Zipf参数(q) | 拟合优度(R2) | 加权度中心性均值(WDCi) | 加权优势度均值(DITi) | 节点均衡度系数(ODIc) |
|---|---|---|---|---|---|---|
| 全国 | 工作日 | 1.1378 | 0.8205 | 185 200 | 3.91 | 0.84 |
| 黄金周 | 1.0988 | 0.6418 | 386 605 | 5.09 | 0.88 | |
| 东部 | 工作日 | 1.2663 | 0.8494 | 305 006 | 6.48 | 0.80 |
| 黄金周 | 1.1219 | 0.7443 | 581 193 | 7.67 | 0.85 | |
| 中部 | 工作日 | 0.8950 | 0.8172 | 130 740 | 2.72 | 0.89 |
| 黄金周 | 0.8503 | 0.8125 | 322 530 | 4.21 | 0.91 | |
| 西部 | 工作日 | 1.1941 | 0.7860 | 126 287 | 2.65 | 0.79 |
| 黄金周 | 1.2662 | 0.7458 | 265 015 | 3.47 | 0.83 |
新窗口打开|下载CSV
图4
 新窗口打开|下载原图ZIP|生成PPT
图42016年工作日和黄金周中国城际出行网络节点加权优势度位序—规模分布拟合
Fig. 4Rank-size distribution of city DITi of intercity travel network for workdays and golden week in 2016
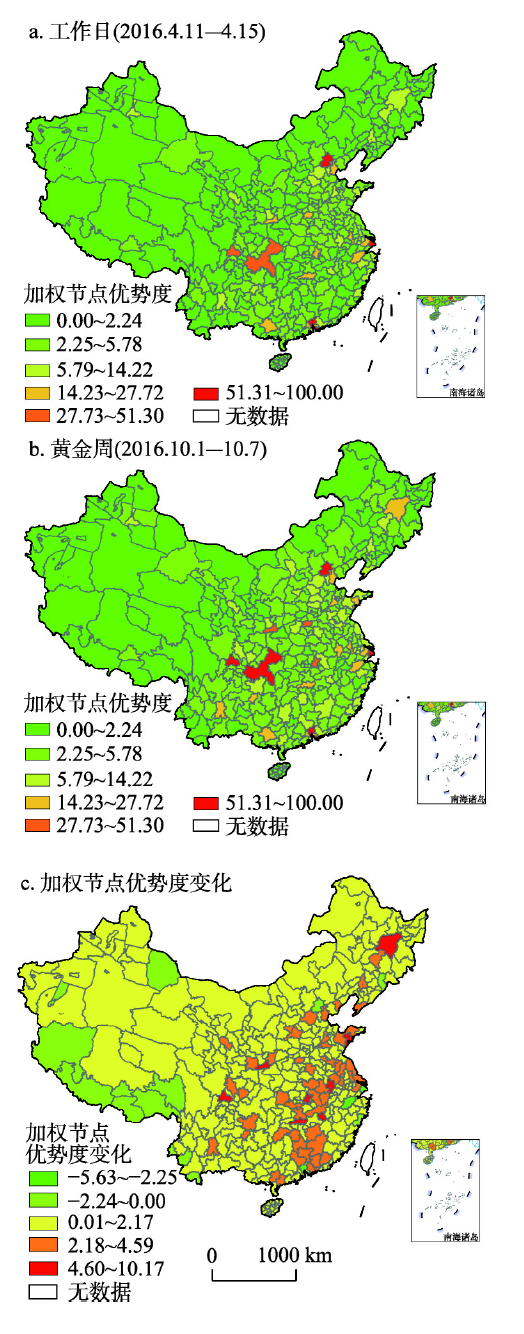
3.1.2 空间分布特征 高速交通发展所带来的“时空压缩”效应对扩大出行距离、拓展活动空间发挥了重要作用。加权优势度高值地区在长三角地区、珠三角地区、京津冀地区和山东半岛地区分别沿京沪高铁沿线、穗莞深沿线和胶济客运专线带状扩展(表3、图5)。具体来说,两时段前6位城市一致,包括北京、上海、深圳、广州、重庆和成都;其余14个城市主要包括京津冀、长三角、珠三角与成渝四大城市群次级核心城市和其余城市群核心城市,如天津、南京、杭州、苏州、武汉、西安和长沙等地。与刘望保等[22]的研究类似,厦漳泉地区和东北地区未有城市能出现在前20位名单中。两时段比较,除北京、上海、深圳、广州、郑州和武汉外,其余城市位序均发生变化。其中重庆和成都位序相互替换;杭州、西安、苏州、天津和昆明的位序明显提升,西安从工作日的第12位上升到黄金周的第8位,旅游吸引力在其中起到了主要作用。东莞、佛山和南宁等城市的位序则显著降低。从加权节点优势度值来看,与工作日相比,广州、深圳、上海的加权优势度显著降低,分别降低了5.63、5.44和3.06。41个城市加权优势度发生显著提升,平均提升了3.96。提升幅度较大的城市集中分布在京津冀、长三角、珠三角与成渝四大城市群外围地区以及山东半岛、辽中南、哈长城市群等核心城市,武汉、成都、西安等交通枢纽城市、旅游城市提升幅度最大,变化量分别为10.17、10.06和8.57。
Tab. 3
表3
表3城际出行网络城市加权优势度、绝对变化与相对变化前20位城市
Tab. 3
| 位序 | 加权节点优势度(DITi) | 变化量 | |||||
|---|---|---|---|---|---|---|---|
| 工作日 | DITi | 黄金周 | DITi | 黄金周—工作日 | |||
| 1 | 北京 | 100.00 | 北京 | 100.00 | 武汉 | 10.17 | |
| 2 | 上海 | 78.19 | 上海 | 75.13 | 成都 | 10.06 | |
| 3 | 深圳 | 66.88 | 深圳 | 61.44 | 西安 | 8.57 | |
| 4 | 广州 | 66.65 | 广州 | 61.02 | 长沙 | 5.44 | |
| 5 | 重庆 | 51.30 | 成都 | 54.94 | 青岛 | 5.42 | |
| 6 | 成都 | 44.88 | 重庆 | 52.50 | 哈尔滨 | 5.31 | |
| 7 | 东莞 | 27.72 | 杭州 | 35.20 | 合肥 | 5.27 | |
| 8 | 杭州 | 25.82 | 西安 | 29.75 | 南昌 | 5.22 | |
| 9 | 郑州 | 25.10 | 郑州 | 28.85 | 苏州 | 4.59 | |
| 10 | 武汉 | 25.03 | 武汉 | 26.78 | 南京 | 4.35 | |
| 11 | 南京 | 22.43 | 东莞 | 26.39 | 赣州 | 4.11 | |
| 12 | 西安 | 21.18 | 苏州 | 25.36 | 惠州 | 4.07 | |
| 13 | 苏州 | 20.77 | 长沙 | 23.94 | 大连 | 3.98 | |
| 14 | 长沙 | 18.50 | 南京 | 23.57 | 郑州 | 3.75 | |
| 15 | 佛山 | 15.91 | 天津 | 18.52 | 衡阳 | 3.68 | |
| 16 | 南宁 | 15.24 | 佛山 | 17.87 | 沈阳 | 3.64 | |
| 17 | 天津 | 15.20 | 昆明 | 16.60 | 烟台 | 3.53 | |
| 18 | 济南 | 14.22 | 济南 | 16.59 | 盐城 | 3.44 | |
| 19 | 昆明 | 13.86 | 合肥 | 16.44 | 清远 | 3.39 | |
| 20 | 贵阳 | 12.56 | 南宁 | 16.30 | 天津 | 3.32 | |
新窗口打开|下载CSV
图5
 新窗口打开|下载原图ZIP|生成PPT
图5中国城际出行网络加权节点优势度及其变化空间格局
注:基于国家测绘地理信息局标准地图服务网站下载的审图号为GS(2019)1823号的标准地图制作,底图无修改。
Fig. 5Spatial distribution of city DITi and its absolute changes for workdays and golden week
3.1.3 城市角色识别 准确把握网络中节点角色对于解析、理解城际出行网络至关重要,特别是在网络规模庞大、相互关系复杂的情况下尤为如此。利用组内—组间重要性参数比较方法对城市角色进行识别(图6)。省会城市和主要中心城市承担了枢纽城市功能,两时段枢纽和非枢纽城市数量分别为34个、33个、328个和329个,所占比例分别为9.39%、9.12%、90.61%和90.88%。工作日,北京、成都、上海、广州、深圳、重庆、昆明和西安等12个城市的Pi值大于0.75,表明与这些城市的联系较为均匀的分布在各组团,这些城市不仅是各自归属组团的枢纽城市,同时也担负了与其他组团城市联系的功能,承担全国性枢纽城市角色。其余22个省会城市和区域中心城市承担区域性枢纽功能。黄金周时段,北京、上海、深圳、重庆和三亚Pi值大于0.75,乌鲁木齐、南宁、太原、济南、青岛、大连和合肥等原有区域枢纽城市则出现在地方枢纽类型中,相较于工作日,黄金周出行更为分散。就非枢纽城市来说,工作日,边缘城市103个,占比达到28.45%;黄金周,边缘城市增加到182个,占比达到50.56%。中心城市和省会城市在各自归属组团内承担着政治、经济和文化中心功能,从而与组团内非枢纽城市有着高强度联系。
图6
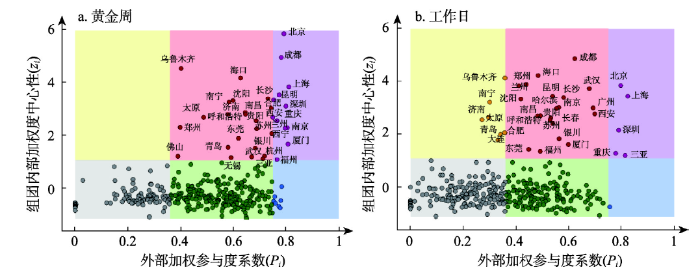 新窗口打开|下载原图ZIP|生成PPT
图6城市角色划分
Fig. 6Division of city roles
3.2 城际网络联系
(1)工作日首位联系城市数量高于黄金周,但后者中心城市枢纽地位更为突出从首位城市联系数量来看,工作日全国首位联系城市为71个,各城市平均关联5个城市(图7)。其中,关联城市达到10个以上的首位城市包括北京、广州、成都、上海、武汉、郑州、沈阳等14个城市;黄金周首位联系城市数量减少到57个,平均关联6个城市,表明各城市趋向于与少数城市取得直接联系。关联城市达到10个以上的首位城市数量增加到17个,新增哈尔滨、兰州、昆明、重庆。首位联系强度指标表征了各城市对其首位城市的依赖程度[33],工作日和黄金周的首位联系强度均值分别为0.18和0.12,相比于工作日集聚的城市关联,黄金周节假日出行特征使得城市网络关联集聚程度降低。大理、成都、杭州、昆明、拉萨、西安、郑州和武汉等旅游城市、交通枢纽城市首位联系强度得到提升,广州、上海和北京等中心城市首位联系强度显著下降。
图7
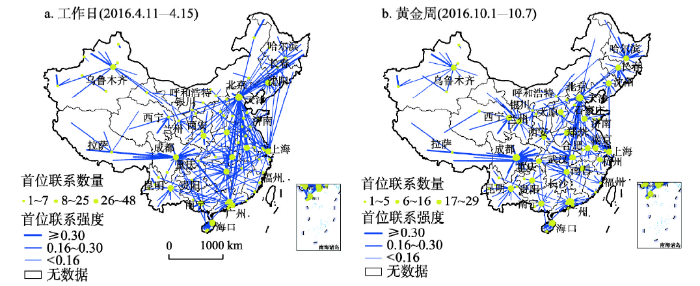 新窗口打开|下载原图ZIP|生成PPT
图72016年工作日与黄金周中国城际出行网络首位联系空间格局
注:基于国家测绘地理信息局标准地图服务网站下载的审图号为GS(2019)1823号的标准地图制作,底图无修改。
Fig. 7Spatial distribution of dominant flow of intercity travel network for workdays and golden week
(2)长途区际出行构成了工作日出行联系的主体,覆盖空间范围高于黄金周
采用Natural Breaks(Jenks)方法将两时段城际联系优势度值划分为6级。第一等级至第四等级空间格局如图8所示。工作日,第一等级联系城市对共有11对,核心城市包括北京、上海、广州、深圳、重庆以及珠三角城市群内部的佛山和东莞。黄金周,第一等级联系城市对仅有1对,位于珠三角深圳—东莞间。珠三角城市群内部城际出现同时出现在工作日和黄金周第一等级中,与京津冀和长三角地区相比,珠三角城市群多中心一体化发展程度显著高于前两者。长途区际出行构成了两时段第二等级联系的主体,且工作日空间影响范围高于黄金周。其中,工作日涉及的城市20个,在原有一级联系城市基础上增加了武汉、长沙、南京、杭州、西安、苏州、长春等核心城市以及邻近城市(廊坊、保定、惠州、咸阳、广安)。黄金周涉及城市17个,受黄金周出游、探亲出行的增加,黄冈、渭南等次级城市出现在了第二等级联系中。第三、四等级联系进一步向西部和东北地区扩展,工作日第三、四等级联系城市对分别为118对和667对,占城市对总量比例分别为1.40%和7.90%,黄金周第三、第四等级联系分别130对和720对,占城市对总量的比例分别为1.51%和8.38%。
图8
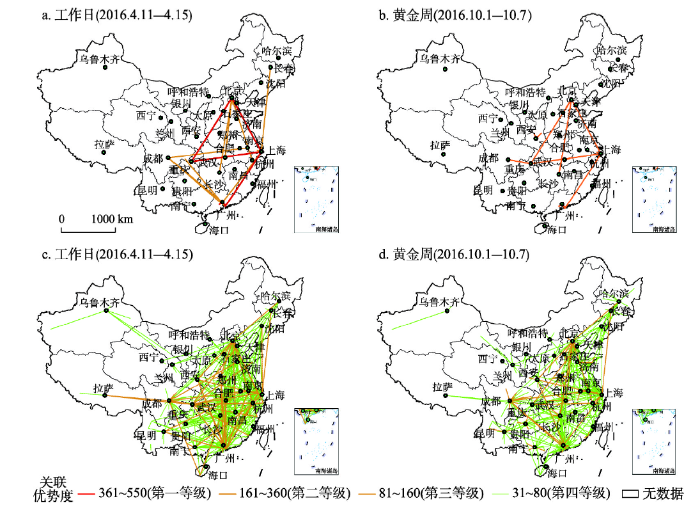 新窗口打开|下载原图ZIP|生成PPT
图82016年工作日与黄金周中国城际出行网络空间格局比较
注:基于国家测绘地理信息局标准地图服务网站下载的审图号为GS(2019)1823号的标准地图制作,底图无修改。
Fig. 8Comparison of spatial distribution of intercity travel network for workdays and golden week
(3)黄金周出行网络空间邻近效应明显,各区域核心城市主要与周边次级城市联系
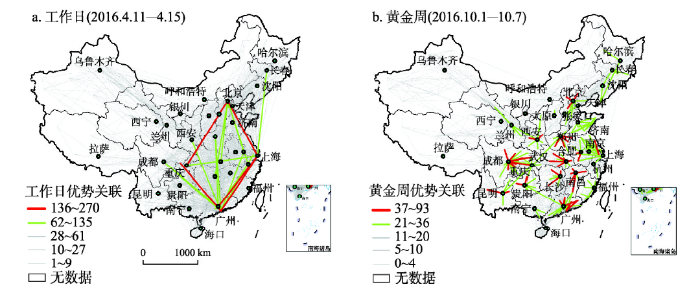
将工作日优势关联(RSIij(工作日)-RSIij(黄金周) > 0)和黄金周优势关联(RSIij(黄金周)-RSIij(工作日) > 0)进行对比分析,工作日有2234对城市联系优于黄金周,在空间格局上形成了以北京、上海、广州、深圳、成都和重庆为核心的菱形优势关联结构;黄金周共有3219对城市联系优于工作日,在空间格局上则呈现出显著的空间邻近效应,且各区域核心城市主要与周边次级城市联系的态势(图9)。受两时段出行目的地、规模和频率等特征差异的影响,不同于工作日跨区域联系为主的特征,黄金周城际出行网络空间邻近效应明显,形成了以省会城市与省内周边城市联系为主的核心—外围模式。
图9
 新窗口打开|下载原图ZIP|生成PPT
图92016年工作日与黄金周中国城际出行网络优势关联比较
注:基于国家测绘地理信息局标准地图服务网站下载的审图号为GS(2019)1823号的标准地图制作,底图无修改。
Fig. 9City links with an advantage on connectivity index RSI of intercity travel network for workdays and golden week
4 城际出行网络组团结构
4.1 组团结构
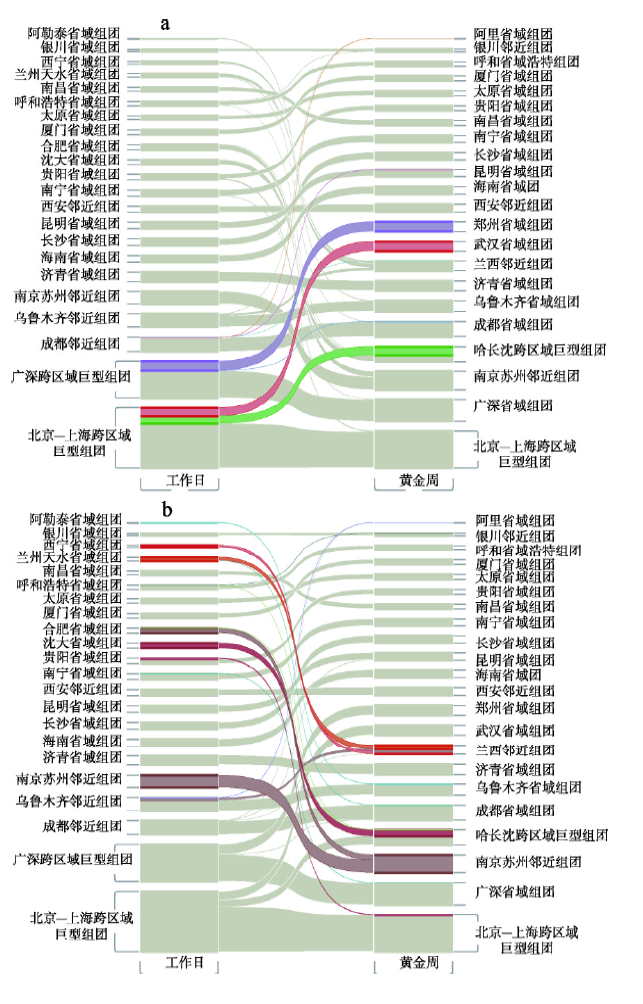
通过计算,中国城际出行网络在两时段均可分为22个组团(图10)。根据地理集聚特征,划分为跨区域组团、相邻省份组成的邻近组团和单一省域组团。图10
 新窗口打开|下载原图ZIP|生成PPT
图10工作日与黄金周中国城际出行网络组团结构划分及其变化
注:① 根据组团城市PageRank值大小进行排列,PageRank值越大,位置越靠下方,组团在网络中的重要性和地位越高;② 连接两时段不同组团间的横向流线指示了各组团所含城市在工作日和黄金周之间的变化,其宽度与组团所含城市数量成正比;③ 为清晰显示组团在两时段的变化,图a突出比较京沪组团、广深组团的工作日和黄金周变化,图b突出表示其余组团。
Fig. 10Division and change of community structure for workdays and golden week
(1)跨区域组团:该类组团的形成受到了地理邻近效应和克服距离摩擦的空间跳跃效应的叠加作用,在北上广深等中心城市的辐射带动下,形成了跨区域紧密功能联系组团。工作日,形成了以京沪为核心的跨区域组团,包括62个城市,可进一步分为黑龙江—吉林、京津冀、上海—浙江、重庆和湖北等5个次级组团;以广深为核心的跨区域组团,包括40个城市,分属于广东和河南2个次级组团。京沪组团、广深组团两大跨区域组团位于京广、京沪、京哈以及沪汉蓉沿江轴带地区,与国家“两横三纵”轴带沿海、京哈京广、沿江通道耦合程度较高。黄金周,京沪组团继续存在,但其所含城市数量由工作日的62个减少到27个,包括京津冀、上海—浙江和重庆3个次级组团,东北地区形成以哈长沈为核心的跨区域组团,包括28个城市。广深跨区域组团不再存在,形成了广东和河南2个省域组团。
(2)邻近组团:在地理位置上邻近且处于核心城市腹地范围内的邻近省份城市共同组成。工作日形成了以成都为核心,覆盖四川、西藏两地组成的组团,包括28个城市;以乌鲁木齐为核心,覆盖新疆和相邻省份甘肃西部地区的组团,包括29个城市;以南京—苏州为核心的,覆盖江苏和相邻省份安徽东部地区的组团,包括17个城市;以西安为核心,覆盖陕西和甘肃庆阳地区的组团,包括11个城市。黄金周,形成以兰州—西宁为核心,覆盖甘肃、青海和西藏那曲三地的组团,包括22个城市;以银川为核心,覆盖宁夏和内蒙古阿拉善盟组成的组团,包括6个城市;以南京—苏州为核心的组团范围进一步扩大,覆盖江苏和安徽全省,包括城市数量也增加到29个;以西安为核心,覆盖陕西和甘肃庆阳地区相邻省份的组团继续存在。
(3)省域组团:地理位置邻近且处于同一省级行政区内的城市共同组成的功能组团,这一类型组团数量最多,工作日和黄金周分别包括16个和17个,在两时段基本保持稳定,包括以济南—青岛为核心的山东组团、以海口—三亚为中心的海南组团等。
4.2 影响因素
工作日与黄金周城际出行网络结构及其差异是两时段组团划分及其变化的直接原因,而城际出行网络结构的形成及其差异从根本上反映了基于人口流动的城际空间相互作用在两时段的基本态势。两时段组团结构及其变化主要受到了地理邻近、行政区划(文化制度邻近)、出行距离、出行目的等多种因素的综合作用。地理邻近决定了地域内城际间相互作用可能性大小,位置越邻近,城市间相互联系程度越大,处于同一个组团的可能性也就越大。例如,两时段划分的22个组团中,省域组团数量最多,占比分别达到72.73%和77.27%。地处相邻省域边界地带的城市由于在地理位置上距离省域中心城市较远而难以受到中心城市的辐射带动,这些城市受到地理位置邻近相邻省份经济中心的吸引而发生较强的相互作用,从而形成邻近组团。行政区划(文化制度邻近)也是形成省域组团的主要因素,同一行政区内文化习俗、管理政策、资源配置、要素流动等方面具有先天便利性,使得省内城市间的联系远高于省际间城市联系,省会城市和省域内主要中心城市则承担了省际间联系的枢纽。
出行距离远近直接影响了城际间相互作用的空间覆盖范围。出行距离越远,相距较远的城市相互作用的可能性就会越大,因而形成跨区域组团的可能性也就越大。黄金周日均出行距离明显低于工作日(图11)。从重合网络来看,工作日平均出行距离为1325 km,黄金周平均出行距离为552 km。仅发生在工作日的城际联系主要为跨区域区际联系,出行平均距离为1324 km,仅发生在黄金周的城际联系则主要为短距离城际联系,出行平均距离为629 km。工作日期间长距离出行距离形成了以京沪为核心的跨区域组团和以广深核心的跨区域组团。黄金周期间,出行距离的减少使得广深跨区域组团不再存在,北京和上海强大中心的存在使得其辐射能力范围基本维持,京沪组团继续存在。同时,出行距离的减少使得东北地区单独形成了以哈长沈为核心的跨区域组团,这与Xu等的研究结论[26]基本一致。
图11
 新窗口打开|下载原图ZIP|生成PPT
图11工作日与黄金周中国城际出行距离对比
Fig. 11Comparison of intercity travel distance between workdays and golden week
工作日和节假日居民在出行目的上具有显著差异,工作日以出行商务差旅出行居多,这类出行发生在具有业务联系的主要中心城市间、跨城通勤城市间以及产业链上下游的城市间。因此,在高速交通发展所带来的“时空压缩”背景下,工作日的商旅差旅出行呈现出了远距离中心城市之间的“十”字型格局(京广深沿线、京沪沿线以及沪成渝沿线)和城市群内部中心城市和外围城市之间网络状格局(如珠三角城市群的深圳—东莞、广州—佛山、广州—深圳);节假日(如黄金周)则以旅游和休闲探亲出行居多,据国家旅游局统计数据显示,2016年国庆黄金周期间全国共接待游客5.93亿人次,全国近一半的人都选择外出旅游,直接形成了黄金周的日均城际居民出行规模显著高于工作日的结果。同时,统计显示三亚、大理、上海、杭州、西安、厦门、北京、成都、南京、广州等成为十大旅游目的地城市,休闲探亲出行主要发生在中心城市和其辐射范围内的外围次级城市之间,呈现出以短距离为主的放射状结构(图2、图7和图10)。
5 结论与讨论
本文利用“腾讯迁徙”大数据平台提供的居民城际出行数据,对2016年工作日和国庆黄金周中国城际出行网络特征与空间格局进行了比较研究,在一定程度上揭示工作日与节假日不同出行特征下所构成的城际出行网络特征。主要结论有:(1)黄金周的日均流动规模明显高于工作日,但出行距离明显较后者低;工作日,城际网络形成了以北京、上海、广州、深圳、成都和重庆为核心的菱形优势关联结构。黄金周,城际出行网络在空间格局上则呈现出显著的空间邻近效应。在旅游和探亲出行目的主导下,黄金周旅游功能突出城市、交通枢纽城市首位联系强度得到提升,广州、上海和北京等中心城市首位联系强度下降显著。
(2)两时段网络集聚均呈现出等级与组团交互特征,在地理邻近效应、行政区划(文化制度邻近)、出行距离、出行目的等多种因素的综合作用下形成跨区域巨型组团、邻近组团和省域组团三类组团;京沪组团、广深组团两大跨区域巨型组团位于京广、京沪、京哈以及沪汉蓉沿江轴带地区,与国家“两横三纵”轴带沿海、京哈京广、沿江通道耦合程度较高。在黄金周出行规模增加和短距离出行特征下,黄金周枢纽城市中全国枢纽城市数量大大减少,区域和地方枢纽占主导地位。
(3)经济发展水平与城市加权优势度等级规模直接相关,在空间上呈现出自东向西逐渐递减的特征。高速交通发展所带来的“时空压缩”效应对扩大出行距离、拓展活动空间发挥了重要的作用。黄金周高优势度城市分别沿京沪高铁沿线、穗莞深沿线、武广沿线和胶济客运专线呈带状延伸。
与现有基于不同尺度与不同行为主体流视角下的城市网络对比研究不同,本文通过对比分析工作日和节假日的城际出行网络结构异同,从宏观尺度上揭示了不同时间段居民空间移动规律,并间接解读了工作日与节假日不同出行特征所形成的城市网络特征。然而受数据获取限制,“工作日与节假日不同出行特征下所构成的城际出行网络特征”并不等同于“工作出行流与旅游出行流主导下的城际出行网络特征”,后续研究中可以结合问卷、票务信息等数据,直接对商务流城市网络和旅游休闲流网络多重性开展研究,并结合居民个体属性、个体行为等因素对城际出行网络的形成机理进行更深层次的探讨。
参考文献 原文顺序
文献年度倒序
文中引用次数倒序
被引期刊影响因子
[本文引用: 1]
[本文引用: 1]
[本文引用: 1]
[本文引用: 1]
[本文引用: 1]
[本文引用: 1]
[本文引用: 1]
DOI:10.11821/dlxb201702004URL [本文引用: 2]

The multi-level perspective and multi-scalar city network have gradually become the critical pathways to understand spatial interactions and linkages. The road linkages represent distinguished characteristics of spatial dependence and distance decay, which is of great significance in depicting spatial relationships at regional scale. Based on the data of highway passenger flows between prefecture-level administrative units, this paper tries to identify the functional structures and regional impacts of China's city network, and further explores the spatial organization patterns of the existing functional regions, aiming to deepen the understanding of city network structure and provide new cognitive perspectives for the extant research. The empirical results are shown as follows: (1) It is immediately visible that the highway flows are extremely concentrated on the mega-regions of eastern coastal China and major economic zones in central and western China. And city networks based on highway flows demonstrate strong spatial dependence and hierarchical characteristics, which to a large extent has spatial coupling with the distributions of major mega-regions in China. It is a reflection of spatial relationships at regional scale and core-periphery structure. (2) A total of 19 communities that belong to important spatial configurations are identified through community detection algorithm, and we believe that they are urban economic regions within urban China. Their spatial metaphors can be concluded in three aspects. Firstly, many communities have the same boundaries with provincial level administrative units, which reveals that significant administrative region economy still exists in contemporary China. Secondly, trans-provincial linkages can be formed through spatial spillover effects of mega-regions within specific communities. Thirdly, cities located in the marginal areas of provinces and attracted by powerful center cities in neighboring provinces may become increasingly disconnected with their own provinces and be enrolled into communities of neighboring provinces, which make contribution to the formation of the trans-provincial core-periphery structures. (3) Each community, with its distinguished city network system, demonstrates strong spatial dependence and various spatial organization patterns. Regional patterns have emerged with the features of a multi-level, dynamic and networked system. (4) From the morphology perspective, the spatial pattern of regional city networks can be basically divided into monocentric structure, dual-nuclei structure, polycentric structure and low-level equilibration structure, with the monocentric structure as the major type.
DOI:10.11821/dlxb201702004URL [本文引用: 2]
The multi-level perspective and multi-scalar city network have gradually become the critical pathways to understand spatial interactions and linkages. The road linkages represent distinguished characteristics of spatial dependence and distance decay, which is of great significance in depicting spatial relationships at regional scale. Based on the data of highway passenger flows between prefecture-level administrative units, this paper tries to identify the functional structures and regional impacts of China's city network, and further explores the spatial organization patterns of the existing functional regions, aiming to deepen the understanding of city network structure and provide new cognitive perspectives for the extant research. The empirical results are shown as follows: (1) It is immediately visible that the highway flows are extremely concentrated on the mega-regions of eastern coastal China and major economic zones in central and western China. And city networks based on highway flows demonstrate strong spatial dependence and hierarchical characteristics, which to a large extent has spatial coupling with the distributions of major mega-regions in China. It is a reflection of spatial relationships at regional scale and core-periphery structure. (2) A total of 19 communities that belong to important spatial configurations are identified through community detection algorithm, and we believe that they are urban economic regions within urban China. Their spatial metaphors can be concluded in three aspects. Firstly, many communities have the same boundaries with provincial level administrative units, which reveals that significant administrative region economy still exists in contemporary China. Secondly, trans-provincial linkages can be formed through spatial spillover effects of mega-regions within specific communities. Thirdly, cities located in the marginal areas of provinces and attracted by powerful center cities in neighboring provinces may become increasingly disconnected with their own provinces and be enrolled into communities of neighboring provinces, which make contribution to the formation of the trans-provincial core-periphery structures. (3) Each community, with its distinguished city network system, demonstrates strong spatial dependence and various spatial organization patterns. Regional patterns have emerged with the features of a multi-level, dynamic and networked system. (4) From the morphology perspective, the spatial pattern of regional city networks can be basically divided into monocentric structure, dual-nuclei structure, polycentric structure and low-level equilibration structure, with the monocentric structure as the major type.
[本文引用: 1]
[本文引用: 1]
[本文引用: 1]
[本文引用: 1]
[本文引用: 1]
[本文引用: 1]
[本文引用: 1]
DOI:10.1080/0965431042000212731URL [本文引用: 1]
DOI:10.11821/dlxb201708013URL [本文引用: 1]
As traffic flow reflects the socio-economic relations between cities, it is widely applied as a key factor in studies on city networks. Based on the inter-city railway and air passenger flow in 2010, this article made a comparison of the spatial structure and passenger flow organization of inter-city networks from the perspective of railway and air passenger flow, in terms of node, linkage, and community. The results are as follows: (1) Both city networks based on railway and air passenger flow present a hierarchical structure with Beijing, Shanghai and Guangzhou being the top three, while the nodes in the lower classes of two networks are different. (2) The spatial structure of linkages between cities based on railway passenger flow displays strong neighborhood effect. In contrast, the cities' own characteristics play a dominant role in the organization of air passenger flow. (3) Most of the dominant railway passenger flow is directed to the capital city in each province, forming several disperse regional systems separated by the provincial boundaries. In terms of air passenger flow, the regional systems are integrated by vertical linkages between them. (4) Although the community structure is not obvious from the perspective of air passenger flow, there are seven communities of significant geographical characteristics being detected in the railway network. The main differences between two networks are attributed to the management systems and technical characteristics of the modes of transportation.
[本文引用: 1]
[本文引用: 1]
[本文引用: 1]
[本文引用: 1]
[本文引用: 1]
[本文引用: 1]
[本文引用: 1]
DOI:10.11821/dlxb201410007URL [本文引用: 1]
China has been experiencing unprecedented urbanization process. In 2011, China's urban population reached 691 million with an urbanization rate of 51.27%. Urbanization level is expected to increase to 70% in China in 2030, reflecting the projection that nearly 300 million people would migrate from rural areas to urban areas over this period. At the same time, the natural growth rate of China's population is declining due to the combined effect of economic growth, improvement in education quality, and modern social consciousness. As a result, Chinese government has loosened its "one-child policy" gradually by allowing childbearing couples to have a second child if either of them is from a one-child family. An accurate prediction of the future spatial pattern of population and its evolution is critical for a variety of key policy-making processes in China, such as industrial development, ecological conservation, industrial upgrading and transfer, and environmental protection. In this paper, a top-down method was developed to project the spatial distribution of China's future population with considerations of both natural population growth at provincial level and the population migration between provinces from 2010 to 2050. The results suggested that the overall spatial pattern of Chinese population is unlikely to change significantly over the next four decades. Shanghai, Beijing, Tianjin and Jiangsu will remain the top 4 provinces in terms of population density in China, and Xinjiang, Qinghai and Tibet continue to have the lowest density of population. China's population is projected to continue to concentrate in eastern coastal provinces. Population densities of Shanghai, Beijing, Zhejiang will peak in 2030, while that of Guangdong will keep increasing until 2035. Due to the large amount of moving-out labors and gradually declining fertility rates, population densities for Central and Northeast China will decrease from 292 persons per km2 in 2010 to 253 persons per km2 in 2050, exhibiting a downward trend. The majority of the western provinces, including Shaanxi, Chongqing, Guizhou, Yunnan, Sichuan, Gansu, Ningxia, Qinghai, Xinjiang, Tibet, Guangxi and Inner Mongolia are likely to remain sparsely populated, with an averaged population density no more than 100 persons per km2.
DOI:10.11821/dlxb201602003URL [本文引用: 1]
Population migration flows between different regions are related to not only the origin- and destination-specific characteristics, but also to the migration flows to and from neighborhoods. Intuitively, changes in the characteristics of a single region will impact both inflows and outflows to and from other regions. In order to explore the spatial interaction mechanism driving the increasing population migration in China, this paper builds the spatial OD model of interprovincial migration flows based on the sixth national population census data and related social-economic data. The findings are as follows: (1) Migration flows show significant autocorrelation effects among origin and destination regions, which means that the migration behavior of migrants in some region is influenced by that of migrants in other places. The positive effects indicate the outflows from an origin or the inflows to a destination tend to cluster in a similar way. Simultaneously, the negative effects suggest the flows from the neighborhood of an origin to the neighborhood of a destination tend to disperse in a dissimilar way. (2) Multilateral effects of the regional economic and social factors through the spatial network system lead to the clustering migration flows across interrelated regions. Distance decay effect plays the most influential force in shaping the patterns of migration flows among all the factors and the negative spillover effect further aggravates the friction of distance. As for destinations, the influence of wage level and migration stocks is beyond that of GDP and the positive spillover effects of these factors enhance the attraction of neighborhood regions. The spillover effects of unemployment rate and college enrollment of higher education are significantly negative while the effect of population in a destination is not significant. As for origins, population and migration stocks lead to positive spillover effects on the neighborhoods while the effects of other factors are negative. (3) Changes in the regional characteristics will potentially lead to a series of events to the whole migration system, and the flows to and from the center of oscillation and its neighborhoods vibrate greatly compared with other regions. The simulation results of 5% GDP increase in Jiangsu province indicate that the outflows to other regions decrease while the inflows from all others increase to some different extent. Comparatively, the influence on the flows to and from the regions neighboring Jiangsu is significant while that of remote regions is much less, which cannot be explained by the traditional gravity model.
DOI:10.1080/00420980701518990URL [本文引用: 1]
DOI:10.1007/s10109-010-0130-8URL [本文引用: 1]
The aim of this paper is to study the dynamics of the commuting system of two insular regions of Italy, Sardinia and Sicily, inspected as complex networks. The authors refer to a 20-year time period and take into account three census data sets about the work and study-driven inter-municipal origin-destination movements of residential inhabitants in 1981, 1991 and 2001. Since it is likely that the number of municipalities (in this case, the vertices of the system) does not display sharp variations, the authors direct the study to the variation of the properties emerging through both a topological and a weighted network representation of commuting in the time periods indicated.
DOI:10.1016/j.socnet.2014.03.003URL [本文引用: 1]
DOI:10.11821/dlxb201610001URL [本文引用: 2]
With the advent of the Internet era, network data has become an important carrier characterizing residents' geography behavior. The residents' migration, social network, mobile communications and other geographic behavior big data have become an important data source for urban interactive relationship research. "Baidu Migration" big data can fully, dynamically, immediately and visually record population migration trajectory with LBS technology. Through collecting population daily flow among 369 cities in China during the period from February 7 to May 16 in 2015 in "Baidu Migration" and extracting six periods with "Quarter average, Spring Festival Transportation (before Festival), Spring Festival Transportation (after Festival), Labor Day, weekends, workdays", this paper tries to analyze and compare the characteristics and spatial patterns of daily flow among cities from the aspects of "population daily flow distribution levels, flow distribution layers network aggregation, spatial patterns and its relationship with the 'Hu Huanyong Line' for population flow". This paper analyzes the characteristics and spatial pattern of population daily flow among cities in each period. The result shows that "Baidu migration" big data clearly shows the pattern of population flow between the central and coastal areas in China during the period of Spring Festival Transportation. Main flow assembling centers are distributed in the urban agglomerations of Beijing-Tianjin-Hebei, Yangtze River Delta, Pearl River Delta and Chengdu-Chongqing, and those centers have strong coherence with those urban hierarchies in each period. Clear hierarchical structure and level distinction can be identified in the Yangtze River Delta, Pearl River Delta, Beijing-Tianjin-Hebei, Chengdu-Chongqing and Urumqi assembling systems in each period. But Central China, Northeast China, Southwest China and coastal Fujian do not present a pattern of higher level of urban assembling centers and high hierarchical assembling systems and those conditions do not match the status in national regional development strategy of those areas. The "Hu Huanyong Line" can reflect the spatial patterns of population daily flow at national level, and the profound influence of geographical environment on the population daily flow among cities. The intensity of population flow among cities is an important indicator of intensity of regional economic relationship, urban hierarchy and network structure. Spatial patterns of population flow showed in this paper can provide reference for the formation of the new pattern of regional economic development and the promotion of regional balanced development.
[本文引用: 1]
[本文引用: 1]
DOI:10.11821/dlxb201706007URL [本文引用: 1]
Application of the concepts of alter-based centrality and power has become a focus in the research on city networks in recent years. In this paper, the conditionality of recursive theory utilization to city networks is analyzed from the perspective of network topology structures. In addition, an urban network is constructed on the basis of Baidu migration data and measured using the complex network method, improved alter-based centrality, and the power method. The results show, in the first place, that the use of recursive theory for the analysis of urban networks has specific data structure requirements, suitable for tree structure, but not for the local existence of complete network structure measurements. Secondly, small world phenomena and spatial patterns of population mobility exhibit obvious core-periphery structures at national and regional scales. This means that the national urbanization development strategy and important transport facilities play key roles in enabling the population mobility network. In this context, the Harbin-Beijing-Xi'an-Chengdu-Dali line exhibits a significant network of spatial differences in terms of boundary divisions. Thirdly, the use of alter-based centrality and power reveal hierarchical characteristics, differences in the urban network, and the influence of different effects, including spatial ones, on the identification of network city resources. In this case, the network includes not just Beijing, Shanghai, Chongqing, and Guangzhou, high power quintessential cities with high centrality, but also a number of smaller lower power hub cities, including Wuhan, Taiyuan, Guiyang, and Fuzhou, as well as gateway cities that exhibit both low centrality and high power, such as Lanzhou and Yinchuan. Thus, the concepts of centrality and power are of great significance in broadening our understanding of complex urban diversification.
[本文引用: 1]
[本文引用: 3]
[本文引用: 1]
[本文引用: 1]
[本文引用: 3]
[本文引用: 1]
DOI:10.1371/journal.pone.0008694URLPMID:20111700 [本文引用: 1]
Change is a fundamental ingredient of interaction patterns in biology, technology, the economy, and science itself: Interactions within and between organisms change; transportation patterns by air, land, and sea all change; the global financial flow changes; and the frontiers of scientific research change. Networks and clustering methods have become important tools to comprehend instances of these large-scale structures, but without methods to distinguish between real trends and noisy data, these approaches are not useful for studying how networks change. Only if we can assign significance to the partitioning of single networks can we distinguish meaningful structural changes from random fluctuations. Here we show that bootstrap resampling accompanied by significance clustering provides a solution to this problem. To connect changing structures with the changing function of networks, we highlight and summarize the significant structural changes with alluvial diagrams and realize de Solla Price's vision of mapping change in science: studying the citation pattern between about 7000 scientific journals over the past decade, we find that neuroscience has transformed from an interdisciplinary specialty to a mature and stand-alone discipline.
[本文引用: 1]
[本文引用: 1]
[本文引用: 1]
[本文引用: 1]
[本文引用: 1]
