Spatial distribution and its influencing factors of national A-level tourist attractions in Shanxi Province
LIU Min, HAO WeiSchool of Geography Science, Taiyuan Normal University, Jinzhong 030619, Shanxi, China收稿日期:2019-05-29修回日期:2020-04-7网络出版日期:2020-04-25
| 基金资助: |
Received:2019-05-29Revised:2020-04-7Online:2020-04-25
| Fund supported: |
作者简介 About authors
刘敏(1962-),女,山西榆次人,教授,硕士生导师,中国地理学会会员(S110013393M),主要从事人文地理研究E-mail:liumin2279812@163.com。

摘要
关键词:
Abstract
Keywords:
PDF (3107KB)元数据多维度评价相关文章导出EndNote|Ris|Bibtex收藏本文
本文引用格式
刘敏, 郝炜. 山西省国家A级旅游景区空间分布影响因素研究. 地理学报[J], 2020, 75(4): 878-888 doi:10.11821/dlxb202004015
LIU Min.
1 引言
随着中国经济快速发展,经济增长方式逐渐倾向于发展第三产业,特别是旅游产业在国民经济和社会发展中的地位越来越重要[1]。国家A级旅游景区是国家旅游局认定的高质量和高档次的旅游资源,创建A级旅游景区是提升景区综合质量和吸引游客的有效途径,同时也是提高景区经济和社会效益的重要举措[2]。但A级旅游景区空间分布的差异性为旅游资源的优化配置带来了很大困难,很多问题的解决需建立在正确分析旅游景区空间分布规律及其影响因素的基础之上。例如,旅游业的迅猛发展给交通环境及旅游业布局带来很大压力[3],通过对A级旅游景点空间分布特征与可达性的研究能有效改善旅游交通现状[4];随着旅游业的不断发展,受景区空间容量的限制,景区环境承载力不断加重[5],因此需要根据景区的空间分布特征,对旅游产业升级,发展生态旅游[6],建立智慧旅游,实现旅游业的可持续发展[7];由于旅游资源的季节差异,导致旅游旺季集中,给旅游设施带来很大压力,而旅游淡季又会造成旅游资源的闲置[8],该问题的解决同样要依赖于对旅游景区空间分布及其影响因素分析的基础上,从空间上优化旅游资源,或用空间换时间,让旅游资源无论在淡季还是旺季均能发挥最大效益。此外,通过定量分析影响旅游景区空间分布的因素,可以促进旅游业高效发展、减少无效投资,实现对旅游资源的合理配置,也可以为旅游资源整合、解决旅游景区与周边省份同质化发展、旅游景区经济转换能力不足等问题提供科学依据[9]。山西省作为全国的能源重化工基地,产业结构以煤炭、焦化、冶金、电力四大行业为主。这种产业布局对生态环境的压力较大,对资源的依赖过高,已经对生态环境产生了较大的破坏,过度的资源消耗使其正面临着资源枯竭的风险,因此,山西省迫切需要改变原有的发展方式来应对以上问题。2012年9月国务院出台了《山西省国家资源型经济转型综合配套改革试验总体方案》,从国家层面确定了山西省必须进行经济转型。2017年9月11日,国务院印发了《关于支持山西省进一步深化改革促进资源型经济转型发展的意见》,提出山西省要推进全域旅游示范区建设,推动文化旅游融合发展,打造文化旅游支柱产业,支持有条件的市县创建国家级旅游业改革创新先行区等一系列旅游发展改革措施,进一步明确了在山西的转型发展中旅游业的重要地位。
旅游景区地域空间结构既是旅游业应对旅游需求的一种响应,也是旅游供给水平不断提升的表现。目前国内****对景区的空间分布及影响因素的研究非常丰富,从研究对象上来看,主要研究对象既有旅游景区或者国家A级旅游景区,也有特定类别的旅游景点[10,11]。从研究方法来看,主要基于计量地理学及地理信息系统和遥感影像解译等。如吴清等[9]运用核密度估计、空间自相关和网格维数值等GIS空间分析技术分析了湖南省A级旅游景区的空间分布特征及影响因素;陈晨等[12]基于地名数量统计和GIS核密度空间平滑法揭示了北京地名文化景观空间分布特征;靳诚等[13]利用探索性空间数据分析等方法分析了江苏省经济空间格局演化;吴丽敏等[14]基于GIS空间分析技术分析了江苏省A级旅游景区时空演变特征及其动力机制;方叶林等[15]运用G指数、经济重心、标准差椭圆以及灰色模型等多种数学方法对安徽省县域经济空间演化进行分析。从研究区域来看,既有全国或地区层面对国家A级旅游景区空间演化的研究[2, 16],也有从省域尺度对国家A级旅游景区空间结构的研究[14, 17-20],但尚未有关山西省旅游景区空间结构的研究。
鉴于此,本文运用GIS空间分析技术以及地理探测器(Geodetector)方法对山西省国家A级旅游景区的空间分布演化以及影响因素进行分析,探讨其变化规律,结果可为山西省旅游景区空间结构的优化提供科学依据,促进旅游业高效、快速发展,并为合理评价和指导区域旅游业全面发展提供有力支撑。
2 数据来源与研究方法
2.1 数据来源及预处理
山西省国家A级旅游景区名称、景区所属地市等信息来源于山西省或山西省下属的11个地级市旅游政务网公布的截至2017年12月的相关数据。国家A级旅游景区的等级和被评时间依据国家旅游局政府门户网站以及山西省旅游政务网所公布的相关公告。国家A级旅游景区的空间位置根据山西省旅游政务网提供的景区分布概况图进行了初步确定,然后结合百度地图和高德地图及卫星图对其具体位置进行了确认。本文所用的行政区划、交通道路、河流情况等的底图来自于山西省地图编纂委员会编纂的《1∶500000山西省政区图》《1∶500000山西省交通图》以及《1∶800000山西省流域图》。山西省高程数据来自地理空间数据云网站公布的精度为90 m的SRTM(Shuttle Radar Topography Mission)数字高程图。地形、地貌、气温、降水分布情况来自于山西省地图编纂委员会2010年出版的《山西省地图集》。
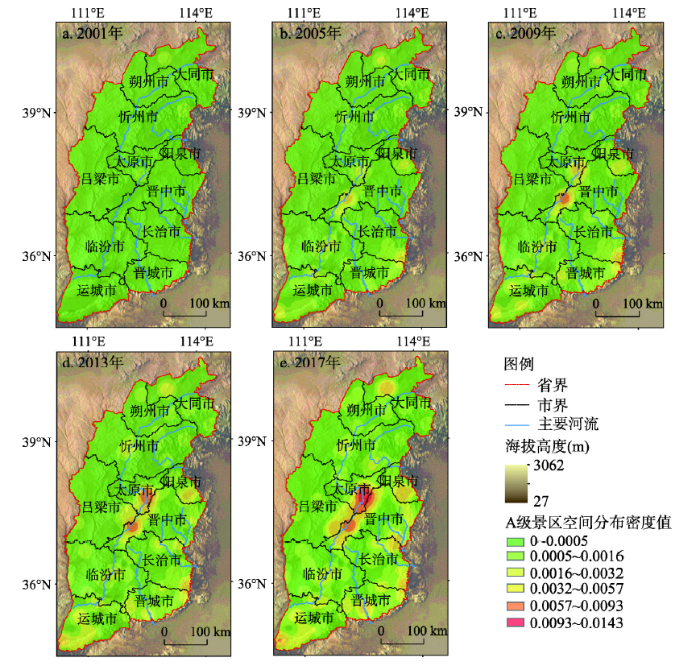
数据预处理:① 对所搜集的国家A级旅游景区数据进行处理,建立景区数据库,数据库内容包含景区名称、景区所在地(县市二级)、景区等级和等级被评年份;② 将国家A级旅游景区位置信息处理为点图层,并将景区数据库信息录入至点图层属性表中,生成年际的国家A级旅游景区空间分布密度图(图1);③ 将山西省行政区划图以县或区为最小单位建立面图层,将高速路、国道、省道等道路以及河流矢量化为线图层,将山西省地质地貌分布、温度带、降水带等矢量化为面图层。
图1
 新窗口打开|下载原图ZIP|生成PPT
图1山西省国家A级旅游景区空间分布密度图(2001年、2005年、2009年、2013年和2017年)
Fig. 1Density map of the spatial distribution of national A-level tourist attractions in Shanxi Province (2001, 2005, 2009, 2013, 2017)
2.2 研究方法
本文采用地理探测器(Geodetector)[21]与GIS空间分析方法对影响国家A级旅游景区空间分布的因素进行分析。首先将山西省划分为3 km×3 km的网格,共计17430个网格。其次虽然多种指标可作为地理探测器的探测要素,但核密度值最适合指示空间分异并能反映空间分布的演化过程[22,23,24,25,26,27,28],因此,本文选取2001—2017年的国家A级旅游景区的核密度值为探测要素Y,用q值度量[29],其表达式为:式中:q为影响因素对国家A级旅游景区密度的影响力探测值;Nh为探测要素所包含的单元数;N为全区单元数;
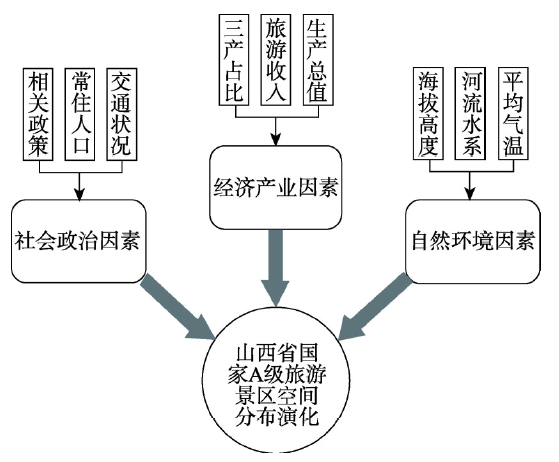
2.2.1 影响因素的确定 国家A级旅游景区的空间分布及演化受多因素共同影响,总体上可将各种影响因素综合为社会政治因素、经济产业因素、自然环境因素三大类,称为影响A级旅游景区空间分布的二级因素(图2)。社会政治因素包括主导旅游发展的政策导向、景区所在地区基础设施条件、市场条件及相关旅游从业人员的状况等,可概括为相关政策、常住人口、交通状况等次一级的三级影响因素;经济产业因素包括国民经济状况、旅游产业的发展状况等方面,可概括为三产占比、旅游收入、生产总值等次一级的三级影响因素(图2);自然环境因素决定着国家A级旅游景区自身的基础条件,自然环境优良有利于景区的形成及开发,反之则制约着景区的形成,可概括为海拔高度、河流水系、平均气温等次一级的三级影响因素(图2)。
图2
 新窗口打开|下载原图ZIP|生成PPT
图2山西省国家A级旅游景区空间分布影响因素
Fig. 2Influencing factors for spatial distribution of national A-level tourist attractions in Shanxi Province
(1)社会政治因素。① 相关政策。旅游产业的发展,受政府调控及相关政策的支持,国家A级旅游景区的评定及规划,很大程度上受政策影响。其中,政府工作报告、旅游发展规划、景区管理条例以及景区质量等级评定管理办法等一定程度上决定着国家A级旅游景区的分布和发展。② 常驻人口。人作为旅游活动的主体,随着人均收入的增高,居民的旅游需求也在不断提高,而且景区的运营与发展也需要人口的支持,因此,地区的常住人口数量决定着当地旅游市场的客源规模以及相关旅游从业人员规模,从而影响国家A级旅游景区的形成及分布。③ 交通状况。交通作为旅游六要素之一,连接着客源地与目的地,交通状况较好的地区,更容易促进景区的形成与发展,因此,交通状况的好坏不但制约着旅游景区的通达性,而且影响着旅游景区的发展与分布。
(2)经济产业因素。① 三产占比。三产占比反映当地的产业结构以及当地的主导产业。旅游业作为第三产业的重要组成部分,三产占比的变化很大程度上反映了地区的旅游业整体发展状况。② 旅游收入。地区旅游收入直观地体现了当地旅游业的发展状况,旅游收入不仅包括景区的门票收入,也包括在旅游活动中所产生的交通、餐饮、住宿、购物、娱乐等一系列收入,且景区的建设运营与之相互关联、相互促进,旅游收入的增加或减少,影响着景区的分布与发展。③ 生产总值。生产总值代表着地区的整体经济状况,经济状况良好的地区,产业结构优化程度高,基础设施发达,接待游客的服务水平良好,从而促进旅游产业的发展,进而影响景区的形成与分布。
(3)自然环境因素。① 海拔高度。海拔高度一定程度上反映着景区的类型。例如古城古村类、休闲娱乐类、文化历史类等人文旅游景区在平原地区或海拔较低的地区分布较多,而名山类的自然景区则分布在海拔较高的地区。地势平坦、海拔较低的地区适合进行生产生活活动,形成的旅游资源也较为丰富,因此海拔高度一定程度上决定着景区的类型及分布状况。② 河流水系。河流沿岸地区多是人类主要活动场所、文明的发源地,影响着文化、文明类旅游资源的形成,同时河流水系自身作为一项自然类旅游资源,也可作为国家A级旅游景区进行开发。③ 平均气温。地区的平均气温影响着人类文明的发展,适宜的气温环境,有利于生产生活活动,能促进地区的文化发展,从而形成许多文化旅游资源,适宜的气温也会促进一系列自然景观的形成,影响景区的形成发展。
2.2.2 影响因素定量划分 影响因素选取图2所示的9类三级影响因素,并对其进行定量划分。① 对影响社会政治因素的三级因素进行定量划分。相关政策(x1)选取每年政府工作报告中提及到“旅游”一词的频数[30];常住人口(x2)来源于《山西统计年鉴》中的年常驻人口数据;交通状况(x3)采用《山西统计年鉴》中的年道路通车里程数。② 对影响经济产业因素的三级因素进行定量划分。三产占比(x4)、旅游收入(x5)、生产总值(x6)数据均来源于《山西统计年鉴》。③ 对影响自然环境因素的三级因素进行定量划分。由于研究时间较短,研究区内海拔高度和河流水系变化不大。具体数据来源为:海拔高度(x7)来源于地理空间数据云中的DEM数据;河流水系(x8)基于山西省地图集中河流水系专题地图,采用ArcGIS构建河流水系缓冲区的办法,构建0~20 km内的5级河流缓冲区;平均气温(x9)来源于山西省地图集中的平均气温数据专题地图。
在数据所属的区域方面,相关政策(x1)、常住人口(x2)、交通状况(x3)、三产占比(x4)、旅游收入(x5)、生产总值(x6)为11个地市统计数据,为动态变化数据,并按11个地市级区域划分;海拔高度(x7)、河流水系(x8)、平均气温(x9)为对其具体数据进行区间分级。每一年的数据等级分级按自然间断点分法,分为5个等级(表1),并将相关矢量数据转为3 km×3 km的栅格数据。
Tab. 1
表1
表1三级影响因素数据分级表
Tab. 1
| 影响因素 | 取值范围 | 对应等级 | 影响因素 | 取值范围 | 对应等级 |
|---|---|---|---|---|---|
| 相关政策(x1) | 根据每一年的具体数值,采用自然间断点自动分级 | 1 | 生产总值(x6) | 根据每一年的具体数值,采用自然间断点自动分级 | 1 |
| 2 | 2 | ||||
| 3 | 3 | ||||
| 4 | 4 | ||||
| 5 | 5 | ||||
| 常住人口(x2) | 根据每一年的具体数值,采用自然间断点自动分级 | 1 | 海拔高度(x7)(m) | <800 | 1 |
| 2 | 800~1000 | 2 | |||
| 3 | 1000~1200 | 3 | |||
| 4 | 1200~1600 | 4 | |||
| 5 | ≥ 1600 | 5 | |||
| 交通状况(x3) | 根据每一年的具体数值,采用自然间断点自动分级 | 1 | 河流水系(x8)(km) | 0~5 | 1 |
| 2 | 5~10 | 2 | |||
| 3 | 10~15 | 3 | |||
| 4 | 15~20 | 4 | |||
| 5 | >20 | 5 | |||
| 三产占比(x4) | 根据每一年的具体数值,采用自然间断点自动分级 | 1 | 平均气温(x9)(℃) | <4 | 1 |
| 2 | 4~8 | 2 | |||
| 3 | 8~12 | 3 | |||
| 4 | 12~14 | 4 | |||
| 5 | ≥ 14 | 5 | |||
| 旅游收入(x5) | 根据每一年的具体数值,采用自然间断点自动分级 | 1 | |||
| 2 | |||||
| 3 | |||||
| 4 | |||||
| 5 | |||||
新窗口打开|下载CSV
3 结果与分析
通过地理探测器计算得到各级影响因素探测结果q值,结果如表2所示。Tab. 2
表2
表2三级影响因素q值探测结果
Tab. 2
| 年份 | x1 | x2 | x3 | x4 | x5 | x6 | x7 | x8 | x9 |
|---|---|---|---|---|---|---|---|---|---|
| 2001 | 0.0246 | 0.0110 | 0.0143 | 0.0888 | 0.0630 | 0.0533 | 0.0099 | 0.0024 | 0.0650 |
| 2002 | 0.0341 | 0.0087 | 0.0398 | 0.0478 | 0.0262 | 0.0299 | 0.0663 | 0.00054** | 0.0282 |
| 2003 | 0.0182 | 0.0403 | 0.0553 | 0.0656 | 0.0560 | 0.0529 | 0.0863 | 0.0012 | 0.0808 |
| 2004 | 0.0182 | 0.0403 | 0.0425 | 0.0425 | 0.0542 | 0.0503 | 0.0863 | 0.0012 | 0.0808 |
| 2005 | 0.0523 | 0.0465 | 0.0503 | 0.0299 | 0.0617 | 0.0250 | 0.1234 | 0.0008 | 0.1098 |
| 2006 | 0.0522 | 0.0465 | 0.0236 | 0.0796 | 0.0617 | 0.0340 | 0.1234 | 0.0008 | 0.1098 |
| 2007 | 0.0645 | 0.0345 | 0.0206 | 0.0592 | 0.0326 | 0.0174 | 0.1231 | 0.0004** | 0.0851 |
| 2008 | 0.0834 | 0.0263 | 0.0318 | 0.0283 | 0.0411 | 0.0239 | 0.1149 | 0.0005** | 0.0920 |
| 2009 | 0.0801 | 0.0312 | 0.0459 | 0.0368 | 0.0479 | 0.0398 | 0.1009 | 0.0008 | 0.1064 |
| 2010 | 0.0326 | 0.0554 | 0.0971 | 0.0509 | 0.0598 | 0.0652 | 0.1065 | 0.0014 | 0.1001 |
| 2011 | 0.0572 | 0.0531 | 0.0918 | 0.0623 | 0.0405 | 0.0730 | 0.1164 | 0.0013 | 0.1100 |
| 2012 | 0.0322 | 0.0507 | 0.1025 | 0.0622 | 0.0676 | 0.0660 | 0.1154 | 0.0016 | 0.1208 |
| 2013 | 0.0502 | 0.0562 | 0.1268 | 0.0437 | 0.0738 | 0.0833 | 0.1183 | 0.0054 | 0.1218 |
| 2014 | 0.0890 | 0.0469 | 0.1178 | 0.0211 | 0.0715 | 0.0551 | 0.1109 | 0.0019 | 0.1129 |
| 2015 | 0.0652 | 0.0455 | 0.1256 | 0.0500 | 0.0884 | 0.0765 | 0.1010 | 0.0021 | 0.1033 |
| 2016 | 0.1446 | 0.0470 | 0.1598 | 0.0287 | 0.1231 | 0.1198 | 0.1100 | 0.0022 | 0.1091 |
| 2017 | 0.1804 | 0.0520 | 0.1052 | 0.0370 | 0.1484 | 0.1374 | 0.1062 | 0.0027 | 0.1072 |
新窗口打开|下载CSV
3.1 三级影响因素影响能力演化过程
2001—2017年间,三级影响因素对山西省国家A级旅游景区空间分布的影响能力具有差异性,具体变化如下:(1)相关政策影响能力上升。相关政策(x1)的地理探测器q值具体表现为(图3):2001—2008年q值逐年上升,2009—2012年q值总体下降,2012—2017年q值开始上升且变幅较大。可见,相关政策的影响能力变化总体表现为上升趋势。
图3
 新窗口打开|下载原图ZIP|生成PPT
图3社会政治因素q值探测结果及变化
Fig. 3Results and variations of q-statistic of socio-political factor by Geodetector
(2)常住人口的影响能力变化较为平稳。常住人口(x2)的地理探测器q值及其变化如图3所示。常驻人口的影响能力总体较为平稳。由于2001年和2002年山西省国家A级旅游景区数量较少,导致常驻人口的影响作用非常低。2003年开始,影响能力值有所提升,但从2007开始下降,并在2008年达到最低值。2009年q值开始回升,2011—2017年虽然q值变化呈现缓慢下降的趋势,但整体变化较为平稳。
(3)交通状况的影响能力上升。交通状况(x3)的地理探测器q值及变化如图3所示,交通状况的影响能力变化总体表现为上升趋势。2001—2003年q值上升,2004—2007年下降,但下降幅度不大;2007年q值开始回升,并保持上升趋势至2016年,这期间q值的变化幅度较大,表明交通状况对国家A级旅游景区的空间分布影响程度逐年增加,但到2017年交通状况的影响程度有所回落。
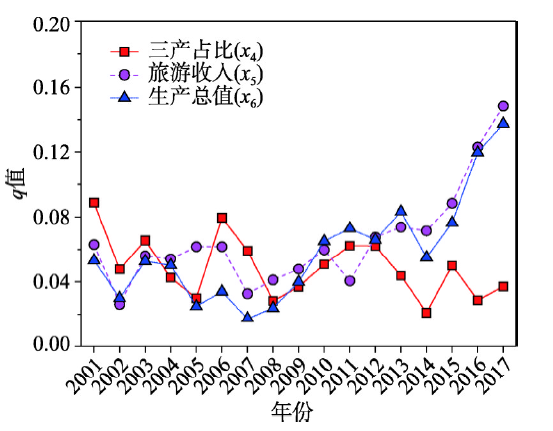
(4)三产占比影响能力呈周期性下降。三产占比(x4)的地理探测器q值及变化如图4所示,三产占比的影响能力呈周期性升降变化,但整体表现出下降的趋势。近年来,山西省产业结构一直处于不断调整和优化的过程中,从2001—2017年的山西省统计数据可以看出,各地市每年的第三产业占比数据变化差别较大,呈周期性升降,因此导致三产占比对国家A级旅游景区空间分布演化影响呈现相应的周期性变化。但三产占比影响能力总体上表现出下降趋势,说明产业结构调整对国家A级旅游景区空间分布演化的影响程度在降低。
图4
 新窗口打开|下载原图ZIP|生成PPT
图4经济产业因素q值探测结果及变化
Fig. 4Results and variations of q-statistic of economic-industrial factor by Geodetector
(5)旅游收入的影响能力上升。旅游收入(x5)的地理探测器q值及变化如图4所示,旅游收入的影响能力总体表现为上升趋势。2001—2010年q值虽存在下降—上升反复的情况,但总体表现较为稳定;从2011年开始,q值开始急剧上升,至2017年旅游收入对国家A级旅游景区空间分布的影响程度开始大幅加强。
(6)生产总值的影响能力上升。生产总值(x6)的地理探测器q值具体表现为(图4):2001—2007年q值略有下降,但幅度不大;2008年开始至2017年,q值开始快速上升,表明生产总值对国家A级旅游景区空间分布的影响程度大幅加强。可见,生产总值的影响能力总体表现为上升趋势,
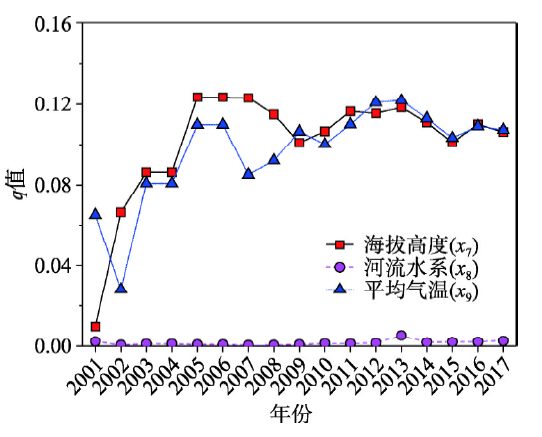
(7)海拔高度的影响能力变化较为平稳。海拔高度(x7)的地理探测器q值2001—2005年间为上升趋势(图5),主要由于国家A级旅游景区刚开始出现,所开发的景区受到海拔高度的影响程度较高;2005年达到最大值后,从2006年开始至2017年总体保持稳定,变化程度较小,表明该影响能力的变化较为稳定。
图5
 新窗口打开|下载原图ZIP|生成PPT
图5自然环境因素q值探测结果及变化
Fig. 5Results and variations of q-statistic of natural environmental factor by Geodetector
(8)河流水系影响能力缓慢上升。河流水系(x8)的地理探测器q值及变化如图5所示,河流水系的影响能力虽然呈上升趋势,但总体变化不大。2001—2002年q值下降到最低后,于2002—2017年表现为上升趋势,但q值整体的上升变化幅度不大,影响程度呈平稳上升状态。
(9)平均气温的影响能力变化较为平稳。平均气温(x9)的地理探测器q值2001—2002年下降到最低点,从2003年开始逐渐上升,2005—2017年间总体保持稳定,部分时间有波动,例如q值在2007年有所下降,2008年后开始回升,但变化程度很小,基本保持稳定(图5),平均气温的影响能力变化总体较为稳定。总体而言,平均温度与海拔高度的q值变化相近。
通过以上9项三级因素的地理探测器q值及其演化过程可以看出,相关政策(x1)、常住人口(x2)、交通状况(x3)、三产占比(x4)、旅游收入(x5)、生产总值(x6)6个因素每年的数据都有发展或变化,属于动态影响因素,其影响程度相应的表现为动态变化。其中相关政策(x1)、常住人口(x2)、交通状况(x3)、旅游收入(x5)、生产总值(x6)5项因素均表现出影响程度逐渐加强的变化趋势;三产占比(x4)相对特殊,整体表现为波动且影响程度具有下降的变化趋势,可见虽然山西省产业结构正在优化调整,但整体的产业结构,尤其是包含旅游业的第三产业的发展对国家A级旅游景区空间分布的影响程度是减弱的。海拔高度(x7)、河流水系(x8)、平均气温(x9)3种自然环境因素,因其在2001—2017年间基本不变,可看作静态影响因素,其对山西省国家A级旅游景区空间分布演化的影响程度较为稳定。
3.2 二级因素影响能力演化过程
将各二级影响因素下的3个三级影响因素的地理探测器q值相加,作为该类影响因素影响能力q值,分析三类二级影响因素影响能力q值变化。(1)社会政治因素的影响能力稳步上升。社会政治因素的地理探测器q值及变化如图6所示,社会政治因素的影响程度总体呈现上升的发展趋势,表明山西省国家A级旅游景区的空间分布演化受社会政治因素的影响程度不断加深。相关政策强有力地指导旅游景区的发展方向,常驻人口提供客源及服务人员,支撑着景区的发展,交通条件的改善促进了景区的快速发展,这些因素综合导致了社会政治因素的影响作用在不断加强。
图6
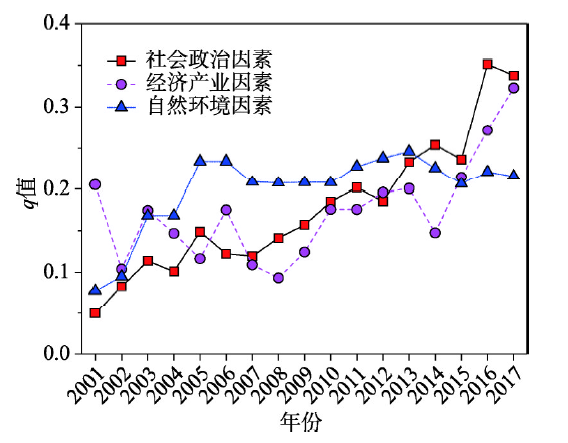 新窗口打开|下载原图ZIP|生成PPT
图6二级因素q值探测结果及变化
Fig. 6Results and variations of q-statistic of second-level factors by Geodetector
(2)经济产业因素的影响能力呈波动下降与稳步上升两阶段。经济产业因素的地理探测器q值及变化如图6所示,经济产业因素的影响程度总体呈现先波动下降后稳步上升的发展趋势,其中2001—2013年影响程度呈上下波动的特点,2014—2017年经济产业因素的影响程度逐年上升。
(3)自然环境因素的影响能力变化较为稳定。自然环境因素的地理探测器q值及变化如图6所示,自然环境因素的影响程度总体稳定,2001—2005年影响程度不断加深,但从2005年开始至2017年,整体保持较为稳定的水平。自然环境因素很大程度上决定着旅游资源的形成,同时,作为相对静态的、无变化的影响因素,从地区的自然环境状况形成的那天起,就已经一定程度上决定了该地区是否可以产生、以及产生什么样类型的旅游资源,而国家A级旅游景区的形成,更多需要后续开发。整体而言,自然环境对山西省国家A级旅游景区的空间分布演化影响能力表现为较稳定的特点。
从上述三类二级影响因素的对比来看(图6),社会政治因素在前期影响能力水平最低,但整体表现出快速发展的趋势,并在2015年超越经济产业因素和自然环境因素,成为影响程度最高的二级影响因素;经济产业因素的影响能力变化虽然在前期不稳定,但在后期影响能力越来越高,并在2015年超越自然环境因素,成为影响程度第二的二级影响因素;自然环境因素因其属于决定旅游资源形成的先天因素,影响程度较为稳定,影响能力值后期变化较小。2015年开始至2017年,由于社会政治及经济产业因素影响能力值不断增强,自然环境因素成为最小的影响因素。
4 结论
(1)影响山西省A级景区空间分布演化的二级因素包括社会政治因素、经济产业因素和自然环境因素。2001—2017年间社会政治因素和经济产业因素变化较大,属于动态影响因素,自然环境因素变化较小,属于静态影响因素。(2)影响社会政治因素的三级因素包括相关政策、常住人口和交通状况;影响经济产业因素的三级因素包括三产占比、旅游收入和生产总值;影响自然环境因素的三级因素包括海拔高度、河流水系和平均气温。相关政策、常住人口、交通状况、旅游收入和生产总值5个三级动态影响因素的影响程度整体呈上升趋势,对国家A级旅游景区的空间分布影响能力在不断加强;三产占比的影响能力波动较大,整体呈下降趋势;海拔高度、河流水系和平均气温3个三级静态影响因素的影响能力值在国家A级旅游景区形成的初期(2001—2002年)影响程度变化较大,但2003年后影响能力值变化较稳定。
(3)2001—2017年间社会政治因素影响能力值逐年增加,已成为对山西省国家A级旅游景区空间分布演化影响程度最高的二级因素;经济产业因素的影响能力呈波动下降与稳步上升两阶段,并成为影响程度第二的二级影响因素;自然环境因素的影响能力值变化较为稳定。由于社会政治因素和经济产业因素的不断变化及上升,自然环境因素成为影响力最小的二级影响因素。
参考文献 原文顺序
文献年度倒序
文中引用次数倒序
被引期刊影响因子
DOI:10.11821/xb201008011URL [本文引用: 1]

By using the data envelopment analysis and through measuring the technical efficiency, scale efficiency as well as the total factor productivity, this paper analyzes the efficiency characteristics of the tourism industry development in China from 1999 to 2006. Some conclusions can be drawn as follows. (1) As the overall efficiency of tourism industry development in China from 1999 to 2006 is low, China's tourism industry fails to fully exploit the potential of the existing resources so that the total tourism input is maintained in a diseconomical status. (2) The mean value of pure technical efficiency in tourism industry is 0.658 from 1999 to 2006,which means the effective use of existing technology is lower and the potential of the technical progress is larger. (3) Tourism development in China's western provinces enjoys the advantage of late-development, and the technical progress efficiency increases faster in the provinces with lower technological efficiency. (4) The TFP growth rate varies remarkably in different provinces, which manifests the lower pattern in turn from east to west and central China. Moreover, this gap of TFP growth between regions still shows a trend of further expansion in regional tourism development efficiencies. Finally, in order to promote the transformation of growth mode and propel the high efficiency and sustainable development of the tourism industry in China, this paper puts forward the following suggestions based on the analysis results, i.e., to optimize the ratio of the input factors, integrate the industrial chain of tourism, perfect the innovation system of tourism industry, accelerate technological progress, and make preferential policies for regional development, etc.
DOI:10.11821/xb201008011URL [本文引用: 1]
By using the data envelopment analysis and through measuring the technical efficiency, scale efficiency as well as the total factor productivity, this paper analyzes the efficiency characteristics of the tourism industry development in China from 1999 to 2006. Some conclusions can be drawn as follows. (1) As the overall efficiency of tourism industry development in China from 1999 to 2006 is low, China's tourism industry fails to fully exploit the potential of the existing resources so that the total tourism input is maintained in a diseconomical status. (2) The mean value of pure technical efficiency in tourism industry is 0.658 from 1999 to 2006,which means the effective use of existing technology is lower and the potential of the technical progress is larger. (3) Tourism development in China's western provinces enjoys the advantage of late-development, and the technical progress efficiency increases faster in the provinces with lower technological efficiency. (4) The TFP growth rate varies remarkably in different provinces, which manifests the lower pattern in turn from east to west and central China. Moreover, this gap of TFP growth between regions still shows a trend of further expansion in regional tourism development efficiencies. Finally, in order to promote the transformation of growth mode and propel the high efficiency and sustainable development of the tourism industry in China, this paper puts forward the following suggestions based on the analysis results, i.e., to optimize the ratio of the input factors, integrate the industrial chain of tourism, perfect the innovation system of tourism industry, accelerate technological progress, and make preferential policies for regional development, etc.
URL [本文引用: 2]
Scenic spot is a special scenic style on the surface of the earth.The A-grade scenic spot is a tourist ranking classifiable system with Chinese characteristics and is a national standard of comprehensive evaluation about scenic spot quality and grade in China.The instauration and appraisement of A-grade scenic spot make a great contribution to the development of tourist industry and have a significant impact on marketing, the image of the establishment of tourist destination, tourist perceptive and the economic benefits and so on in the process of tourism development because of the different levels.Given the label of A-grade to the scenic spot has not only been recognized by market but also been widely accepted in China from the beginning since the scenic spot was appraised with all levels governmental regard in everywhere, and it has become a "Jinzizhaopai" (famous grand in English) in the eyes of a vast number of tourists and a highlight of promotional and publicity.Judging from the present effects, that local government pursues the goal of title of A-grade especial higher grade gradually influences the evolving and developing of distribution structure of scenic spot.The quality of scenic spot is divided into five classes with descending order from 5A to 1A according to The Standard of Rating for Quality of Scenic Spot.Sixty-six 5A-grade scenic spots were checked and accepted and came out in the March 7, 2007 that was considered as a result of spread and intense competition among the 4A-grade scenic spots.First, this text analyses the distribution and changing rules of A-grade scenic spot about China based on the 2286 date of A-grade scenic spots, and finds that A-grade scenic spot which seems entirely in-organization has its own internal space rules.The unitary distributing pattern of A-grade scenic spot which is dense in both extremes and sparse in the middle is growing up with the development of scenic spot in our country, and has a nearly relating and matching with population distribution, river systems, transport network and also landform and so on whether in the space organization or time evolvement.Although the distribution status of A-grade scenic spot has some difference in 31 provinces, its configuration has an upper comparability.The primate distribution of scenic spot is obviously in the provincial capital cities and the distributing trend is getting more and more dispersive.Second, the paper gives its explanation from the perspective of the level of socio-economic development, population, traffic condition and rating system.Generally speaking, there are some group configurations in all provinces in China, but it can not hold back Chinese scenic spot to be more disorderly.There is a reasonable side in the distribution structure of scenic spot which hide the irrational elements.This market-oriented structure system triggers two cycles and makes the stronger much better than before and so do the weaker, and go against to the development of scenic spot to a certain extent.So tourism value of the scarcity of resources should be worth more attention under the circumstance that some conditions such as transportation, sightseeing, service facilities and man-made landscape facilities can be copied.Moreover, this paper also studies the dislocation between the distribution of A-grade scenic spot and tourism resources of China, and also discusses the development trend of A-grade scenic spot in the future which is aimed to guide and perfect the rating system to a more reasonable direction.
URL [本文引用: 1]
In recent years, the tourism industry has developed nationwide at a rapid speed. Many cities gradually focused on the economic growth of tertiary industry, which is leaded primarily by the tourism industry, particularly in the wake of continuous traffic perfection. The bottlenecks of tourism development has got different penetrations in each place, the scope of spatial tourist activities has been enlarged, tourist cooperation among districts has been enhanced and the future prospect of tourism development will be broadened. Based on the Transportation superiority degree model, this article selects three time series for comparing, which are 2001, 2005 and 2009, and analyzes the spatial variation characteristics of regional transportation structure, then discusses the impact of transportation on the regional tourism spatial structure variation. Finally, the conclusions are summarized as following: on one hand, regional transportation superiority level have been improved gradually, transportation centers transfer to the south gradually, and the spatial structure transforms from "single pole" to "twin poles"; on the other hand, tourist destination structure has been gradually optimized on the basis of transportation improvements, in addition, traffic time among the scenic regions has been shortened gradually, and tourist market has been changed in response. All the conclusions are basically in accordance with the realities, which has a centain guiding signifcances to the future transportation planning and tourism development.
DOI:10.11849/zrzyxb.2014.01.006URL [本文引用: 1]
Scenic spot is a very important carrier of tourism activities. The study of the spatial structure of tourism is receiving increasing attention but methodology so far has used qualitative rather than quantitative methods. The A-grade tourist attraction is a tourist ranking classifiable system with Chinese characteristics and is a national standard of comprehensive evaluation about scenic spot quality and grade in China. Besides the attraction of scenic spots, enhancing accessibility and perfecting infrastructure in scenic spots are very important for their tourism development. Therefore, the research on spatial distribution structure and accessibility of A-grade scenic spots are meaningful. Based on an investigation of 2424 National A-grade tourist attractions and using GIS and some quantitative analysis methods, such as Nearest Neighbor Index (NNI), Ripley's K function, hot spot clustering, the spatial structure of tourist attractions were investigated, with their characteristics and distribution for different strategies being discussed. Based on matrix raster data covering the whole space, this paper calculates spatial accessibility of all counties in China using cost weighted distance method and ArcGIS as platforms. Then we discuss spatial differences of county accessibility of scenic spots by using ESDA (Exploratory Spatial Data Analysis). The results show that general scenic spots exhibit an aggregated distribution. Considering the accessibility, we find that the human scenic spots are more centralized. The average accessibility is about 125.88 minutes, and the area where the accessibility of scenic spots is within 90 minutes reaches 60%, while the area where the accessibility is within 30 minutes accounts for 26.65% and the longest time needs 1260 minutes which is located at central Tibetan Plateau. Distribution of the accessibility has pointed to traffic line. At county level, the estimated values of Moran's I is positive numbers using analysis of spatial association. All the test results indicate that tourist attractions and adjacent areas show strong positive correlation. Distribution of hot spots regarding the accessibility shows an obvious hot spots-sub-hotspots-sub-cold spots-cold spots zonal distribution pattern from east to west. Cold spots are distributed in the border zone of Tibet, Xinjiang and Qinghai. On the basis of the above results, we identify five factors which impact the spatial structure and accessibility of scenic spots: natural environment, economic development, traffic condition, population and rating system. Finally, some recommendations are given for optimization of the spatial structure of scenic spots, involving quickening the development of edge district's tourism, coordinating the development of the tourism industry for each region, and enhancing basic infrastructure of transportation especially that of the provincial border-regions.
DOI:10.11820/dlkxjz.1998.01.013URL [本文引用: 1]
Beginning with such factors as social cultural background, social economic background, ecological and social psychological background which influence tourism bearing capacity, the article puts out the tourism bearing capacity index and its arithmetic model of operation and gives out a case of its application. The authors define the tourism environmental bearing capacity as the bearing intensity of tourism destination during a period which doesn’t do harm to the present and future people in its current state and which can be accepted by the residents. The bearing intensity of tourism destination mainly includes three sub class indexes: the tourist density, the tourism land use intensity and the tourism income value. To calculate the tourism Activity Intensity in a comprehensive indicator, the Tourism Bearing Capacity index is defined by the authors as a non—dimension value which can be an assessment indicator for sustainable tourism.
[本文引用: 1]
[本文引用: 1]
DOI:10.11820/dlkxjz.2013.06.016URL [本文引用: 1]
With the rapid development of tourism, various resource and environmental problems have been constantly emerging in tourism destination areas. The research on sustainable development of tourism destinations can promote the optimization of comprehensive benefit and the exertion of ecosystem service function for tourism destinations. There have been abundant achievements in the research on sustainable development of tourism destinations at home and abroad. The research progress was reviewed from the three aspects in this paper, including research process, research methods and main research content. Firstly, the course of the research at home and abroad was summarized and divided into three phases: initial exploration, rapid development, consolidation and deepening. Secondly, main research methods were analyzed comprehensively in terms of their characteristics and the insufficiency, which include tourism environment capacity evaluation, tourism environment impact evaluation, evaluation indices, limits of acceptable change, tourism ecology footprint. Thirdly, the major research contexts were reviewed from seven aspects, including the concepts and the level of sustainable development of tourism destinations, the course and the mechanism of the development of tourism destinations, carrying capacity and ecosystem safety of the environment of tourism destinations, tourism sustainable development model, local residents' and visitors' perceptions of the impacts of tourism, low-carbon development of tourism destinations, and the impacts of tourism enterprises. Finally, the perspectives of the research on sustainable development of tourism destinations in China were put forward from the aspects of theory, methods, and content.
[本文引用: 1]
[本文引用: 1]
[本文引用: 2]
[本文引用: 2]
[本文引用: 1]
[本文引用: 1]
URLPMID:2803524 [本文引用: 1]
It is significant to optimize spatial structure and promote tourism destination building of metropolitan tourism by studying tourism spatial structure evolution of metropolitan area, which have an important meaning in playing the function and spatial effects of metropolis tourism. The article, based on the data of tourist number and tourism revenue, using Herfindal index and model of regression analysis of rank-size, studys the evolution of tourism spatial structure evolution of Changjiang River delta metropolitan area. The result demonstrates that the q value of Changjiang River delta metropolitan area decreases from 1999 to 2008. The q value of inbound tourism decreases from 1.861 to 1.438 in 1999-2008. The q value of domestic tourism decreases from 1.155 to 0.779, smaller than 1 after 2003. Also its Herfindal index value of inbound tourism decreases from 0.371 to 0.237 and domestic tourism decreases from 0.219 to 0.105. Only the value of domestic tourism Herfindal index in 2000 is greater than year of 1999. It shows that the density of tourist number and tourism income of domestic tourism is smaller than inbound tourism. So the relative disparity of tourism development among cities is shrinking and tourism development tends to equilibrium in Changjiang River delta metropolitan area. In fact, the tourism development is multi-centered, networked, integrated and balanced, and tends to high-level equalization in the Changjiang River delta metropolitan area. Then we discuss its evolution mechanism of tourism spatial structure using the theory of tourism space interaction. It considers that the evolution of tourism spatial structure of metropolitan area may experience such processes as low-level equalization, concentration, diffusion and high-level equalization from the earlier to late period. In this periods, the tourism space interaction play an important role, and the accessibility, complementary and alternative provide necessary conditions for the tourism space interaction among cities of metropolitan area. As main forms of the tourism space interaction, the accumulation and diffusion of tourism finance, technology, personnel, information and experience and other factors promote the evolution tourism spatial structure of metropolitan area from low-level equalization to the high-level equalization. Finally, this article explores the mechanism of tourism spatial structure evolution of metropolitan area from the view of the expansion of tourism enterprises and spatial behavior of tourists which play an important role in evolution of tourism spatial structure of metropolitan area wholly.
URL [本文引用: 1]
Place-name landscape, which can reflect the natural environment, national rise and fall, social and economic changes both historically and presently, is an important research branch of Human Geography. This research used GIS to discuss the spatial distribution characteristics of place-name landscape in Beijing and explained their reasons. Firstly, by exploring the origins of place-names, the research carred statistical analysis on them, and classified them into two categories. Secondly, through obtaining Kernel density distribution characteristics of every kind of the place-name through Space Smoothing Algorithm based on Kernel Density Estimation, the research discussed the spatial distribution characteristics of place-name landscape in Beijing. Thirdly, the reasons for the spatial distribution were analyzed. Main conclusions made by this research are as follows: 1) Natural landscape place-names were mainly concentrated in the northern and western mountain areas. 2)By contrast, human landscape place-names tend to centralize in the central and southeastern plains. 3) The spatial distribution characteristics of place-names among human landscape place-names is different. Political, economic, garden, architecture and engineering activities prefer to cluster in the central city, the southeast part of Beijing is proved to be economic and hydraulic engineering activities' concentrated area, military activities tend to centralize in the northwestern and eastern areas, garden construction activities, however, are almost found in the northwest and northeast areas. By studying on the spatial distribution characteristics of place-name landscape in Beijing and their reasons, this research can clearly show the functional zoning in Beijing during Yuan, Ming and Qing, and help to explore the development of social and economic conditions during those historical periods. In addition, this article can enrich research methods and empirical studies of place-name studies in human geography.
DOI:10.11821/xb200906008URL [本文引用: 1]
This article, taking Jiangsu Province as an example, describes the spatial changes of the diverse economy of Jiangsu at county level since the 1990s through the related analysis of ESDA as well as other tools such as Moran's I, Getis-Ord General G, Getis-Ord Gi and the function of variogram and its amount of fractal dimension as scale index. Based on four time discontinuity surfaces, some conclusions are drawn as follows. (1) Considering the overall spatial economic framework, the county economy of Jiangsu province shows a strong trend of spatial natural correlation. The similar areas cluster in space. The space structure of the hotspot distribution tends to be the circular space structure centered on Wuxi and Suzhou. (2) The development of the spatial economic growth framework is likely to be more stochastic and unstable in the aspect of spatial distribution. Hotspot areas are changing frequently without obvious appearance of geographical concentration. (3) According to the space-time mechanism, the Jiangsu spatial economic framework tends to be more continuous and self-organized, the random of the spatial differential pattern keeps decreasing and the mechanism of the structural differentiation caused by natural correlation in space is becoming more and more remarkable. The homogeneousness of economic development in the direction of northeast-southwest is typical for its relatively small spatial difference. As to the opposite direction, the spatial difference is great. (4) The driving force of the evolvement of Jiangsu economic framework can be identified through the following aspects: the basis of historical development, the economic location and the policies on regional development.
[本文引用: 2]
[本文引用: 2]
[本文引用: 1]
[本文引用: 1]
[本文引用: 1]
[本文引用: 1]
[本文引用: 1]
[本文引用: 1]
[本文引用: 1]
[本文引用: 1]
[本文引用: 1]
[本文引用: 1]
DOI:10.1016/j.jrurstud.2016.05.013URL [本文引用: 1]
DOI:10.5814/j.issn.1674-764x.2016.06.006URL [本文引用: 1]
Tourism has emerged as a major driving force in the growth and expansion of rural settlements. After several studies revealed spatial differentiation of touristization among rural settlements, studies were conducted to explain this phenomenon. However, most of these studies explained spatial differentiation of rural touristization in a qualitative way. More robust and detailed quantitative results are needed to evaluate the relative roles of different factors. In this study, which takes Yesanpo tourism as a case study, the Geo-detector method was introduced to evaluate determining factors of rural touristization. Results show that “distance to core entry”, “tourist number and sojourn time”, and “distance to the nearest scenic area” have had a strong effect on the rural touristization in Yesanpo, whereas “distance to river”, “elevation”, “distance to main road”, and “slope” have had a weak influence. The latter did, however, contribute a lot to touristization when interacting with “distance to core entry”, “tourist number and sojourn time”, and “distance to the nearest scenic”, indicating the importance of these four factors. Higher rural touristization occurred in the zone near the core entry, with many tourists, long sojourn times, and proximity to the scenic area.
DOI:10.13249/j.cnki.sgs.2016.02.002URL [本文引用: 1]
This study focuses on the distribution characteristics, effect factors and optimized reconstructing analysis of rural settlement in China. Based on electronic map data in 2012 and socioeconomic data of counties in China, the spatial distribution pattern of rural settlement and effect factors have been examined using model of the average nearest neighbor distance and geographical detector method, while the background and mode for rural space optimization reconstruction were analyzed. Main results for this study are as follows: 1) the rural settlement spatial distribution mode consists of cluster, random and uniform discrete distributions in China, while the regional differences were significant. The density of rural settlements is greater in the southeastern region than in the northwest region with Hu Huanyong's population distribution line for the boundary in China. There were a variety of characteristics for the rural settlement distribution in different type of regions. The spatial distribution of rural settlement was intensive, and those spatial distribution modes were mainly random and disperse with a short average nearest neighbor distance in plain areas. On the other side, the density of rural settlement was low, and those spatial distribution modes were mainly cluster relatively with a long average nearest neighbor distance in highland and cold areas and fringes of the desert. In addition, the density of rural settlement was high, and those spatial distribution modes were mainly random in the intersected transition zone between hill and mountain. 2) The dual factors affect the rural settlement distribution from traditional and economy. Although the traditional factors still play a significance role, the influence of the economic developed more and more obviously. There were a large amount of factors attributing to impacting rural settlement distribution, the spatial form of production and life space, including natural topography and water resources natural conditions, etc. That also included traffic condition, industry, economic development level and agricultural modernization. 3) With factors of production non-agriculture in rural region, the rural space need be a reconstructing optimization. The priority selection is to rebuild village-town system for optimizing rural physical space. Theoretically, village-town system is a sort of hierarchical structure, consisting of central regional town, general agricultural town, central village and basic village. 4) The multiple modes will been made use of restructuring rural space in different geographical areas, including balance forms of radiation, radiation disequilibrium forms, multicore equilibrium forms and corridor layout pattern or mixed modes. From the system and the hierarchical logic level to deconstruct the rural space theory for optimization, a reasonable village-town system is rebuilt orderly, which will provide a scientific basis for urban and rural urbanization.
DOI:10.1007/s11442-015-1249-9URL [本文引用: 1]
This study has revealed spatial-temporal changes in Recreational Business Districts (RBDs) in Beijing and examined the relationship between the location of urban RBDs and traffic conditions, resident and tourist density, scenic spots, and land prices. A more reasonable classification of urban RBDs (LSC, CPS, and ULA) is also proposed. Quantitative methods such as Gini Coefficient, Spatial Interpolation, Kernel Density Estimation, and Geographical Detector were employed to collect and analyze the data from three types of urban RBDs in Beijing in 1990, 2000, and 2014, respectively, and the spatial-temporal patterns as well as the distribution characteristics of urban RBDs were analyzed using ArcGIS software. It was concluded that (1) both the number and scale of urban RBDs in Beijing have been expanding and the trend for all types of urban RBDs in Beijing to be spatially agglomerated is continuing; (2) the spatial-temporal evolution pattern of urban RBDs in Beijing is “single-core agglomeration-dual-core agglomeration-multi-core diffusion”; and (3) urban RBDs were always located in areas with low traffic density, tourist attractions, high resident and tourist population density, and relatively high land valuations; these factors also affect the scale size of RBDs.
DOI:10.1017/S0007485315000152URLPMID:25779652 [本文引用: 1]
Grasshopper plagues have seriously disturbed grassland ecosystems in Inner Mongolia, China. The accurate prediction of grasshopper infestations and control of grasshopper plagues have become urgent needs. We sampled 234, 342, 335, and 369 plots in Xianghuangqi County of Xilingol League in 2010, 2011, 2012, and 2013, respectively, and measured the density of the most dominant grasshopper species, Oedaleus decorus asiaticus, and the latitude, longitude, and associated relatively stable habitat factors at each plot. We used Excel-GeogDetector software to explore the effects of individual habitat factors and the two-factor interactions on grasshopper density. We estimated the membership of each grasshopper density rank and determined the weights of each habitat category. These results were used to construct a model system evaluating grasshopper habitat suitability. The results showed that our evaluation system was reliable and the fuzzy evaluation scores of grasshopper habitat suitability were good indicators of potential occurrence of grasshoppers. The effects of the two-factor interactions on grasshopper density were greater than the effects of any individual factors. O. d. asiaticus was most likely to be found at elevations of 1300-1400 m, flat terrain or slopes of 4-6°, typical chestnut soil with 70-80% sand content in the top 5 cm of soil, and medium-coverage grassland. The species preferred temperate bunchgrass steppe dominated by Stipa krylovii and Cleistogenes squarrosa. These findings may be used to improve models to predict grasshopper occurrence and to develop management guidelines to control grasshopper plagues by changing habitats.
[本文引用: 1]
[本文引用: 1]
[本文引用: 1]
[本文引用: 1]
DOI:10.1002/(sici)1521-3773(20000103)39:1<198::aid-anie198>3.0.co;2-oURLPMID:10649374 [本文引用: 1]
An MP2 ab initio study of the interaction between a H(2)O molecule and trans-[Pt(OH)(2)(NH(3))(2)] revealed a HO-H small middle dot small middle dot small middle dotPt(II) hydrogen bond (see picture) with a strong dispersion component (ca. 4 kcal mol(-1)). This dispersion interaction is independent of the charge on the complex and is likely to be ubiquitous in aqueous solutions of Pt(II) complexes.
