 ,1,2,3, 刘承良1,2, 桂钦昌1,2, 刘树峰1,2, 覃雄合1,2,31.
 2.
3.
Spatio-temporal evolution and factors influencing international student mobility networks in the world
HOU Chunguang1,2,3, DU Debin,1,2,3, LIU Chengliang1,2, GUI Qinchang1,2, LIU Shufeng1,2, QIN Xionghe1,2,31. 2.
3.
通讯作者:
收稿日期:2018-05-25修回日期:2019-09-24网络出版日期:2020-04-25
| 基金资助: |
Received:2018-05-25Revised:2019-09-24Online:2020-04-25
| Fund supported: |
作者简介 About authors
侯纯光(1990-),男,安徽利辛人,博士,主要从事世界经济地理与区域创新研究E-mail:1570846532@qq.com。

摘要
关键词:
Abstract
Keywords:
PDF (4979KB)元数据多维度评价相关文章导出EndNote|Ris|Bibtex收藏本文
本文引用格式
侯纯光, 杜德斌, 刘承良, 桂钦昌, 刘树峰, 覃雄合. 全球留学生留学网络时空演化及其影响因素. 地理学报[J], 2020, 75(4): 681-694 doi:10.11821/dlxb202004002
HOU Chunguang.
1 引言
知识化和全球化使当前世界正经历着前所未有的大变局[1],全球经济社会发展所需的各种资源越发频繁地跨越地理边界在“扁平的世界”内流动[2]。这些流动的因子不仅包括各国关注的矿产、能源、资本、信息和技术,更加包括作为第一资源的人才。在知识经济时代,人才的广泛流动性,促使全球范围内形成了统一的人才市场,加剧了各国之间的人才竞争[3,4],出国留学成为当前各国培养国际化人才的必要选择,同时也为全球知识转让和流通提供了重要途径[5,6]。全球留学生人数从2001年的217.27万人迅速增长到2015年的460.67万人,巨量的国际人才流孕育着更加广泛和更加复杂的全球政治和经济关系网络[7]。长期以来全球留学生一直遵循着从发展中国家向美国、英国、法国等欧美发达国家流动的路径,留学生的聚集给这些国家带来了大量的资本和智力资源,如何吸引更多优秀的国际学生成为这些国家关注的重要问题,而如何扭转单向的人才流动,实现“人才环流”成为广大发展中国家关注的焦点。知识经济时代,国际间人才流动数量大幅增长,影响着世界经济和政治格局的演变,受到各国****的广泛关注。通过梳理相关文献发现,以往****对包括科学家、****、高技能人员等在内的国际人才流动进行研究时,一般采用的分析框架主要包括新古典经济理论、新迁移经济学等竞争与自由主义理论,把国际人口迁移看作是个体理性的经济决策,理性经济人通过比较出国成本和收益,当预期收益大于出国成本时,他们就会选择出国[8,9]。竞争与自由主义理论对于全球留学生流动的理论含义是,将留学生理解为理性行为者,留学的目的在于最大化个人终生收入,当收入预期大于留学成本时,理性行为者就会选择跨越国界,寻求高质量的教育资源,造成的空间后果是越来越多发展中国家的学生选择全球高等教育资源比较集中的发达国家求学、就业。与新古典经济理论、新迁移经济学等竞争与自由主义理论形成对照,世界体系理论、制度经济地理学等批判与结构主义理论,受到马克思主义的影响,更加关注全球政治、文化和经济关系等结构要素对全球留学生留学网络时空演化的重要作用。例如沃勒斯坦将世界体系划分为核心国家、半边缘国家、边缘国家[10],核心国家拥有全球顶级的大学和科研机构,控制全球的知识生产和流动,并通过投资基础设施,如实验室,图书馆等,巩固其在全球留学网络中的区位优势,处于边缘的广大发展中国家则鼓励学生前往发达国家学习先进的技术和知识,促进国家创新发展。制度经济地理学则认为包括人才在内的各种资源的全球流动不可避免的受到不同空间尺度上制度的影响和约束[11,12],例如,以中国、印度等为代表的发展中国家,通过设立“留学基金”,鼓励学生出国留学,并为国家发展做出贡献;以欧美为代表的发达国家,通过放宽留学签证限制,吸引世界各国优秀学子前往求学就业,促进本国科学技术发展。
空间相互作用、相互关系是地理学研究之永恒主题[13]。诞生于20世纪60年代,并在90年代之后逐渐崛起的网络科学亦将“关系”作为其研究的核心[14],这与人文经济地理学的流空间转向相契合。新近人文经济地理学的流空间研究主要集中在交通运输、贸易、投资和科研合作网络上,如航空网络[15]、公路运输网络[16]、世界航运网络[17,18]、高铁网络[19,20]、全球贸易网络[21,22]、全球投资网络[23]、全球论文合作网络[24,25]、专利合作网络[26,27]等,而对人口流动网络,特别是全球人才流动网络研究较少。虽然一些教育****利用社会网络方法,从教育学和社会学的角度,利用定性和统计分析的方法,一定程度上刻画了留学生流动状况,但他们偏重描述留学网络拓扑结构[28,29,30,31],尚缺乏对全球留学网络的等级层次结构、地理空间差异等地理****关心的问题开展定性和定量研究。
综上,本文将研究焦点落在全球留学生留学网络时空演化及其影响因素上,借鉴网络科学,利用社会网络分析方法,全面刻画全球留学生留学网络空间结构上的等级层次性、非均衡性及集聚性等特性。具体而言,① 节点(国家或地区)中心性:从度中心性、强度中心性、集聚系数等方面,构建加权多中心性模型(Multiple Centrality Assessments),刻画世界各国在留学网络中的中心性和重要性;② 关联(国际联系强度)层次性:基于留学生的流量和流向,构建加权有向留学网络,从边权重度量世界各国人才培养的联系强度(Strength of Linkage Pair),识别全球主要留学联系、双边关系及方向;③ 网等级层次性:基于优势流算法,识别全球留学生留学网络的等级层次结构;④ 网络集聚性及连接性:从集聚系数、网络密度和直径等指标视角,揭示全球留学网络的全局结构异质性,刻画全球留学生留学的空间集聚程度及连接程度。最后运用负二项回归模型,以空间相互作用理论为基础,从自由主义和结构主义的视角,探讨全球留学网络时空演化的影响因素。
2 数据来源与研究方法
2.1 数据来源
研究涉及的全球高等学校留学生流动数据(International Student Mobility in Tertiary Education)来源于联合国教科文组织(UNESCO)数据库,由于该数据库缺少来华留学生数据,本文依据中国教育部国际合作与交流司统计的来华留学生数据,对联合教科文组织留学生数据库进行了补充。联合国教科文组织将留学生或国际流动学生定义为跨越两国边界进行学习的学生,这些学生不是正在学习国的公民[7, 9]。在影响因素分析中,利用全球前500强大学衡量留学目的地国高等教育质量,数据来自上海交通大学世界一流大学研究中心世界大学学术排名(Academic Ranking of World Universities)数据库;留学目的地国高校在校生数量来自联合国教科文组织公布的世界各国或地区高校在校生数量;留学目的地国人均GDP、以及衡量留学目的地国和留学生来源国全球化水平的商品进出口总额与GDP的比值数据来自世界银行(World Bank)数据库;留学目的地国与留学生来源国的语言临近性、历史联系、地理距离数据均来自法国CEPII数据库。2.2 研究方法
2.2.1 全球留学网络计量模型(1)网络总体属性测度模型
网络密度(Graph Density, Dg)用来检测网络整体的链接程度,整体网络的密度越大,表明各节点联系越密切,同时也说明网络对各节点的关系和流量影响越大[7, 23]。全球留学网络属于有向关系网络(Directed Graph),表达式为:
式中:m是网络中包含的有向边总数;n是网络节点总数。
聚类系数是指网络中节点与其所有邻接点之间实际的边数与最大可能边数的比值[7, 23],衡量留学网络中各国的集聚程度。平均聚类系数(C)即为聚类系数的平均值,表达式为:
式中:n是网络节点总数;ei为节点i与其所有邻接点之间实际边数;ki是与i的邻接点数;ki(ki-1)是最大可能边数。
(2)网络节点属性测度模型
度中心性(Degree Centrality, Cd)指与该节点直接相连的其他节点的数量,衡量节点连接程度[7, 12]。在全球留学网络中,节点度中心性表示与该国或地区有留学往来的国家数量,在有向网络中度中心性又可分为出度中心性和入度中心性:
式中:aij表示留学生留学网络邻接矩阵,有留学关系流的赋值为1,无则赋值为0。
强度中心性(Strength Centrality, Cs)指与节点i直接相连的边的权重总和,在有向网络中分为加权入度和加权出度[7, 12]。在全球留学网络中,节点强度表示流入该国的留学生和该国派出去的留学生数量的总和,反应一个国家或地区高等教育的国际化程度:
式中:Ni表示与节点i的直接相连的节点集合;wij表示连接节点i和j之间留学生流量的数量总和。
(3)网络结构判定模型
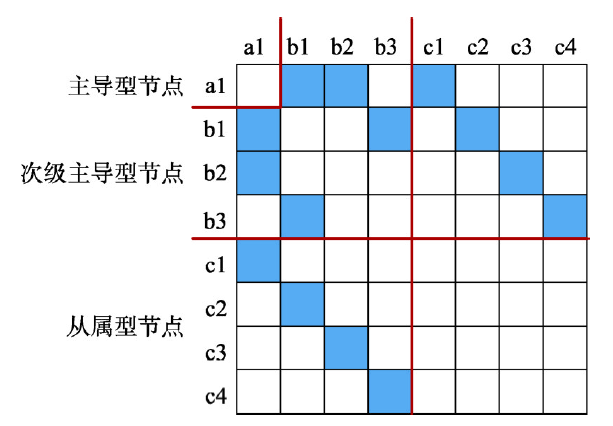
优势流(Dominant Flow)分析模型是依据中心地理论,用数学图论和关系结构的方法刻画不同尺度空间之间的等级层次性[32]。空间单元之间关系流的方向和大小是决定空间秩序的重要指标。现实世界中,空间单元之间可能存在无数关系流,而关系流中的最大流即优势流构成了空间网络结构中的骨架,决定空间单元的等级层次。本文根据优势流模型的原理,构建了关系矩阵(图1),用以说明留学网络的等级层次结构。蓝色方格表示一个国家或地区所有关系流中的最大流即优势流,a1是关系网络中主导型节点,其优势流流向了比自身规模小的节点b1,b1、b2的优势流则流向了a1,b3的优势流流向了b1,b1、b2、b3的共同特点是有规模更小的节点与其相连,所以b1、b2、b3属于次级主导型节点,c1、c2、c3、c4的优势流流向了比自己规模大的节点,且没有其他节点的优势流流入,属于从属型节点。
图1
 新窗口打开|下载原图ZIP|生成PPT
图1等级层次结构概念模型
Fig. 1The conceptual model of hierarchical structure
2.2.2 负二项回归模型
(1)选取变量
地理学空间相互作用理论认为,空间发生联系需要满足两个基本条件:一是区域之间的互补性,即区域之间必须在某些商品、劳动力、资本、技术、信息等方面存在供需关系;二是区域之间的可达性,即区域之间存在商品、劳动力、资本、技术、信息等要素流动的可能性。一般影响区域间可达性的因素包括:地理距离、交通、传输客体属性、区域之间政治、文化、社会等方面的障碍因素[33]。根据地理学空间相互作用理论,本文选择自变量主要考虑两个方面,一是区域之间的互补性,即留学目的地国或地区对留学生的吸引力;二是区域之间的可达性,即留学生在留学过程中所受阻力。在留学目的地国吸引力方面,选择留学目的地国高等教育质量、高校在校生数量、人均GDP,作为核心变量,按照自由主义和结构主义的观点,学生通过在全球寻求高质量的教育资源来提高自身的竞争力,发达国家则通过一流大学控制全球留学网络的流向,留学目的地国的高校在校生数量能够衡量其接收国际留学生的能力,留学目的地国人均GDP则反映了其宏观经济环境对留学生的吸引力;在留学目的地国和留学生来源国之间的可达性方面,选择语言临近性、历史联系、地理距离3个核心变量,根据制度经济地理学的相关观点,区域之间正式的和非正式的联系和制度也会对区域之间的关系流产生重要影响,语言临近性被很多****认为是两国或地区交流的重要条件,历史联系是关系和演化经济地理学关注的重要因素,地理距离被认为与空间之间相互作用成负相关。此外,本文推测留学目的地国和留学生来源国的全球化水平会对全球留学网络的流向和流量产生重要影响,故将其选作控制变量。
(2)模型构建
鉴于留学生数量只能取非负整数,并具有离散特性。因此,可以选择泊松回归模型或负二项回归模型,但由于泊松回归模型要求因变量Y值具有“均等分散”的特点,即期望值和方差值相等,而非独立事件的计数数据一般存在“过度分散”的特点,即方差值大于期望值,所以可能会导致回归结果出现偏差。为克服此类约束,当选用负二项回归模型[20],测度全球留学网络时空演化的影响因素,其公式如下:
式中:ISMij是来源国j到目的地国i的留学生数量,是模型的被解释变量;α为常数项;εi为随机误差项;β1, β2,…, β8为待估系数;核心解释变量Eduqualityi是目的地国i的高等教育质量,用进入世界大学学术排名前500强的大学数量衡量;Stunumberi是目的地国i的高校在校生数量;PerGDPi是目的地国i的人均GDP;Lanproximityij是来源国j与目的地国i的语言临近性,为虚拟变量,如果两国或地区的官方语言相同则赋值为1,否则为0;Hiscontactsij是目的地国i与来源国j之间历史上的殖民关系,为虚拟变量,如果两国或地区历史上存在殖民关系则赋值为1,否则为0;Geodistanceij是目的地国i与来源国j的地理距离,用两国或地区首都或首府之间的物理距离衡量;控制变量Globalizationi和Globalizationj分别表示目的地国i与来源国j的全球化水平,用国家或地区的商品进出口总额与GDP的比值衡量。
3 全球留学网络时空格局演化特征
3.1 全球留学网络的时序演化特征
2001—2015年全球留学网络规模迅速扩大,网络节点(国家或地区)数量从203个增加到212个,留学关系流从4921个增加到9137个(表1),表明越来越多的国家或地区参与到全球留学网络中;全球留学网络密度从0.120提升到0.204,表明全球高等教育国际化联系日趋紧密;留学网络平均聚类系数从0.686降至0.655,说明全球留学网络的区域化趋势越来越显著,留学生不再仅仅向某一国或地区集聚;平均度反映了网络中各国或地区平均联系的国家或地区数量,全球留学网络的平均度从24增加至43,表明各国在高等教育上产生了更多的联系,全球留学网络的结构凝集力逐渐提升;平均加权度反应了各国或地区派遣和接收的留学生数量,全球留学网络的平均加权度从8004迅速增加到20834,表明越来越多的学生选择跨越国界寻求高质量的教育资源。综上,全球留学网络不仅留学生数量在迅速增加,而且在留学目的地的选择上也越来越丰富,各国或地区在全球留学网络中的联系越发紧密,全球高等教育国际化程度逐渐提升。Tab. 1
表1
表12001—2015年全球留学网络的特征量统计
Tab. 1
| 年份 | 网络规模 | 集聚性 | 度中心性 | 强度中心性 | ||||||
|---|---|---|---|---|---|---|---|---|---|---|
| 节点数 | 边数 | 图密度 | 直径 | 平均聚类系数 | 平均度 | 平均加权度 | ||||
| 2001 | 203 | 4921 | 0.120 | 3 | 0.686 | 24 | 8004 | |||
| 2002 | 202 | 5379 | 0.132 | 4 | 0.699 | 27 | 10055 | |||
| 2003 | 205 | 6021 | 0.144 | 4 | 0.665 | 29 | 11206 | |||
| 2004 | 207 | 5906 | 0.139 | 5 | 0.670 | 29 | 11386 | |||
| 2005 | 206 | 5679 | 0.134 | 3 | 0.709 | 28 | 11935 | |||
| 2006 | 207 | 5959 | 0.140 | 4 | 0.688 | 29 | 12068 | |||
| 2007 | 208 | 6103 | 0.142 | 4 | 0.708 | 29 | 13092 | |||
| 2008 | 208 | 6781 | 0.157 | 4 | 0.670 | 33 | 14004 | |||
| 2009 | 208 | 7026 | 0.163 | 4 | 0.647 | 34 | 14993 | |||
| 2010 | 207 | 7226 | 0.169 | 5 | 0.674 | 35 | 15510 | |||
| 2011 | 209 | 7605 | 0.175 | 4 | 0.677 | 36 | 16561 | |||
| 2012 | 211 | 7793 | 0.176 | 5 | 0.662 | 37 | 16631 | |||
| 2013 | 209 | 7712 | 0.177 | 4 | 0.687 | 37 | 16971 | |||
| 2014 | 211 | 8456 | 0.191 | 4 | 0.667 | 40 | 18298 | |||
| 2015 | 212 | 9137 | 0.204 | 3 | 0.655 | 43 | 20834 | |||
新窗口打开|下载CSV
3.2 全球留学网络的空间格局演化特征
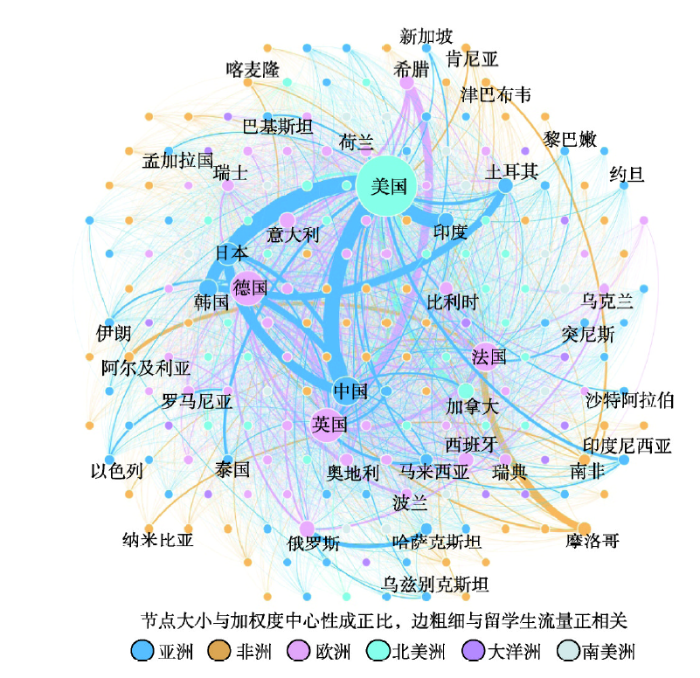
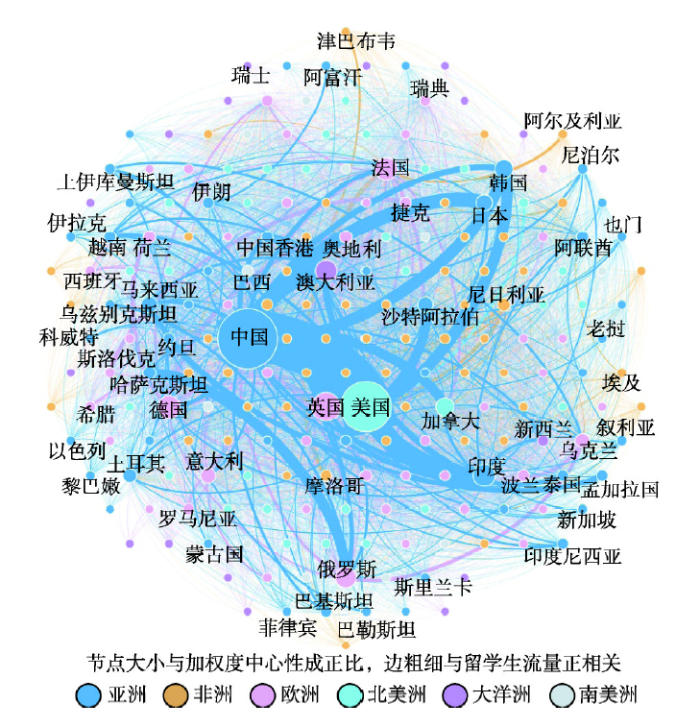
3.2.1 全球留学网络的拓扑结构特征 利用全球留学生流动数据,刻画2001年和2015年两个时间截面的全球留学网络拓扑结构,图中节点大小与节点的加权度中心性成正比,即接收和派遣出去的留学生数量越多,节点越大;边粗细与留学生流量成正比;节点和线同颜色表示该国或地区的学生流向其他国家或地区。从2001年全球留学网络拓扑结构来看(图2),美国、德国、英国和法国是这一时期全球主要留学目的地国,其中美国是全球留学网络的核心,且地位远超其他国家;中国、日本、韩国、印度、土耳其等亚洲国家是全球留学生的主要来源国,且亚洲学生主要流向了美国和德国,欧洲地区留学网络比其他地区更加稠密,是这一时期全球留学网络的主体,且欧洲国家学生主要在欧洲内部流动。2015年全球留学网络拓扑结构较2001年产生了较大变异(图3),全球留学网络从以美国为单一核心的拓扑结构,演变成以中国和美国为双核心的拓扑结构,中国成为了亚洲区域性的留学中心,亚洲国家是这一时期全球留学网络的主体,且留学网络比其他地区更加稠密;澳大利亚成为美国之外亚洲留学生的主要目的地之一,欧洲国家在全球留学网络拓扑结构中的中心性逐渐萎缩。图2
 新窗口打开|下载原图ZIP|生成PPT
图22001年全球留学生留学网络拓扑结构
Fig. 2The topological structure of international student mobility networks in 2001
图3
 新窗口打开|下载原图ZIP|生成PPT
图32015年全球留学生留学网络拓扑结构
Fig. 3The topological structure of international student mobility networks in 2015
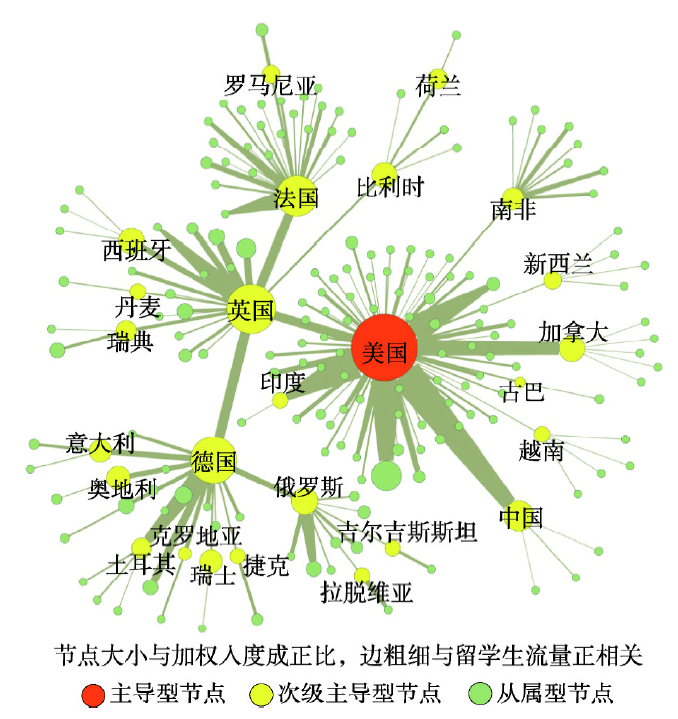
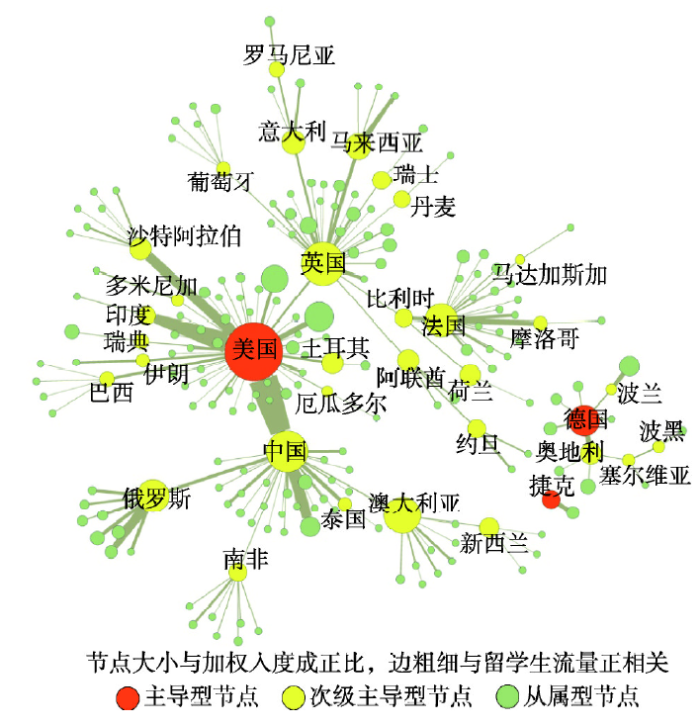
3.2.2 全球留学网络的等级层次特征 采用优势流分析模型,刻画2001年和2015年两个时间截面的全球留学网络的等级层次结构,与以往仅考虑节点规模的单一属性结构相比,本文既考虑了节点的规模属性又考虑了节点间的流量属性,对全球留学网络二维属性等级层次结构进行了可视化,图中节点大小与节点的加权入度成正比,即接收的留学生越多,节点规模越大;边粗细与学生流量成正比。全球留学网络中最大流即优势流构成了全球留学网络的骨架,并由此决定了全球留学网络中各国或地区的等级层次。2001年全球留学等级层次网络属于全连通网络(图4),美国是全球唯一主导型节点,是全球76个国家或地区的最大留学目的地国;英国、法国、德国、俄罗斯、南非、新西兰、加拿大、中国等25个国家或地区属于次级主导型节点,这些国家是区域性留学中心,其最大学生流流向了主导型国家或其他次级主导型国家,同时接收了从属型国家或地区的最大学生流。
图4
 新窗口打开|下载原图ZIP|生成PPT
图42001年全球留学网络等级层次结构
Fig. 4The hierarchical structure of international student mobility networks in 2001
2015年全球留学等级层次网络发生断裂,属于非连通网络(图5),除美国这一全球性主导型节点外,出现了德国、捷克2个区域性主导型节点,是波兰、波黑、塞尔维亚、奥地利等中东欧国家的首要留学目的地国;次级主导型节点从2001年的25个增加到32个,表明全球留学网络中出现了越来越多的区域性中心,比较明显的是中国成为了亚太和部分非洲国家或地区的首要留学目的地国;澳大利亚成为东亚和大洋洲留学网络的中心;俄罗斯成为中亚地区留学网络的中心;南非成为撒哈拉以南非洲国家或地区留学网络的中心;巴西成为南美洲国家留学网络的中心;沙特阿拉伯和阿联酋成为阿拉伯国家留学网络的中心;英国和法国是欧盟和部分有殖民历史联系的非洲和亚洲国家留学网络的中心。综合来看,2001—2015年全球留学生留学网络同时具有全球化和区域化两大演变趋势,越来越多的学生跨越地理边界,在全球范围内寻找优势教育资源。全球留学网络中出现了越来越多的区域性留学中心,表明区域化成为全球留学网络演化的一个重要趋势。
图5
 新窗口打开|下载原图ZIP|生成PPT
图52015年全球留学网络等级层次结构
Fig. 5The hierarchical structure of international student mobility networks in 2015
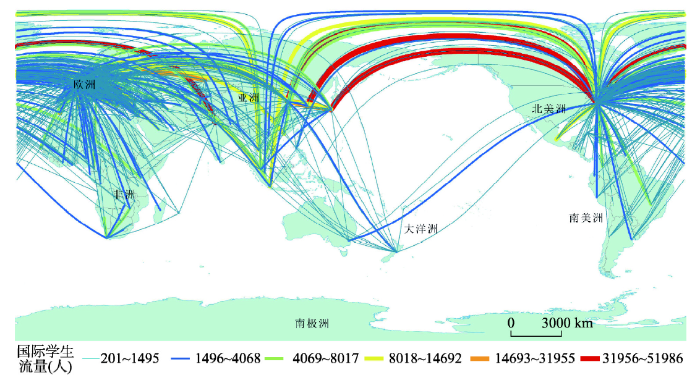
3.2.3 全球留学网络的地理空间特征 2001年全球留学网络主要呈现“东向西、南到北”的空间格局特征(图6),亚洲是全球留学生最大来源地,且主要流向美国和欧洲,来自广大发展中国家(南方)的留学生大规模地流向了发达国家(北方)。在留学生来源国方面,中国、韩国、日本和印度是全球主要学生来源国,约占全球总数的21.67%,其中向外流出的中国学生达13.2万人,约占全球总数的8.14%,韩国9.2万人,占全球的5.68%,日本6.9万人,占全球的4.24%,印度5.9万人,占全球的3.61%。在留学目的地国方面,美国、英国、德国和法国是全球留学的主要目的地国,其中美国是全球最大的目的地国,其招收国际学生达44.9万人,约占全球总数的27.61%,英国招收22.0万人,占全球13.53%,德国招收19.4万人,占全球的11.9%,法国招收14.3万人,占全球的8.78%。
图6
 新窗口打开|下载原图ZIP|生成PPT
图62001年全球留学网络的空间格局
Fig. 6The spatial pattern of international student mobility networks in 2001
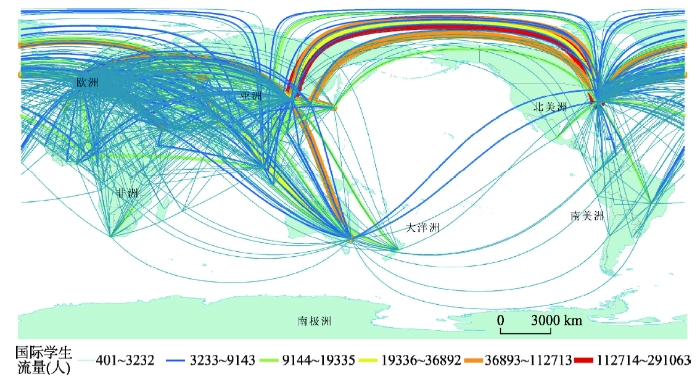
2015年全球留学网络“东向西、南到北”的地理空间格局发生了显著变化(图7),亚洲特别是东亚国家作为留学目的地国的角色地位逐渐上升。在留学生来源国方面,中国依旧是全球最大学生来源国,流出的学生总数达到81.4万人,占该时期全球总数的18.42%。印度超越上一时期的韩国和日本,成为仅次于中国的全球第二大学生来源国,出国留学的印度学生总数有27.2万人,占全球6.16%,其次是韩国17.3万人。此外,德国和尼日利亚出国留学的人数增长也较为显著,分别达到12.1万人和9.4万人,是全球第四和第五大学生来源国。在留学目的地方面,美国和英国依然是全球最大的两个留学目的地国,其中美国招收的留学生达到88.9万人,占全球的20.12%,英国招收43.0万人,占全球9.74%。该时期,中国和澳大利亚招收的国际学生数量增长较为显著,分别达到39.7万人和28.8万人,成为全球第三和第四大留学目的地国。总体来看,美国、英国、德国、法国等传统留学目的地国招收的学生占比呈现下降的趋势,中国、澳大利亚、马来西亚、阿联酋等国正在逐步成为区域性的留学中心,开始扮演留学目的地国的角色,这些国家的共同的特征是,拥有相对稳定的政治环境、经济发展水平较高、经济发展速度较快、拥有高质量大学。
图7
 新窗口打开|下载原图ZIP|生成PPT
图72015年全球留学网络的空间格局
Fig. 7The spatial pattern of international student mobility networks in 2015
4 全球留学网络结构演化影响因素
由于数据涉及全球留学网络中1834个网络关系样本,15年的时间序列,27510个截面的面板数据,所以在正式回归估计之前对数据进行了豪斯曼(Hausman)检验,来决定采用固定效应还是随机效应模型。检验结果p值为0.0000,强烈拒绝随机效应模型,故采用固定效应负二项回归模型对全球留学网络演化的影响因素进行回归估计(表2)。Tab. 2
表2
表2留学生流量回归结果
Tab. 2
| 变量 | 模型1 | 模型2 | 模型3 | 模型4 |
|---|---|---|---|---|
| 目的地国高等教育质量 | 0.0431*** | 0.0469*** | ||
| (0.0027) | (0.0028) | |||
| 目的地国高校在校生数量 | 0.0515*** | 0.0524*** | ||
| (0.0010) | (0.0010) | |||
| 目的地国人均GDP | 0.1498*** | 0.1508*** | ||
| (0.0027) | (0.0027) | |||
| 语言临近性 | -0.6509*** | -0.1589*** | ||
| (0.0343) | (0.0340) | |||
| 历史联系 | 0.4406*** | 0.7994*** | ||
| (0.0424) | (0.0414) | |||
| 地理距离 | -0.7300*** | -0.6092** | ||
| (0.2271) | (0.2419) | |||
| 目的地国全球化水平 | 0.2261*** | 0.0035 | 0.3313*** | 0.0321 |
| (0.0246) | (0.0242) | (0.0256) | (0.0254) | |
| 来源国全球化水平 | 0.1717*** | 0.0468** | 0.1588*** | 0.0397** |
| (0.0188) | (0.0190) | (0.0179) | (0.0190) | |
| 常数项 | 0.9470*** | 0.3582*** | 0.9059*** | 0.3294*** |
| (0.0215) | (0.0235) | (0.0274) | (0.0290) | |
| 样本数 | 27510 | 27510 | 27510 | 27510 |
| 关系对 | 1834 | 1834 | 1834 | 1834 |
| Wald chi2 | 166.65 | 12026.53 | 951.78 | 12409.43 |
| Prob > chi2 | 0.0000 | 0.0000 | 0.0000 | 0.0000 |
| Log likelihood | -137976.95 | -134414.42 | -137644.68 | -134242.95 |
新窗口打开|下载CSV
从模型1的回归结果来看,留学目的地国和留学生来源国的全球化水平均在1%水平上显著,表明两者均对全球留学生的流量和流向产生重要影响,国家越是开放,包括人口、技术、资本、信息在内的各种生产要素就流动越发频繁,社会、政治和文化的宽容度也就越高,对包括留学生在内的各种人才的吸纳能力越强。
从模型2的回归结果来看,留学目的地国高等教育质量、高校在校生数量及人均GDP均在1%水平上显著,且与留学生流量成正相关,表明对于留学生这类人才而言,留学目的地国的高等教育水平是首要考量因素,世界一流大学的名誉和声望是吸引全球优秀学子的重要因素;较高的在校生数量意味着目的地国巨大的高等教育规模及其高等教育的多样性,说明目的地国强大的吸纳能力;较高的人均GDP意味着稳定的宏观经济环境,更高的工资水平,这对留学生流动产生了一定的吸引力。
从模型3的回归结果来看,目的地国和来源国之间的语言临近性、历史联系和地理距离均通过了显著性检验,且在1%水平上显著,其中语言临近性与留学生流量成负相关,这与Chen等研究结果相似[34],英语作为世界通用语言,已经成为很多非英语国家参与国际交流的第二语言,大量非英语国家的学生向美国、英国、澳大利亚等英语国家流动,表明语言差异的阻抗作用在迅速的减弱;地理距离与学生流量成负相关,表明地理距离仍然是阻碍学生流动的一个重要因素。模型4进一步证明了回归结果的稳健性。
5 结论与讨论
5.1 结论
本文基于联合国教科文组织(UNESCO)和中国教育部发布的国际学生流动数据,研究全球留学网络时空演化及其影响因素,运用社会网络分析方法和负二项回归模型,全面刻画全球留学生留学网络空间结构上的等级层次性、非均衡性及集聚性等特性,进而揭示全球留学网络时空演化的影响因素。主要结论如下:(1)从全球留学网络的时序演化特征来看,2001—2015年全球留学网络节点数量从203个增加到212个,关系流从4921个增加到9137个,网络密度从0.120提升到0.204,网络平均聚类系数从0.686降至0.655,全球留学网络的平均度从24增加至43,平均加权度从8004迅速增加到20834,表明随着全球留学网络中留学生数量持续增加,留学路径也在不断增加,全球留学网络出现了越来越多的区域性留学中心,各国或地区在全球留学网络中的联系越来越密切,全球高等教育国际化、全球化程度显著提升。
(2)从全球留学网络的拓扑结构演化特征来看,2001—2015年全球留学网络产生了较大变异,从以美国为单一核心的拓扑结构演变成以中国和美国为双核心的拓扑结构,中国成为亚洲区域性留学中心,亚洲国家逐渐成为全球留学网络的主体,且留学网络比其他地区更加稠密。澳大利亚成为美国之外亚洲留学生的主要目的地之一,欧洲国家在全球留学网络拓扑结构中的中心性逐渐萎缩。
(3)从全球留学网络的空间结构演化特征来看,全球留学网络具有明显的等级层次性,美国是全球性主导型节点,德国、捷克是区域性主导型节点,次级主导型节点从25个增加到32个,中国、澳大利亚、俄罗斯、南非、巴西、沙特阿拉伯和阿联酋成为所在区域的重要留学中心;全球留学网络“东向西、南到北”的地理空间格局正在发生变化,区域化成为全球留学网络演化的一个重要趋势。
(4)留学目的地国高等教育质量、留学目的地国高校在校生数量、留学目的地国人均GDP、留学目的地国与留学生来源国间的历史联系以及留学目的地国和留学生来源国的全球化水平均在1%水平上显著,与留学生的流量成正相关关系。留学目的地国与留学生来源国之间的地理距离和语言临近性在1%水平上显著,且与留学生流量成负相关关系,表明语言差异的阻抗作用在迅速减弱,地理距离仍然是阻碍学生流动的一个重要因素。
5.2 讨论
本文从宏观视角探讨全球留学生留学网络的时空演化及其影响因素。但留学行为不仅仅是自由主义认为的理性经济决策,或者结构主义理论认为的核心国家对边缘国家的一种霸权或者控制,根据后现代结构主义的观点,留学是一种有意识的、多样性的人类活动,留学的行为和目的根植于特定时空背景下的日常生活和学习经历之中。因此,有必要在中观和微观尺度上开展留学网络时空演化规律研究,这样可能会更好地解释本文刻画的全球留学生流动的时空复杂性。正如本文开头所说,留学生流动是全球知识生产、转让和流通的重要途径,那么全球留学生流动网络和知识流动网络、科研合作网络、创新网络等是否存在相关关系?网络科学认为,一国的发展不仅依赖于其内在生产要素的投入,其在全球网络中的“关系资本”也会对其发展产生重要影响,留学网络在全球网络中的深度嵌入,成为各国重要的关系资本。因此,深入理解全球留学网络的发展演化规律,有助于我们更好地理解全球复杂贸易网络、文化转型过程和政治转型过程,未来有必要开展对这些复杂网络之间的相关性研究。参考文献 原文顺序
文献年度倒序
文中引用次数倒序
被引期刊影响因子
[本文引用: 1]
[本文引用: 1]
[本文引用: 1]
[本文引用: 1]
[本文引用: 1]
DOI:10.1111/geoj.12045URL [本文引用: 1]

A growing number of individuals are choosing to study abroad although, like other manifestations of globalisation, the sources and destinations of these migratory flows are highly uneven. Within the context of ongoing debates about the motives for overseas study, the reproduction of class advantage, and countries' competitive advantage for internationally mobile students, this paper seeks to improve understanding of these variations. We situate international student mobilities within a theoretical framework which connects recent work in geography, emphasising the differentiation advantage derived from foreign study, with insights more commonly applied to labour migration which emphasise costs and benefits. Our findings, based on a statistical analysis of a large sample of country pairs, call into question the central importance commonly ascribed to countries' university quality in shaping the mobilities of international students. Far more influential is income in destination countries, together with relational ties created by colonial linkages, common language and pre-existing migrant stocks. Unique to the literature, we not only demonstrate important differences in the determinants of international student mobilities between developed and developing countries, but also between different sub-groupings of developing countries. Indeed, an important insight from our study is that it may be useful to move beyond binary classifications, and to deploy more refined country categorisations in seeking to understand contemporary corporeal mobilities.
[本文引用: 1]
DOI:10.1007/BF01383539URL [本文引用: 1]
[本文引用: 6]
[本文引用: 6]
[本文引用: 1]
[本文引用: 1]
[本文引用: 2]
[本文引用: 2]
[本文引用: 1]
[本文引用: 1]
[本文引用: 1]
[本文引用: 1]
[本文引用: 3]
[本文引用: 3]
[本文引用: 1]
[本文引用: 1]
[本文引用: 1]
[本文引用: 1]
DOI:10.11821/xb200908002URL [本文引用: 1]
Today, air transport plays an important role in transportation systems, especially for medium and long distance. Based on complex network theory, Chinese aviation network is abstracted as a set of edges (linkages) connecting a set of nodes (cities), and 144 cities and 1018 air routes were chosen for this research operated from winter 2007 to spring 2008. Then, this paper analyzes the spatial structure of Chinese aviation network using indices of degree distribution, the average path length, the clustering coefficient, degree-degree correlation, and clustering-degree correlation. Degree is the number of edges that a node shares with others, and thus symbolizes the importance of the node in the network. Degree distribution is used to reflect the distribution function of degree and donates the statistical characteristics of a network. Average path length is defined as the average number of edges along the shortest paths for all possible node-pairs in the network and it is a measurememt of the efficiency of transportation network. The clustering coefficient of a node is the ratio of actual edges to maximal edges between nodes which are directly connected with the node. The clustering coefficient of the whole network is the average of all individuals. As for an airport network, the average path length and the clustering coefficient are the two most important parameters reflecting network properties and configurations. The results show that Chinese aviation network has a relatively small average path length of 2.23 and a relatively large cluster coefficient of 0.69. More importantly, the accumulative degree distribution follows an exponential expression, with significance of 0.977. Therefore, Chinese aviation network shows the characteristic of a "Small World" network. Due to most new airports' preferences for direct connections with the three top-level national hubs: Beijing, Shanghai, and Guangzhou, the network hierarchy has no distinct difference with the exception of the top one. Also, the spatial distribution of Chinese aviation network is imbalanced according to the indices of degree, clustering coefficient and accessibility index. Besides, the correlation coefficients of these indices mentioned above are analyzed. The results show that there are negative degree correlation, nonlinear clustering-degree correlation, positive accessibility-degree correlation, and slightly positive clustering-accessibility correlation. In conclusion, with the rapid development of air transport demand driven by the market economy, Chinese aviation network will further evolve to a combined model of "Scale Free" and "Small World" networks, and its spatial structure will be more complex.
DOI:10.11820/dlkxjz.2008.06.016URL [本文引用: 1]
Based on analyzing complex network theory applied in aviation, railway and urban transportation, we conclude that complexity of transportation network comes from its systematic complexity, and that the general analysis method of complex network ignores the attribute of geographic space, which brings out many problems in analyzing real-world network. Complex network analysis based on statistical physics is mostly about theoretical analysis or data modeling on topology network, which has greater disparity in transportation networks and dynamic mechanism. Transportation network includes four kinds of network structure: demand network, organization network, route network and infrastructure network, and is a compound networked structure with open complex system. Transportation is a kind of science which focuses strongly on practical application, so it needs a recurrent force to drive theory to modal and method, then to practice. We put forward in future some vital aspects of complexity analysis on transportation network, which includes (1) elemental recognition on the structure complexity of transportation system; (2) network complex analysis based on geographic spatial characteristics; (3) analysis and application of network structure based on organization and efficiency; (4) interplay between the network structure and flow caused by interaction; (5) character of local structure of network and its effect on global structure; and (6) network evolution affected by systemic open.
DOI:10.1016/j.jtrangeo.2017.10.019URL [本文引用: 1]
[本文引用: 1]
[本文引用: 1]
DOI:10.1002/1097-4679(197910)35:4<757::aid-jclp2270350413>3.0.co;2-bURLPMID:512000 [本文引用: 1]
Evaluated parental ratings on aggressiveness and social responsibility for 120 school-age children and a cross-validation sample of 67 children referred to a university-sponsored developmental evaluation center in association with 10 commonly used interdisciplinary diagnoses . Parental ratings consistently and significantly related to staff diagnoses of behavior disorder and to hyperkinesis. A number of "expected " relationships, e.g., between learning disability and social irresponsibility, did not occur. In general, the results indicate: (1) that parental ratings show consistent relationships to selected interdisciplinary staff diagnoses; (2) that hyperkinesis may be related more strongly to aggressiveness than to the lack of socially responsible behavior; and (3) that parental ratings are potentially valuable in the diagnostic process.
[本文引用: 2]
[本文引用: 2]
[本文引用: 1]
[本文引用: 1]
[本文引用: 1]
[本文引用: 1]
[本文引用: 3]
[本文引用: 3]
DOI:10.11821/dlxb201704014URL [本文引用: 1]
Despite increasing importance of academic papers in global knowledge flows, the structural disparities and proximity mechanism related to international scientific collaboration network attracted little attention. To fill this gap, based on data mining from Thomson Reuters' Web of Science database in 2014, its heterogeneities in topology and space were portrayed using visualizing tools such as Pajek, Gephi, VOSviewer, and ArcGIS. Topologically, 211 countries and 9928 ties are involved in global scientific collaboration network, but the international network of co-authored relations is mono-centricand dominated by the United States. It exhibits some features of a "small-world" network with the smaller average path length of 1.56 and the extremely large cluster coefficient of 0.73 compared to its counterpart, as well as the better-fitting exponential distribution accumulative nodal degree. In addition, the entire network presents a core-periphery structure with hierarchies, which is composed of 13 core countries and the periphery of 198 countries. Spatially, densely-tied and high-output areas are mainly distributed in four regions: West Europe, North America, East Asia and Australia. Moreover, the spatial heterogeneity is also observed in the distributions of three centralities. Amongst these, the countries with greater strength centrality are mainly concentrated in North America (i.e. the US and Canada), Western Europe (i.e. the UK, France, Germany, Italy and Spain), and China, noticeably in the US, which forms the polarizing pattern with one superpower of the US and great powers such as China and the UK. Similarly, the big three regions consisting of West Europe, North America and Asian-Pacific region have the peak betweenness centrality as well. Slightly different from the two above, the distribution of nodal degree centrality is uneven in the world, although regional agglomeration of high-degree countries is still observed. Last but not least, the proximity factors of its structural inequalities were also verified by correlational analysis, negative binomial regression approach and gravity model of STATA. The findings further confirm that geographical distance has weakened cross-country scientific collaboration. Meanwhile, socio-economic proximity has a positive impact on cross-country scientific collaboration, while language proximity plays a negative role.
[本文引用: 1]
[本文引用: 1]
[本文引用: 1]
[本文引用: 1]
[本文引用: 1]
[本文引用: 1]
DOI:10.1111/inr.12162URLPMID:25559068 [本文引用: 1]
In accordance with the process of nursing globalization, issues related to the increasing national and international mobility of student and qualified nurses are currently being debated. Identifying international differences and comparing similarities for mutual understanding, development and better harmonization of clinical training of undergraduate nursing students is recommended.
[本文引用: 1]
[本文引用: 1]
[本文引用: 1]
[本文引用: 1]
[本文引用: 1]
[本文引用: 1]
[本文引用: 1]
