 ,1,2, 许刚3,4, 徐智邦1,2, 董婷1,21.
 2.
3.
4.
The relationship between urban spatial growth and population density change
ZHAO Rui1,2, JIAO Limin,1,2, XU Gang3,4, XU Zhibang1,2, DONG Ting1,21. 2.
3.
4.
通讯作者:
收稿日期:2018-12-5修回日期:2019-12-20网络出版日期:2020-04-25
| 基金资助: |
Received:2018-12-5Revised:2019-12-20Online:2020-04-25
| Fund supported: |
作者简介 About authors
赵睿(1995-),女,贵州安顺人,硕士生,研究方向为城市土地扩张E-mail:ZhaoRui27@whu.edu.cn。

摘要
关键词:
Abstract
Keywords:
PDF (4990KB)元数据多维度评价相关文章导出EndNote|Ris|Bibtex收藏本文
本文引用格式
赵睿, 焦利民, 许刚, 徐智邦, 董婷. 城市空间增长与人口密度变化之间的关联关系. 地理学报[J], 2020, 75(4): 695-707 doi:10.11821/dlxb202004003
ZHAO Rui.
1 引言
随着全球范围内城市人口的不断增加,城市土地持续的向外扩张,城市土地扩张快于城市人口增长的现象已十分普遍,进而导致城市人口密度随时间下降[1,2,3]。城市人口密度是衡量城市的重要属性,诸多城市要素均与人口密度紧密关联。已有研究发现城市能源使用效率随人口密度上升而提高,人均碳排放量随人口密度上升而减少。在城市增长过程中,城市人口密度随时间下降的现象将加剧城市蔓延,进而给城市及其周边耕地资源和生态环境带来巨大压力,严重阻碍区域可持续发展。中国正经历快速城镇化阶段,未来仍将有数亿人口转移至城市,而受土地资源特别是耕地资源限制,城市土地扩展的空间有限。研究城市空间增长方式与人口密度变化之间的关系是科学规划城市空间发展和布局的基础,对于科学划定城市边界、实现城市紧凑集约可持续发展具有重要意义。现有关于城市空间增长的研究大多侧重于对其时空特征及演化的分析,主要包括:城市空间增长的规模、要素、结构和形态研究[4];城市空间增长的方式、机制和测度方法的探讨[5,6,7];使用分形理论或借助城市土地密度对城市空间增长特征的研究[8,9,10,11,12,13,14];构建城市扩张自由度、紧凑度、蔓延度等指标对城市空间增长过程进行综合度量等[15,16]。针对城市人口密度,现有研究多集中在以下几个方面:① 城市人口密度的空间分布格局,包括全国尺度、省域尺度的城市人口密度空间分布格局及模型研究[17,18,19];② 城市人口密度的时空变化,主要从全球视角和城市市辖区的角度研究人口密度变化趋势和影响因素[20,21,22]。
尽管国内外****对城市空间增长和人口密度展开了大量的研究,但是缺乏城市空间增长与人口密度变化两者之间关联的研究。紧凑的空间增长是否会提高人口密度?该效应在中国和欧洲城市之间有何区别?城市空间增长与人口密度变化之间的关联关系至今并不清楚,而两者之间的关系却是城市可持续发展研究的基础,对于今后城市规划决策和土地政策制定具有指导意义与参考价值。
本文以进入城市化稳定阶段的欧洲和快速城市化的中国为研究区,选取23个人口在100万以上的城市作为样本,根据研究区1990年、2000年和2014年3期土地利用数据计算城市土地密度。利用圈层分析和反S函数对城市土地密度进行拟合,通过拟合的参数计算各时段城市空间增长速率,建立刻画城市空间增长的紧凑度指标,最后探讨城市空间增长与人口密度之间的关联关系,为今后的土地政策和城市规划提供参考和决策支持。
2 数据来源及方法
2.1 研究区与数据来源
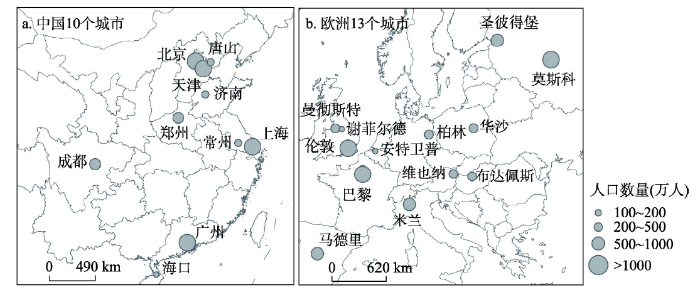
本文选取中国和欧洲23个城市作为研究区,土地利用数据和人口密度数据来源于纽约大学、联合国人居署和林肯土地政策研究中心联合研究的城市扩张项目所公布的数据集(The Atlas of Urban Expansion(2016 Edition))[23]。本文选用该数据原因如下:① 数据集内200个城市的数据处理规则统一、处理过程清晰明确。该数据集包含了全球代表性的200个样本城市在1990年、2000年和2014年的人口和土地利用数据。土地利用数据来源于空间分辨率为30 m的Landsat影像,通过非监督分类方法(ISODATA)解译遥感影像得到城市用地、开放空间和水体3种城市土地利用类型[24]。通过Google Earth高空间分辨率遥感影像对非监督分类结果进行验证和评估,结果显示城市用地的用户精度为91%,生产者精度为89.3%[23]。在城市范围和城市用地的界定上,以遥感影像解译得到的城市用地和开放空间作为城市组团,面积最大的城市组团界定为主城区。对主城区以外的组团建立面积为该组团自身面积1/4的缓冲区,如果缓冲区与主城区相交,则该组团与主城区共同构成城市范围。本研究涉及的中国和欧洲样本城市的范围统一界定为数据集中的组团连同主城区构成的城市范围,建成区面积为遥感影像解译得到的城市用地面积;城市人口数据来源于各城市的人口普查数据,来源途径包括:哥伦比亚大学国际地球科学信息中心(http://www.ciesin.org),WorldPop网站(www.citypopulation.de),中国科学院以及各国家的人口统计局网站[23]。通过统计所界定的城市用地范围内的人口,计算出相应的建成区人口密度。② 数据集内的数据及其结论得到多位****的应用,其适应性和合理性得到验证。在东南亚3个特大城市扩张的宏观模式和微观动态的研究[25],以及全球120个城市建成区与夜间灯光指数之间关系的研究中[26],****均采用该数据集内的土地利用数据和人口数据,该数据集的适用性和在全球不同城市之间的可比性均予以验证。本文从数据集中选取人口100万以上的23个中国和欧洲城市作为研究样本,其中包括13个欧洲城市:伦敦、巴黎、莫斯科、圣彼得堡、柏林、曼彻斯特、米兰、马德里、华沙、布达佩斯、维也纳、安特卫普、谢菲尔德;10个中国城市:北京、上海、广州、常州、成都、海口、济南、唐山、天津、郑州(研究样本空间分布如图1所示)。土地利用数据和人口数据的研究时点为3个时间点(1990年、2000年、2014年),3种土地利用类型为:城市用地(建成区)、开放空间和水体。
图1
 新窗口打开|下载原图ZIP|生成PPT
图1中国和欧洲23个研究城市空间分布及其2014年人口数量
Fig. 1The spatial distribution of 23 sample cities in China and Europe (a. 10 cities of China; b. 13 cities of Europe)
本文选取的样本城市具有代表性和可比性。中欧处于不同的经济发展背景,欧洲经济发展水平居各大洲之首,绝大多数国家都是发达国家,具有较高的城市化率;中国是世界上最大的发展中国家,近40年来经济保持稳步高速增长,中国的城市处于快速城市化阶段。欧洲是最早进入城市化的地区,随着工业革命的发展和深入,在1950年城市化率已达51.3%[27],当今欧洲大部分地区,城市化率已超过80%并稳定在80%~90%之间[28]。就城市形态而言,“紧凑型城市”的特征是高密度和相对较短的通勤距离[29],欧洲的城市常被看作是紧凑的[30]。欧洲南部的城市最为紧凑,中欧和北欧相比南欧和西欧城市密度较低[31],其城市结构较松散不连续,人口密度相对于其他区域较低[28]。当今中国正处在与20世纪50年代欧洲同样的快速城镇化阶段,在2013年中国城市化率达到53.73%[27]。城市化快速发展的进程中,每年将有大量新增人口涌入城市,为满足人们的生活生产需求,中国的城市用地呈不断扩张的趋势。主要大城市在1990—2010年间经历了快速低密度扩张的过程,城市建设用地人口密度平均每年下降3%~4%[32]。样本城市之间的基础设施较为完善,整体上呈紧凑型发展,人口密度较高;在私家车持有率不断上升的情况下,中欧城市的居民出行大部分依赖于公共交通;样本城市在2014年人口均达到100万以上,属于大城市。将不同发展阶段的样本城市对比分析,研究结论对快速城市化地区的城市发展决策更具有参考价值。
2.2 研究方法
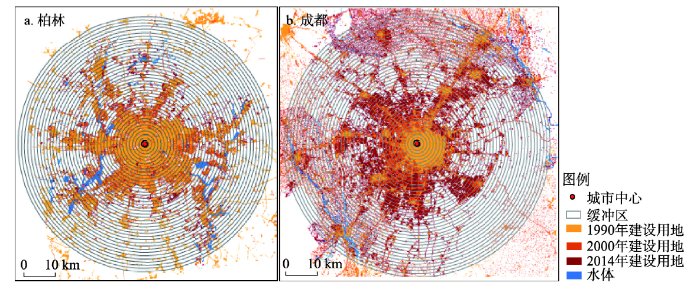
2.2.1 圈层分析法 研究选用圈层法来探究各圈层内城市土地密度的空间梯度变化。以The Atlas of Urban Expansion数据集[23]提供的各城市1990年CBD中心的经纬度,结合高分辨率互联网地图和道路网数据进行检验和核查,最终确定城市中心。以城市中心每隔1 km向外做缓冲区,直至最外圈层覆盖2014年的城市土地范围为止(图2)。在形成的圈层结构基础上,分别计算各圈层内的城市土地密度。城市土地的圈层密度(Density)计算公式为:式中:Sbuilt-up为缓冲区内各圆环的建设用地面积;Sring为缓冲区内各圆环的面积;Swater为缓冲区内各圆环的水体面积。
图2
 新窗口打开|下载原图ZIP|生成PPT
图23期土地利用数据以及缓冲区
Fig. 2The buffer areas and urban land area at three time points in Berlin (a) and Chengdu (b)
2.2.2 反S函数 Jiao以2015年中国28个主要城市为样本,研究不透水表面密度到城市中心距离的递减规律,提出了反S函数对这种不透水表面密度的分布进行拟合[33]。本文运用该反S函数对23个样本城市的土地圈层密度分布进行拟合分析,根据拟合结果得到每个城市基于土地密度的城市形态。反S函数如下:
式中:
根据反S函数拟合的参数,按公式(3)计算每个研究时点的紧凑度,即函数拟合得到的内城区与城区半径的比值。紧凑度KP值与参数α互为反比,若后一时点相对于前一时点KP值减小,则表征研究期内城市往紧凑方向发展。紧凑度(KP)计算公式如下[33]:
式中:
反S函数拟合得到的参数
式中:Dt为研究期末城市半径;D0为研究期初城市半径;n为研究时段。
3 结果与分析
3.1 人口密度变化
本文采用的人口密度数据为数据集所提供的数据,计算的人口密度为总体城市人口密度,定义为城市常住人口和建成区面积之比。样本城市3个研究时点的人口密度总体变化情况如图3所示。图3
 新窗口打开|下载原图ZIP|生成PPT
图3样本城市人口密度(a)和中欧人口密度变化对比图(b)
Fig. 3Temporal variations of population density (a) and comparison of population density changes in China and Europe (b)
所有城市在3个时点的总人口数和建成区面积都呈一个持续上升的状态。在3个不同研究时段,样本城市的人口密度除伦敦、曼彻斯特、谢菲尔德和上海在2000—2014年内人口密度上升外,几乎都呈下降状态,但这4个城市人口密度上升速率也仅为0.64%、0.50%、0.21%、0.36%。对比中欧的样本城市,中国城市人口密度总体较欧洲城市人口密度高,在1990年中国城市平均人口密度为146.86人/hm2,欧洲城市平均人口密度为87.51人/hm2,但中国城市人口密度降低速率相对较快,2014年欧洲人口密度降低为55.23人/hm2,中国人口密度却降低为68.36人/hm2。对比分析可发现,人口密度降低普遍存在于中国和欧洲城市中,中国城市具有人口密度高、降低速率快的特点,欧洲城市虽然总体人口密度较中国城市低,但降低速率较慢。
3.2 城市空间增长
运用公式(1)计算各个城市相应的圈层土地密度值,根据公式(2)在Matlab 2014软件中采用非线性最小二乘法拟合23个城市土地密度,得到城市土地密度分布反S函数的拟合参数结果如表1所示,23个城市的土地密度函数空间衰减模式及拟合曲线如图4所示。Tab. 1
表1
表1反S函数拟合参数
Tab. 1
| 城市 | 1990年 | 2000年 | 2014年 | |||||||||||
|---|---|---|---|---|---|---|---|---|---|---|---|---|---|---|
| ɑ | c | D | R2 | ɑ | c | D | R2 | ɑ | c | D | R2 | |||
| 北京 | 4.578 | 0.116 | 25.98 | 0.995 | 5.336 | 0.152 | 29.06 | 0.994 | 4.663 | 0.259 | 35.55 | 0.988 | ||
| 上海 | 1.791 | 0.117 | 25.17 | 0.966 | 2.784 | 0.111 | 44.57 | 0.984 | 4.259 | 0.086 | 64.51 | 0.990 | ||
| 广州 | 1.561 | 0.047 | 8.51 | 0.980 | 1.512 | 0.133 | 22.14 | 0.956 | 1.453 | 0.248 | 30.43 | 0.965 | ||
| 天津 | 3.828 | 0.067 | 15.59 | 0.995 | 3.850 | 0.076 | 16.93 | 0.994 | 3.554 | 0.247 | 23.82 | 0.990 | ||
| 成都 | 3.403 | 0.022 | 11.70 | 0.996 | 5.615 | 0.080 | 18.58 | 0.995 | 3.922 | 0.159 | 29.78 | 0.976 | ||
| 常州 | 4.191 | 0.047 | 7.49 | 0.999 | 5.039 | 0.134 | 13.13 | 0.997 | 4.708 | 0.261 | 18.05 | 0.995 | ||
| 郑州 | 4.202 | 0.087 | 12.14 | 0.995 | 5.965 | 0.134 | 15.26 | 0.996 | 4.263 | 0.172 | 27.25 | 0.991 | ||
| 济南 | 3.852 | 0.101 | 13.56 | 0.993 | 3.760 | 0.126 | 15.36 | 0.992 | 3.465 | 0.171 | 19.15 | 0.994 | ||
| 唐山 | 2.613 | 0.113 | 8.00 | 0.979 | 3.115 | 0.148 | 9.42 | 0.976 | 2.737 | 0.259 | 12.18 | 0.967 | ||
| 海口 | 1.935 | 0.041 | 5.10 | 0.970 | 2.344 | -0.181 | 9.06 | 0.965 | 3.236 | -1.015 | 18.19 | 0.956 | ||
| 伦敦 | 2.652 | 0.047 | 35.22 | 0.983 | 2.996 | 0.092 | 37.29 | 0.984 | 3.319 | 0.113 | 38.25 | 0.986 | ||
| 巴黎 | 2.980 | 0.091 | 33.89 | 0.989 | 3.880 | 0.157 | 36.29 | 0.991 | 4.436 | 0.246 | 37.92 | 0.990 | ||
| 柏林 | 2.190 | 0.053 | 14.78 | 0.996 | 2.571 | 0.041 | 20.85 | 0.998 | 2.716 | 0.098 | 22.76 | 0.997 | ||
| 莫斯科 | 2.231 | 0.124 | 24.32 | 0.987 | 2.631 | 0.172 | 28.20 | 0.987 | 2.537 | 0.212 | 30.04 | 0.981 | ||
| 马德里 | 3.395 | 0.070 | 12.93 | 0.989 | 3.161 | 0.094 | 14.89 | 0.988 | 3.057 | 0.134 | 18.27 | 0.985 | ||
| 维也纳 | 2.742 | 0.054 | 12.95 | 0.997 | 3.105 | 0.069 | 16.39 | 0.998 | 3.403 | 0.088 | 17.41 | 0.997 | ||
| 米兰 | 2.851 | 0.155 | 14.19 | 0.957 | 2.846 | 0.202 | 15.52 | 0.956 | 2.854 | 0.279 | 19.28 | 0.955 | ||
| 华沙 | 1.950 | 0.055 | 12.38 | 0.978 | 2.408 | 0.081 | 15.13 | 0.983 | 2.662 | 0.125 | 17.89 | 0.981 | ||
| 圣彼得堡 | 3.513 | 0.083 | 21.38 | 0.987 | 3.623 | 0.122 | 22.01 | 0.985 | 3.658 | 0.149 | 24.34 | 0.987 | ||
| 布达佩斯 | 3.218 | 0.098 | 15.74 | 0.983 | 3.266 | 0.116 | 16.01 | 0.981 | 3.334 | 0.183 | 17.82 | 0.971 | ||
| 曼彻斯特 | 2.092 | 0.004 | 19.92 | 0.973 | 2.205 | 0.033 | 21.41 | 0.975 | 2.248 | 0.017 | 22.20 | 0.975 | ||
| 谢菲尔德 | 2.551 | 0.067 | 10.30 | 0.987 | 2.733 | 0.078 | 10.80 | 0.986 | 2.749 | 0.081 | 10.91 | 0.987 | ||
| 安特卫普 | 1.944 | 0.106 | 10.39 | 0.974 | 1.953 | 0.151 | 10.14 | 0.971 | 2.102 | 0.191 | 10.28 | 0.968 | ||
新窗口打开|下载CSV
图4
 新窗口打开|下载原图ZIP|生成PPT
图4不同圈层内城市不透水表面密度随到城市中心的空间变化及反S函数拟合曲线
Fig. 4The spatial variation of impervious surface density in different circles with the distance to city center and the curve fitted by inverse S function
由表1可以看出,函数拟合效果均很好,R2基本在0.9以上;① α值反映城市形态的紧凑程度,α值越大城市越紧凑,样本城市在3个时点α值的取值范围在1.453~5.965之间;② c值是城市边缘腹地的土地密度值,样本城市在3个时点c值的取值范围在-1.015~0.279之间。一般c值都小于0.1,若出现比较大的数值,如米兰达到0.279,这是大都市区的大城市几乎连续性的连接到周边城市的特点;③ D值代表城市半径,每个城市的城市半径随着时间的推移都在逐渐增大,但增长速率有所差异。1990年城市半径最小和最大的城市分别为海口和伦敦,2014年城市半径最小和最大的城市分别为安特卫普和上海。
曲线形态反映城市扩张情况,紧凑城市的曲线在接近城市中心的位置较平缓,中部快速下降呈陡峭的形状,而快速扩张的城市曲线大幅度向后右偏移。总体上看,中国样本城市在1990年较紧凑,尤其郑州、天津、常州、成都、北京等城市紧凑程度明显。2000年后中国样本城市便开始快速扩张,并且第二个时段扩张的幅度大于第一个时段,例如济南、唐山、天津、郑州、成都、北京,而广州和常州在两个研究时段城市扩张幅度都较大;欧洲的样本城市相对于中国样本城市来说,在1990年相对松散,从曲线可以明显看出柏林、莫斯科、曼彻斯特等城市的曲线向右后偏移,城市处于较松散的状态,而1990年后,除柏林在整个研究时段内扩张程度较大外,其他欧洲城市紧凑程度变化没有中国城市明显。
3.3 城市空间增长与人口密度变化的关系
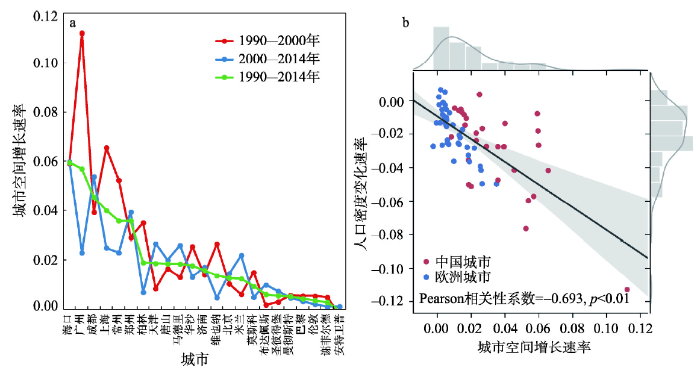
3.3.1 空间增长速率与人口密度变化的关系 根据反S函数拟合得到城市半径估计值D,以城市半径的变化表征城市空间增长速率的变化。通过公式(4)计算每个城市3个时段的城市空间增长速率(图5a),并对应相同时段的人口密度变化速率做相关性分析(图5b)。图5
 新窗口打开|下载原图ZIP|生成PPT
图5不同时段样本城市空间增长速率(a)与城市空间增长速率和人口密度变化速率相关性(b)
Fig. 5Urban spatial growth rate of sample cities in different periods (a) and correlation between urban spatial growth rate and population density change rate (b)
在1990—2014年整个研究时段内样本城市空间增长速率在0.00~0.11之间,海口、广州、成都、上海等中国城市空间增长速率较高在0.04以上,而安特卫普、谢菲尔德、伦敦、巴黎等欧洲城市空间增长速率较低在0.01以下;2000—2014年相对于1990—2000年城市空间增长速率减小的城市共11个,其中3个中国城市、8个欧洲城市;2000—2014年相对于1990—2000年城市空间增长速率增大的城市共12个,其中7个中国城市,5个欧洲城市。由此看出,研究期内欧洲大部分城市空间增长速率在降低,中国大部分城市空间增长速率在增大。计算Pearson相关系数研究城市空间增长速率与人口密度变化速率之间的相关关系,得到相关系数为-0.693,两者呈强负相关关系。
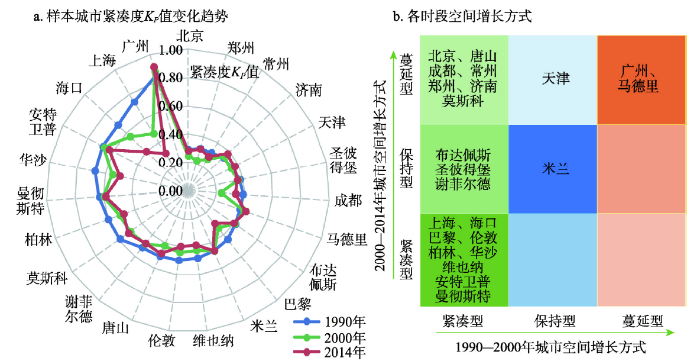
3.3.2 空间增长方式与人口密度变化的关系 通过缓冲区分析计算各圈层内土地密度,由反S函数拟合得到各参数,并计算紧凑度KP值。紧凑度表征的是某一时点土地密度快速下降的范围占整个城市半径的比值,可刻画某一时点城市形态特征;KP值越小城市形态越紧凑,反之越松散。两个时点KP值的变化可描述这段研究期内城市紧凑度的变化,利用两个时点KP值的差值来刻画研究期内城市空间增长方式。本文定义若城市后一个时点相对于前一个时点KP值增大,该城市空间增长方式为蔓延型;若KP值减小,该城市空间增长方式为紧凑型;若KP值不变(前后两个时点KP的差值小于0.01),该城市空间增长方式为保持型。不同时期均采用这一标准进行分类[33]。计算3个时点样本城市的紧凑度KP值(图6a),根据两个时点紧凑度KP值的差值来表征1990—2000年、2000—2014年两个时段的城市空间增长方式(图6b)。
图6
 新窗口打开|下载原图ZIP|生成PPT
图6各时点样本城市紧凑度KP值变化趋势(a)及各时段空间增长方式(b)
Fig. 6The trend of urban compactness
研究结果表明,大部分样本城市KP值在0.3~0.6之间。1990年中国大部分城市为紧凑城市,欧洲城市相对而言较松散。1990—2000年这一研究时段大部分样本城市空间增长方式为紧凑型,2000—2014年大部分中国城市空间增长方式演变为蔓延型,欧洲一部分城市空间增长方式演变成保持型,另一部分城市依旧维持紧凑型。中国城市在2000年后进入工业化中高级阶段,快速的经济增长和城镇化促使土地需求增大,城市转变为蔓延型空间增长。
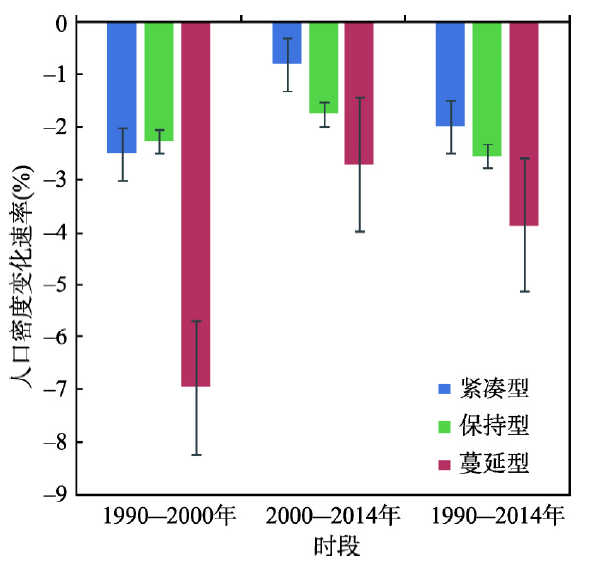
计算不同时段样本城市紧凑型、蔓延型和保持型3种不同城市空间增长方式所对应的城市人口密度几何增长率(图7),将城市空间增长方式与人口密度变化速率结合分析(图8),研究两者之间的关联关系,得到以下结果:
图7
 新窗口打开|下载原图ZIP|生成PPT
图7不同空间增长方式的城市在各研究时段的平均人口密度降低速率
Fig. 7The population density decline rate of sample cities with different land growth modes in each research period
图8
新窗口打开|下载原图ZIP|生成PPT图8不同城市空间增长方式对应的人口密度变化速率
Fig. 8Population density change rate of sample cities with different land growth modes
(1)紧凑型的空间增长不一定会带来人口密度的升高,但可以减缓人口密度降低的速率。样本城市中,除伦敦、曼彻斯特、谢菲尔德和上海这4个城市在2000年人口密度升高,其余城市人口密度都呈下降的状态。以紧凑型方式增长的城市,人口密度并没有升高,而是相对于蔓延型城市来说,人口密度降低速率减小。3个研究时段中,蔓延型空间增长城市的平均人口密度降低速率都远大于紧凑型空间增长城市的人口密度降低速率。因此,紧凑型的空间增长并不一定会带来人口密度的升高,但倾向于减缓城市人口密度下降的速率。
(2)当城市连续两个时段以紧凑型方式增长,第二时段人口密度降低速率减小;当第二时段以蔓延型方式增长时,则人口密度降低速率增大。1990—2000年这一研究时段内,样本城市以紧凑型作为主要空间增长方式,其中有19个城市为紧凑型空间增长;2000—2014年,若城市继续以紧凑型方式增长,则人口密度下降速率较上一时段减小,若城市转变为蔓延型空间增长方式,则人口密度降低速率较上一时段增大。若城市本身为蔓延城市,两个研究时段依旧以蔓延型增长方式扩展的话,第二个时段人口密度降低速率会小于第一个时段人口密度降低速率。
(3)第一时段中国和欧州城市几乎都以紧凑方式增长,人口密度降低速率差异不大;第二时段中国城市以蔓延型方式增长,人口密度降低速率增大。欧洲以紧凑型和保持型方式增长,人口密度降低速率减小。1990—2000年这一时段中欧城市大部分以紧凑型空间增长方式进行扩展,两个研究区城市的平均人口密度降低速率没有较大差异;2000—2014年这一时段中国处于快速城镇化阶段,城市转变为蔓延型空间增长方式,进而导致人口密度降低速率增大。而欧洲城市已达到较高城市化率水平,除莫斯科和马德里外其余城市空间增长方式继续以紧凑型方式增长或转变为保持型空间增长方式,人口密度降低速率减小。
4 结论与讨论
4.1 结论
本文采用定量方法刻画城市形态并划分城市空间增长方式(紧凑型、保持型和蔓延型)。在此基础上,本文首次探讨城市空间增长与城市人口密度随时间变化的关联关系,并对比分析了中国和欧洲城市空间增长及其与人口密度变化关联关系的差异。具体结论如下:(1)中欧城市人口密度普遍随时间降低,中国城市人口密度相对较高且降低速率较快,欧洲城市人口密度相对较低且降低速率较慢;1990—2014年中国城市半径的增长速率明显快于欧洲城市半径的增长速率。城市空间增长速率与人口密度变化速率呈现强负相关关系(Pearson相关系数为-0.693)。
(2)1990—2000年中欧城市几乎都以紧凑型方式增长。2000—2014年中国城市以蔓延型方式增长,且人口密度随时间下降的速率加快;欧洲城市以紧凑型和保持型方式增长,人口密度降低速率减小。
(3)紧凑型的空间增长方式并不一定会带来人口密度的升高,但会减缓人口密度下降的速率。中欧城市对比分析表明城市维持紧凑型空间增长方式,则城市人口密度随时间下降速率减慢;而由紧凑型转为蔓延型空间增长方式,将加剧城市人口密度随时间下降。
4.2 讨论
中国当前正处于城镇化快速发展阶段,推进城镇化又好又快发展需要统筹协调城市空间增长和城市人口增长。研究城市空间增长与人口密度变化的关联关系,并对比分析处于不同发展阶段的世界其他地区的城市化进程对中国未来城市化决策具有重要借鉴价值。现有研究表明城市人口密度随时间下降是一种全球普遍现象和长期历史趋势[22],本研究的中欧典型城市分析也进一步验证了这一趋势。城市人口密度随时间下降反映出人均建设用地面积增加,这将提高人口城镇化的土地成本。城市人口密度下降在中国快速城市化进程中也具有普遍性,结合中国“人多地少”的基本国情,我们认为亟需采取有效措施减缓或抑制城市人口密度下降趋势。值得警惕的是,即使在欧洲高度城市化的发达国家,城市人口密度仍然呈现下降趋势。这提示我们,抑制城市人口密度下降需要长期持续关注并采取有效措施。在城市化进程中,节约集约利用土地、提高土地利用效率、提高城市综合承载力必须作为长期坚持的基本方针,才能应对人均土地资源消耗惯性增加的巨大挑战,这对于保障中国耕地安全、生态安全和可持续发展都具有重大意义。本研究证明了紧凑型空间增长方式可以有效减缓城市人口密度随时间下降的速度。该发现既对紧凑城市研究具有理论价值,又对城市规划的实践具有指导意义。面向可持续发展目标,中国城市应充分考虑城市人口密度下降的风险,采取紧凑型空间增长战略,可采用的措施包括但不限于:划定城市增长边界(Urban Growth Boundary, UGB);优先发展公共交通,鼓励城市土地混合利用,提高土地利用效率;实施城市更新和低效用地再开发,维持和提高中心城区的吸引力等。
城市空间增长与城市人口密度变化是一个长期动态过程。受限于数据可获得性,本文只探讨了1990年以来中国和欧洲主要城市的城市空间增长与人口密度变化的差异。在未来研究中,横向上要加强中国城市与美国、日本等发达国家城市的对比,探究不同国家城市的发展差异;纵向上要深入城市内部,探究更细尺度的空间增长与人口密度变化的关联机制。此外,随着海量新兴数据的不断涌现,结合多源数据感知不同类别人口的密度变化将有助于进一步深入理解城市空间增长和城市人口密度变化的微观机制。
参考文献 原文顺序
文献年度倒序
文中引用次数倒序
被引期刊影响因子
DOI:10.1177/016001700761012710URL [本文引用: 1]
DOI:10.1016/j.progress.2011.04.001URL [本文引用: 1]
[本文引用: 1]
[本文引用: 1]
[本文引用: 1]
[本文引用: 1]
[本文引用: 1]
[本文引用: 1]
[本文引用: 1]
[本文引用: 1]
[本文引用: 1]
DOI:10.11821/xb200303003URL [本文引用: 1]

The author finds that the character of self-similarity is very clear in Hangzhou when he studies the evolution of urban morphology and structure of urban land use using the theory of fractals. By dint of the box counting method, several maps of urban land use of different years are utilized to extract the basic data, and then the fractal dimensions of urban morphology and seven kinds of land are calculated. It is not difficult to find that most of the standard error σ are less than the criterion δc = 0.04, which was put forward by Benguigui et al. The author finds that the status of fractals of urban morphology and land use structure tend to be better with the elapse of time, which testify the viewpoint of foreign scholars about the evolving city fractals. Another important findings of the paper is that the fractal dimension of every land use is less than that of the total urban morphology, which is only a theoretical deduction before. From the viewpoint of spatial-temporal change, the fractal dimension of Hangzhou's urban morphology tends to be increasing, and in 1996 it is near D = 1.71, a mean value of fractal dimension summarized by Batty et al. As far as different urban land use of Hangzhou is concerned, the fractal dimensions of residential, industrial and external traffic land tended to be increasing from 1980 to 1996, while the fractal dimensions of education and virescence land tended to be decreasing during the same period.
DOI:10.11821/xb200303003URL [本文引用: 1]
The author finds that the character of self-similarity is very clear in Hangzhou when he studies the evolution of urban morphology and structure of urban land use using the theory of fractals. By dint of the box counting method, several maps of urban land use of different years are utilized to extract the basic data, and then the fractal dimensions of urban morphology and seven kinds of land are calculated. It is not difficult to find that most of the standard error σ are less than the criterion δc = 0.04, which was put forward by Benguigui et al. The author finds that the status of fractals of urban morphology and land use structure tend to be better with the elapse of time, which testify the viewpoint of foreign scholars about the evolving city fractals. Another important findings of the paper is that the fractal dimension of every land use is less than that of the total urban morphology, which is only a theoretical deduction before. From the viewpoint of spatial-temporal change, the fractal dimension of Hangzhou's urban morphology tends to be increasing, and in 1996 it is near D = 1.71, a mean value of fractal dimension summarized by Batty et al. As far as different urban land use of Hangzhou is concerned, the fractal dimensions of residential, industrial and external traffic land tended to be increasing from 1980 to 1996, while the fractal dimensions of education and virescence land tended to be decreasing during the same period.
[本文引用: 1]
[本文引用: 1]
[本文引用: 1]
[本文引用: 1]
[本文引用: 1]
[本文引用: 1]
[本文引用: 1]
[本文引用: 1]
[本文引用: 1]
[本文引用: 1]
[D].
[本文引用: 1]
[D].
[本文引用: 1]
DOI:10.18402/resci.2016.01.06URL [本文引用: 1]
Synthetic multi-scale expansion measurements are essential to identifying inherent urban sprawl driving forces and dynamic principles,approaching effective national urban sprawl control,and facilitating neo-urbanization and ecological civilization construction in China. We characterized urban sprawl from 2000 to 2012 in 216 major cities in China using degree-of-freedom,degree-of-sprawl and conceptual degree-of-goodness metrics. We found that despite overall compact urbanization sprawl observed in China,the relatively low-quality urban growth contributed by the expansion under uncontrolled modes was still scared. This showed different characteristics of urban sprawl at varied scales;specifically,the major sites for sprawl in eastern and central China with high degree-of-freedom and degree-of-sprawl values, which were mixed in different areas, obtained less comfortable expansion. Relatively low-quality expansion processes were observed in Guangdong,Hebei,Shandong,Henan and Anhui,while autonomous and western regions experienced more amicable urban growth. Although general compact growth patterns were generated in metropolitan areas,they were less coordinated,i.e.,high heterogeneous expansion in space and low-quality urban growth in some local parts from a conceptual perspective. It is predicated that inland and metropolitan districts will be major sites where urban land will be developed in coming decades. At the city scale,Guangzhou,Shijiazhuang,Ji’nan,Hefei and Xiangtan have lower degree-of-goodness values for urban sprawl. Initiatives to achieve hierarchical (national,regional,and local city levels)urban sprawl monitoring and management frameworks are vital tasks for integrated and balanced urban land development in time and space,high quality urbanization patterns,and sustainable urban development in China.
DOI:10.11821/xb200704010URL [本文引用: 1]
The Yangtze River Delta is one of the economically developed coastal areas. From the late 1970s, its urbanization process has been quickened greatly, which resulted in the number increase and the spatial expansion of urban areas. The Landsat MSS, TM/ETM satellite images, which were respectively acquired in 5 periods of 1979, 1990, 1995, 2000 and 2005, were used to extract urban land information and analyze urban growth data with the help of remote sensing and GIS softwares. We analyzed the spatio-temporal characteristics including urban growth speed, growth intensity, fractal dimension and urban growth pattern. Additionally, dynamics of urban expansion in the Yangtze River Delta were also analyzed. The results are drawn as follows: (1) From 1979 to 2005, the growth speed of urbanization area was accelerating obviously. The quantities of increasing area of urbanized land were 37.66 , 112.43 km2, 274.86 km2 and 421.73 km2 in the past four periods (1979-1990, 1990-1995, 1995-2000 and 2000-2005), respectively. Meanwhlie, the growth intensities of urbanized land enhanced gradually. From 1979 to 1990, the growth intensity was only 0.03, then reaching 0.10, 0.24 and 0.37 in the following three periods. (2) The spatial structure of urbanization area in the Yangtze River Delta was fractal. The fractal dimension and stability coefficient of urbanized land structure fluctuated to a certain extent. From 1979 to 2000, the fractal dimension of urbanized land structure decreased yearly. The shape of urbanized land tended to be regular. After 2000, the area increase of urbanized land on a large scale led to more complicated shape of urbanized land. The stability coefficient also had similar characteristics to that of fractal dimension. So the change of urbanized land in spatial structure was relating to the growth process of urbanized land. (3) The growth process of urban agglomeration in the Yangtze River Delta was from one pole and two belts to five poles and five belts. From 1979 to 1990, Shanghai was the only first-grade growth pole of urbanized land and Shanghai-Nanjing railway and Shanghai-Hangzhou railway were the two first-grade growth belts of urbanized land in the Yangtze River Delta. At the latest period (from 2000 to 2005), the first-grade growth poles included 5 cities, i.e., Shanghai, Nanjing, Hangzhou, Suzhou and Ningbo. Besides Shanghai-Nanjing railway and Shanghai-Hangzhou railway, Shanghai-Jingjiang railway, Hangzhou-Ningbo railway and the highway linking Nanjing to Gaochun also became growth belts of urbanized land in the Yangtze River Delta in that period.
[本文引用: 1]
[本文引用: 1]
DOI:10.11820/dlkxjz.2010.08.010URL [本文引用: 1]
Researches on distribution and modelling of urban population density exist vastly in English literatures in the discipline such as urban economics, regional science and urban study. Substantive studies reveal that as urban develops,distribution of urban population density evolves from monocentric to polycentric, and functions which can describe urban population density also vary from simple negative funcitons to modern complicated functions. In recent years, researches on population density function of Chinese cities enriched. Most studies focus on large cities like Beijing and Shanghai. Some conclusions from those studies are consistent with the findings from foreign cities. (1) Monocentric population density functions can describe population density distribution of Chinese cities well. (2) The expontenial denstiy function also fits the population densiy distribution in most chinese cites. (3) The density gradient is getting small and the city-center intercept drops over time. (4) Multi-centric functions can fit the density distribution in some big cities like Beijing and Shanghai. Those findings reveal that population suburbanization of Chinese cities develops rapidly, and the spatial structures of Chinese cities experience great changes from compact to decentralized. Studies on Chinese cities have some shortcomings. Most studies are confronted with poor quality data. There are fewer studies on cities. In the future studies, GIS should be applied to obtain high quality data, and research method should be enriched. Comparable studies or regional studies should also be launched.
[本文引用: 1]
[本文引用: 1]
[本文引用: 1]
[本文引用: 1]
[本文引用: 1]
[本文引用: 1]
DOI:10.1016/j.landurbplan.2018.11.005URL [本文引用: 2]
URL [本文引用: 4]
URL [本文引用: 1]
DOI:10.1016/j.scitotenv.2019.01.039URLPMID:30640106 [本文引用: 1]
Rapid urbanization accelerates urban expansion, especially in populous areas, such as Southeast Asia. The urban forms and changes at the macro level and the dynamics at the patch level are interrelated. Considering its spatiotemporal interdependences and global-local interactions, we propose a framework to quantify urban expansion by combining macro patterns and micro dynamics. Taking three Southeast Asian megacities, Bangkok, Ho Chi Minh City (HCMC), and Manila, as examples, we calculate the urban land densities in concentric rings (macro pattern) and the proximity expansion index (PEI) of new urban patches (micro dynamic) to compare the urban form changes and expansion patterns based on Landsat imagery in 1990, 2000, and 2014. The results show that the urban form changes have close relationships with the local urban patch dynamics. The macro- and micro-level results in Bangkok and Ho Chi Minh City are interrelated and consistent and the explainable inconsistent results in Manila further reveal the necessity of combination of two scopes. The three megacities developed in different manners, thereby resulting in diverse urban forms and changes. Other methods and technologies combining macro and micro perspectives are encouraged to better understand urban expansion.
DOI:10.1016/j.scitotenv.2018.08.015URLPMID:30180335 [本文引用: 1]
Built-up area has become an important indicator for studying urban environments, but mapping built-up area at the regional/global scale remains challenging due to the complexity of impervious surface features. Nighttime light data (NTL) is one of the major remote sensing data sources for regional/global built-up or impervious surface mapping. A single regression relationship between fractional built-up/impervious area and NTL or various indices derived based on NTL and vegetation index (e.g., NDVI) data had been established in many previous studies. However, due to the varying geographical, climatic, and socio-economic characteristics of cities, the same regression relationship may vary significantly across cities. In this study, we examined the regression relationship between percentage of built-up area (pBUA) and vegetation adjusted nighttime light urban index (VANUI) for 120 randomly selected cities around the world with a hierarchical hockey-stick regression model. We found that there is a substantial variability in the slope (0.658?±?0.318), the threshold VANUI (-1.92?±?0.769, log scale) after which the linear relationship holds, and the coefficient of determination R2 (0.71?±?0.14) among globally distributed cities. A small proportion of this substantial variability can be attributed to socio-economic status (e.g., total population, GDP per capita) and landscape structures (e.g., compactness and fragmentation). Due to these variations, our hierarchical model or no-pooling model (i.e., fit each city individually) can significantly improve model prediction accuracy (17% in terms of root mean squared error) over a complete-pooling model. We, however, recommend hierarchical models as they can provide meaningful priors for future modeling under a Bayesian framework, and achieve higher prediction accuracy than no-pooling models when sample size is small.
https://esa.un.org/unpd/wup/Publications/Files/WUP2014-Report.pdf, 2014-07-10/2018-12-04.
URL [本文引用: 2]
[本文引用: 2]
[本文引用: 1]
[本文引用: 1]
[本文引用: 1]
[本文引用: 1]
[本文引用: 1]
[本文引用: 3]
