2.
Spatial distribution of extreme poverty and mechanism of poverty differentiation in rural China based on spatial scan statistics and geographical detector
PAN Jinghu1, FENG Yaya1,21. 2.
收稿日期:2018-05-10修回日期:2019-12-7网络出版日期:2020-04-25
| 基金资助: |
Received:2018-05-10Revised:2019-12-7Online:2020-04-25
| Fund supported: |
作者简介 About authors
潘竟虎(1974-),男,甘肃嘉峪关人,教授,博士生导师,中国地理学会会员(S110011899M),主要从事空间经济分析与遥感研究E-mail:panjh_nwnu@nwnu.edu.cn。

摘要
关键词:
Abstract
Keywords:
PDF (10931KB)元数据多维度评价相关文章导出EndNote|Ris|Bibtex收藏本文
本文引用格式
潘竟虎, 冯娅娅. 中国农村深度贫困的空间扫描与贫困分异机制的地理探测. 地理学报[J], 2020, 75(4): 769-788 doi:10.11821/dlxb202004008
PAN Jinghu.
1 引言
贫困是贯穿整个人类发展历史进程的客观现象,消除贫困是联合国确定的千年发展目标和2015年后发展议程的核心[1]。贫困严重制约了中国的经济社会发展,1949年以来,中国农村扶贫开发大致经历了1978年改革开放前的小规模救济式扶贫、改革开放初期农村体制改革拉动下的制度型缓贫、政府主导下的大规模区域型开发式扶贫、以特殊困难地区为重点的攻坚型扶贫、以全面实现小康为目标的精准扶贫等5个阶段,贫困区域和贫困人口显著减少,扶贫减贫成效显著,中国农村贫困人口已从1978年的7.7亿人减少到2017年末的3046万人,贫困发生率从97.5%下降到3.1%。现阶段,贫困人口主要分布在832个贫困县和12.8万个贫困村,扶贫对象的有效瞄准和识别仍是新时期扶贫需要解决的首要问题。深度贫困地区是贫中之贫、困中之困,也是脱贫攻坚的坚中之坚,受资源禀赋、自然条件、生态环境、交通区位等多种因素的交叉影响,中国农村深度贫困地区的空间孤岛效应、投资递减效应、发展马太效应不断显现[2],贫困地区、贫困的发生面逐步有向中西部收缩的态势,减贫、脱贫难度不断加剧,深度贫困区域与基础设施欠缺、社会服务滞后、生态环境脆弱的地区耦合度高;另一方面,这些地区受自然条件限制且严重依赖农牧业为生的现实,又会诱发地缘性贫困或生态贫困[3]。依据识别尺度的差异,贫困识别一般分为家庭(或个体)识别和地理(空间)识别[4]。所谓地理识别是在不同尺度上以地理单元为基本单位进行的贫困识别,当下中国的贫困面仍然不小,深度贫困人口在空间上愈发集中于生态脆弱区分布,这种状况决定了在未来很长时段内,反贫困措施必须将聚焦于到户、到人的精准扶贫与连片化的区域扶贫相结合[5]。传统研究仅根据经济统计数据对贫困的认定缺少空间视角,难以直观地了解贫困的区域差异、空间特征以及致贫原因的资源环境空间本底分异机制[6]。在国家推行“精准扶贫”的背景下,反思惯常仅仅依据统计方法获取的农民收入等单一经济维度评价贫困的缺陷,从多维度视角评估区域地理环境、生态、资源禀赋等与致贫机制间的相互关联,分析其空间格局差异,对于精确识别深度贫困的空间分布,提高扶贫政策区域瞄准的精度提供科学参考。国外早期的贫困研究多属于经济学和社会学范畴,对贫困的测度一般以贫困线为参照,用单一收入因素来测度区域贫困,忽略了贫困问题的空间性,并衍生出绝对贫困和相对贫困之分。Sen[7]和Pacione[8]认为贫困是综合因素作用,制度限制、权力剥夺、环境脆弱等既是贫困成因也是不同表现类型,随后,相继出现了代际贫困、多维贫困和能力贫困等概念。20世纪90年代以来,地理空间因素逐渐引入到贫困问题研究中,认为某一区域地理资本(经济、社会、政治、生态)在一定程度上的缺少导致了空间贫困陷阱出现[9]。农村贫困区域既可归于多风险源区,也可归于多风险受体区,农村贫困状态多表现为暂时性贫困,存在着较高程度的脱离贫困与滑入贫困并存的困局[10],在区域尺度上,空间资本(区位差异、自然环境、社会服务等)存在非易变性,这是深度贫困区长期困于空间贫困陷阱的主要推手。深度贫困指个体长时间处于要素资源极其短缺或生存环境极度恶劣的顽固性贫困状态,深度贫困的特点主要为[11]:① 贫困时间长,返贫率高,减贫难,代际传递几率大;② 属于绝对贫困,多维贫困,致贫原因复杂多样且相互交织;③ 具有区域性特征。深度贫困农村地区经济增长欠缺动力,交通区位差使得克服地理障碍的成本高,加之地理资本脆弱,生计资本低劣,而农户自身发展能力不足,致使贫困程度深,农户生计往往波动性大,外生性冲击有可能使得这些地区多次面临重返贫困的危机,脱贫和返贫兼具艰难性、繁复性及反复性。因此,从空间上识别和测度深度贫困地区,具有深远的理论意义和实践价值。
自2013年精准扶贫战略被提出后,有关精准扶贫、脱贫政策、扶贫效果的第三方评估、扶贫开发模式等快速变成社会关注焦点和相关学科研究热点。已有研究主要集中于农村贫困化机理、致贫原因、减贫政策与对策等方面[1],且以定性分析居多,有关深度贫困和贫困空间分异机制的研究较少。已有空间贫困研究案例在方法上多采用夜间灯光遥感[12]、可持续生计综合评价[13]、空间自相关和地理加权回归[14]、人工神经网络[6, 9, 15]、地理探测器[2, 16]、最小方差模型[17]等,鲜见多空间手段综合运用。研究尺度和对象上,多以县域内或集中连片特困区内的乡镇、村为主,全国范围内的多尺度比较研究甚少。精准扶贫背景下农户将会成为脱贫瞄准的最小生计单位,但因为不同空间尺度存在相互关联、嵌套、反馈关系,微观尺度上的个人或家庭贫困往往受制于中、宏观尺度上经济状况,更容易受到空间地理环境的影响。
基于以上分析,本文以空间贫困理论为指导,选取自然致贫因子和社会经济消贫因子,构建评价指标体系,借助BP人工神经网络分别模拟了省域、市域和县域3个尺度下的自然致贫指数和社会经济消贫指数,计算获得了贫困压力指数,借助Flexible空间扫描探测识别出深度贫困县,在此基础上,运用地理探测器揭示深度贫困县的主导致贫因素,并提出差别化的减贫建议,以期丰富区域空间贫困研究的技术方法,为精准识别深度贫困提供科学参考。
2 数据与研究方法
2.1 空间贫困测度指标体系
在参考相关文献[15, 18]并充分考虑贫困地区实际状况的基础上,本文以空间贫困理论和人地关系系统理论为指导,结合全面脱贫攻坚验收中的核心监测指标[19],依据贫困与地理环境、资源生态、社会经济等多因素间的相互影响、相互作用机理,遵循空间贫困识别的多维度、综合性、公平性,研究对象的针对性、政策相关性以及数据的可获取性等原则,建立了多维贫困测度指标体系,从经济发展、社会发展和生态环境3方面系统反映识别对象的贫困表象(硬现状)、生计能力(软现状)和可持续发展能力(潜在状态)。为减少多重共线性的影响,剔除了方差膨胀因子VIF > 10的指标,提高了指标的相关性和区分度。空间贫困测度指标体系由2个一级指标、17个二级指标构成(表1)。Tab. 1
表1
表1农村空间贫困测度指标体系
Tab. 1
| 一级指标 | 二级指标 | 单位 | 数据类型 |
|---|---|---|---|
| 自然环境 | 高程(X1) | m | 空间栅格 |
| 平均坡度(X2) | ° | 空间栅格 | |
| 地形破碎度(X3) | - | 空间栅格 | |
| 集水指数(X4) | - | 观测数据 | |
| 植被湿度指数(X5) | - | 遥感数据 | |
| 生物丰度指数(X6) | - | 矢量数据 | |
| 归一化植被指数(X7) | - | 遥感数据 | |
| 距最近地级市距离(X8) | km | 矢量数据 | |
| 社会经济 | 人口密度(X9) | 人/km2 | 统计数据 |
| 平均夜间灯光强度(X10) | - | 遥感数据 | |
| 人均公共财政收入(X11) | 元/人 | 统计数据 | |
| 人均居民储蓄存款余额(X12) | 元/人 | 统计数据 | |
| 人均固定资产投资(X13) | 元/人 | 统计数据 | |
| 每万人在校学生数(X14) | 人 | 统计数据 | |
| 每万人医疗卫生机构床位数(X15) | 张 | 统计数据 | |
| 每万人社会福利收养性单位床位数(X16) | 张 | 统计数据 | |
| 农村居民人均可支配收入(X17) | 元/人 | 统计数据 |
新窗口打开|下载CSV
部分空间指标的计算解释为:① 考虑到每个行政区有多个高程点且行政区内部地形起伏差异较大,若用均值会造成较大的误差,则采用每个行政区栅格高程的众数来代表其海拔高度。② 地形破碎度用每个行政区高程点的标准差代表。③ 集水指数计算式为[20]:
式中:AW为集水指数;AP为年降水量;CTI为合成地形指数,是上游汇流面积(FA)和景观坡度(s)的函数,计算式为[21]:
④ 全局植被湿度指数(Global Vegetation Moisture Index, GVMI)计算式为[22]:
式中:NIR和SWIR分别为MODIS数据产品MOD09A1的近红外波段和短红外波段的反射率。MOD09A1数据产品的空间分辨率为500 m,时间分辨率为8 d合成。将500 m空间分辨率重采样为1 km,根据公式(3)得到相应8 d的GVMI,再采用最大值合成法(MVC)得到月的GVMI,最后求得年平均值。
⑤ 生物丰度指数(Biological Richness Index, BRI))表示单位面积上不同生态系统类型在生物物种数量上的差异,计算式为[23]:
式中:FL为林地面积;GL为草地面积;WL为水域和湿地面积;CL为耕地面积;BL为建设用地面积;UL为未利用地面积;TA为区域总面积。
2.2 研究方法
2.2.1 人工神经网络 本文采用人工神经网络方法的目的是借助神经网络的自学习功能,自动模拟行政单元上区域自然致贫状况和社会经济消贫状况。因为同时受自然和社会经济因素的双重影响,空间贫困往往会表现出空间异质性,过程的非线性,以及结果的不确定性等性质,因此无法凭借简易的线性模型模拟和分析其逻辑关系。在各种神经网络中,BP(Back Propagation)神经网络的应用最为普遍。BP神经网络采用误差反向传播算法构建多层前馈网络,其结构简单、训练算法多样。BP神经网络的结构包括输入层、隐含层和输出层等,输入和输出变量的维数决定了输入层节点个数ni和输出层节点个数n0,隐含层节点个数n的确定目前尚没有统一的标准,需要根据具体个案研究经反复实验得到。本文中,BP神经网络的输入层是自然、社会和经济各个因子,输出层分别是自然致贫指数和社会经济消贫指数;n须通过多次试验来获得,计算式为:式中:a为1~10之间的常数。传统BP算法(例如traingdx)的收敛速度慢,而且常常出现局部极小值,而L-M优化算法(Levenberg-Marquardt)利用误差的导数替换传统BP算法中均方误差的导数,采用批处理来训练数据,极大地提升了收敛速度,因此本文采用L-M优化算法的trainlm函数训练神经网络。
利用BP神经网络分别对自然致贫因素、社会经济消贫因素进行模拟,获得各行政单元的自然致贫指数(Natural Impoverishing Index, NII)和社会经济消贫指数(Social and Economic Poverty Alleviation Index, SII)。其中,将各自然致贫因素和社会经济消贫因素作为BP神经网络的输入层,将NII、SII作为BP神经网络的输出层,设置好需要的参数,在BP神经网络中通过持续学习获得权值,并反复修改,挖掘出每个因素与NII和SII之间的非线性关系。篇幅所限,以县级单元自然致贫指数模拟为例,构建8×6×1的神经网络拓扑结构,输入层、隐含层和输出层的节点个数分别为8、6、1。输出层的神经元选择purelin型传递函数,以trainlm函数训练神经网络。将学习速率设定为0.01,网络最大训练次数设定为10000,训练误差预设为0.001。依据上述网络参数和收敛准则,将各县待分析的样本数据输入训练好的网络,迭代21次后满足了预设的精度,最终误差0.17%,说明BP神经网络模拟的效果较好,据此得到各县的自然致贫指数。以上操作均在Matlab R2012b软件中实现,具体过程详见参考文献[6]。
2.2.2 空间扫描计量方法 本文采用空间扫描计量方法的目的是探测出贫困发生风险较高的贫困县,进一步识别确定出未来须重点关注的深度贫困县。空间扫描统计的关键在于探测省域、市域、县域3个尺度上贫困发生的异常情况,即探测贫困压力指数是否存在具有统计学意义的聚集性及其精确的位置和贫困发生风险的大小。常用的空间扫描统计有SaTScan和Flexible两种方法,前者是用动态的圆形或椭圆形扫描窗口对贫困发生风险的大小进行分析,扫描窗口的大小和位置都是动态变化的,可以避免人为选择造成的主观性影响;后者主要用动态的不规则扫描窗口对贫困发生风险的大小进行分析。基于各级行政区单元边界的不规则性,本文采用Flexible法。根据Poisson分布计算其理论贫困压力指数,然后用实际贫困压力指数和理论贫困压力指数构建对数似然比检验统计量(Log Likelihood Ratio Test Statistic, LLR),最后选择LLR最大的扫描窗口作为高贫困聚集窗口,确定该窗口所包括的省、市、县,分别计算相应研究区的相对风险度,并运用蒙特卡罗法(Monte Carlo Method)计算LLR的p值,确定其有无统计学意义。
假设空间扫描统计量
式中:L(Z)是扫描窗口
Poisson模型的似然比为:
式中:n(Z)为扫描窗口Z中的实际贫困压力指数;u(Z)为根据零假设得到的扫描窗口Z中贫困压力指数理想值;N是研究区贫困压力指数;u(G)为根据零假设得到的研究区贫困压力指数理想值,且有u(G) = N。
2.2.3 地理探测器 本文采用地理探测器的目的是诊断出深度贫困县的主导致贫因素,利用地理探测器识别贫困发生风险的空间分异,并借助q值来测度某指标对贫困发生风险空间分异的解释程度[25],计算式为[26]:
式中:h为贫困发生风险各指标的分层(Strata),即分类或分区;Nh和N分别为层h和全区的单元数;
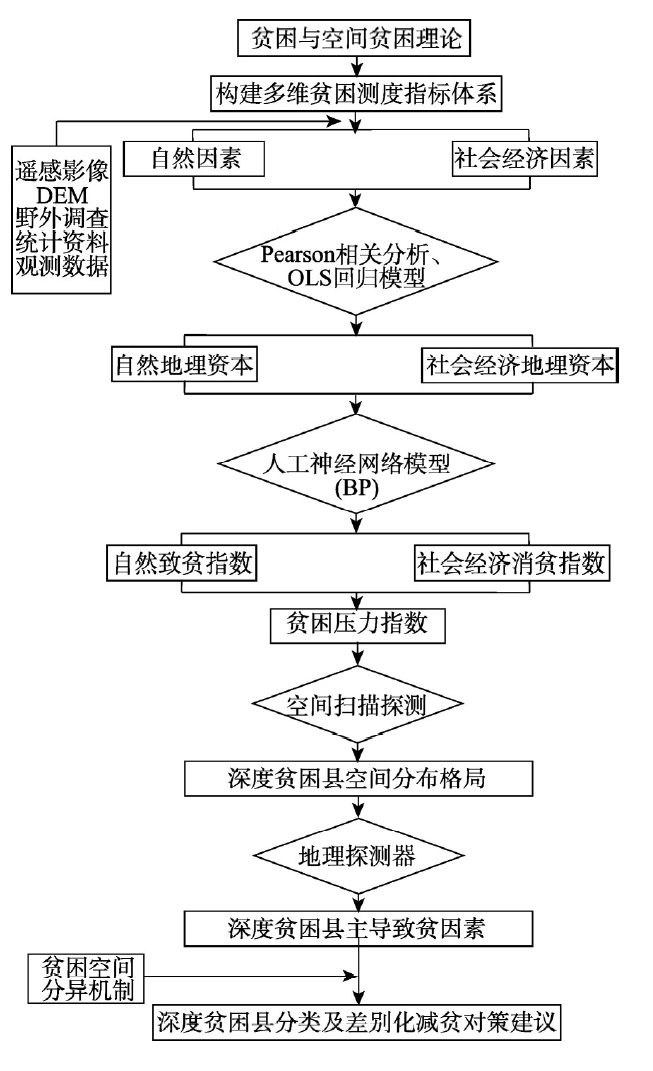
本文的技术流程如图1所示。
图1
 新窗口打开|下载原图ZIP|生成PPT
图1技术路线图
Fig. 1Analysis work flow
2.3 数据来源与处理
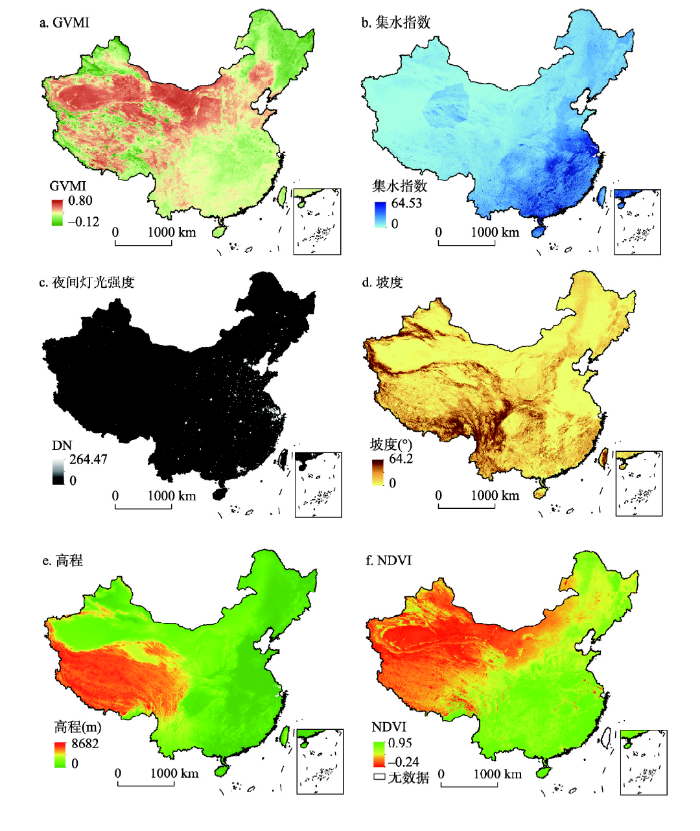
2.3.1 数据来源 行政边界矢量图来自于国家基础地理信息中心1∶400万数据库。为便于分析,将地级及以上城市的市辖区视为一个评价单元,即将该市所有市辖区合并为一个“市区”,据此,全国共有2389个县级评价单元。台湾、香港和澳门因数据获取困难,不列入评价单元。数字高程模型(DEM)获取自美国地质调查局(USGS)网站(2.3.2 地理资本的确定 自然地理资本利用ArcGIS 10.2软件将高程、地形破碎度、平均坡度、集水指数、归一化植被指数、植被湿度指数、夜间灯光数据等空间数据与行政边界矢量数据叠加,通过区域统计功能,提取各县的值,其空间分布如图2所示。社会经济地理资本通过整理统计年鉴数据,计算得到各县区的人均地理资本值。
图2
 新窗口打开|下载原图ZIP|生成PPT
图2中国部分栅格化指标的空间分布
Fig. 2Spatial distribution of rasterized index in China
2.3.3 区域贫困空间影响因素的相关性分析 人均GDP被认为是表征社会经济发展水平的最佳指标之一,因此本文釆用Pearson相关分析,既可以了解区域贫困程度的主要影响因素,判断各个指标与人均GDP之间的相关关系,从而甄别各因子属于致贫因素或者消贫因素,以及各指标对贫困程度的影响性质,又能保证BP神经网络训练和结果模拟的准确性。通过县级单元为例,根据人均GDP高低对县域排序,等间隔对样本抽样,得到两百个样本用于分析,降低了数据量。表2显示了Pearson相关分析结果,反映了各指标对县域空间贫困的影响性,若相关系数为负,则该指标为致贫因素,反之,则为消贫因素。由表2可知,各指标对空间贫困的影响都很显著,植被湿度指数在0.05水平上显著相关,其他因素均在0.01水平上显著相关。
Tab. 2
表2
表2Pearson相关分析结果
Tab. 2
| 指标 | X1 | X2 | X3 | X4 | X5 | X6 | X7 | X8 | |
|---|---|---|---|---|---|---|---|---|---|
| 相关系数 | -0.182 | -0.254 | -0.178 | 0.177 | -0.046 | -0.149 | -0.177 | -0.122 | |
| 显著水平 | 0.000 | 0.000 | 0.000 | 0.000 | 0.025 | 0.000 | 0.000 | 0.000 | |
| 指标 | X9 | X10 | X11 | X12 | X13 | X14 | X15 | X16 | X17 |
| 相关系数 | 0.248 | 0.440 | 0.792 | 0.642 | 0.702 | 0.122 | 0.270 | 0.206 | 0.552 |
| 显著水平 | 0.000 | 0.000 | 0.000 | 0.000 | 0.000 | 0.000 | 0.000 | 0.000 | 0.000 |
新窗口打开|下载CSV
自然因素中归一化植被指数、地形破碎度、平均坡度、高程、植被湿度指数、生物丰度指数、距最近地级市距离与人均GDP之间表现出显著的负相关性而社会经济因素全部与人均GDP存在为正相关性。以上结果说明本文选取的多维度贫困测度指标是合理的、合适的。复杂的地形、脆弱的生态、恶劣的气候等自然因素一般来说都是致贫因素,而发达的经济、较高的收入水平、良好的基础设施、优越的教育医疗条件等社会经济因素则多是消贫或减贫因子。需要说明的是虽然集水指数的相关系数为正值,似乎应该归为消贫因素,但考虑到干旱区面积占中国国土面积1/3的实际,许多土地因缺水而贫瘠,且该指标与人均GDP的相关性并不高(0.177),参考其他****相关研究[20]并综合权衡后,本文将集水指数确定为致贫因素。
3 结果与分析
3.1 贫困空间模拟分析
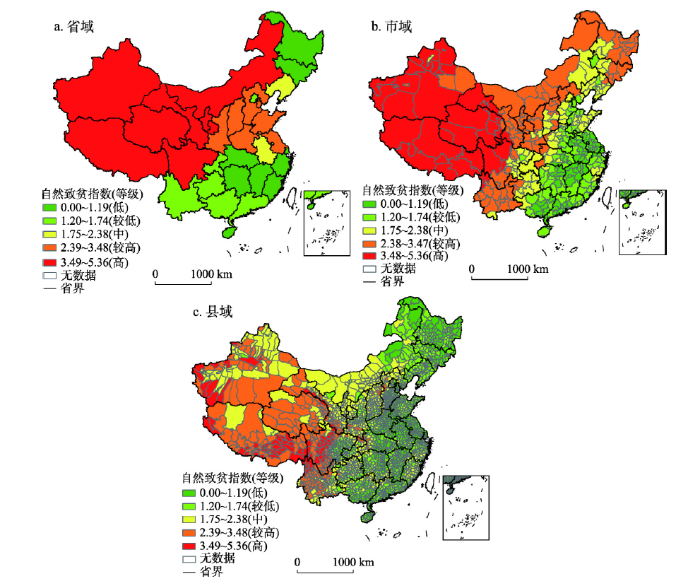
3.1.1 不同行政区尺度下自然致贫指数、社会经济消贫指数和贫困压力指数的空间差异 图3为省域、市域、县域3个尺度下自然致贫指数NII的空间分布格局图(自然断裂法分级,下同)。从图3可以看出,全国范围内省域NII分为迥然不同的东、西两部分,NII较低和低(0 ≤ NII ≤ 1.74)的省(市、区)有14个,NII较高和高(2.39 ≤ NII ≤ 5.36)的省(市、区)亦有14个。市域NII分为东中西三部分,其分布基本上与中国地势的三大阶梯吻合,NII较低和低的市域有143个,全部位于中国地势的第三阶梯上;NII较高和高的市域有118个,几乎全部位于地势的第一、二级阶梯上。NII较低(1.20 ≤ NII ≤ 1.74)的县域有768个,NII低(0 ≤ NII ≤ 1.19)的县域有714个;NII较高(2.39 ≤ NII ≤ 3.48)和高(3.49 ≤ NII ≤ 5.36)的县域分别有250个和85个。图3
 新窗口打开|下载原图ZIP|生成PPT
图3不同行政区尺度下中国自然致贫指数的空间分布
Fig. 3Spatial distribution of natural impoverishing index at different administrative scales
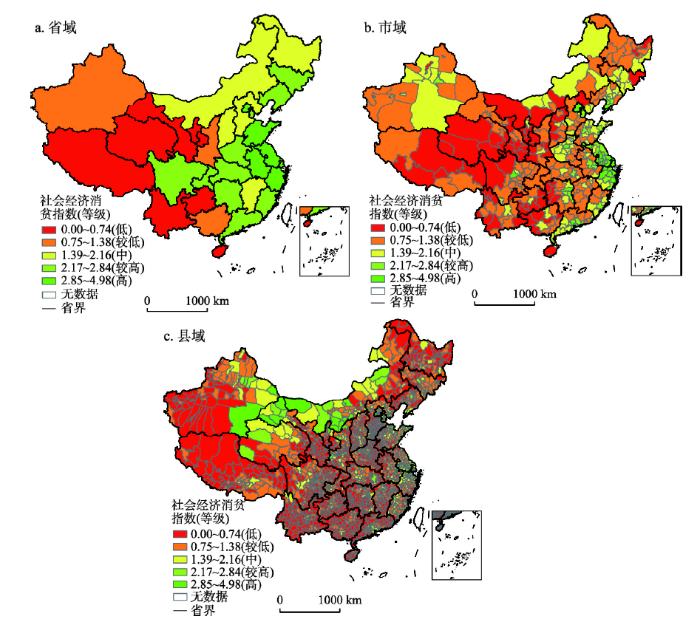
图4为省域、市域、县域3个尺度下社会经济消贫指数SEPAI的空间分布格局图。SEPAI高(2.85 ≤ SEPAI ≤ 4.98)的省区有6个,较高(2.17 ≤ SEPAI ≤ 2.84)的省区有10个,SEPAI较低(0.75 ≤ SEPAI ≤ 1.38)的省有3个,低(0 ≤ SEPAI ≤ 0.74)的省有7个。SEPAI高和较高的地级市分别仅有27个和24个,主要分布在东部沿海地区;SEPAI低和较低的地级市分别多达66个和135个,大多数分布在中西部。相较于NII在县域空间上的规则分布,SEPAI在空间上更加破碎和零乱,缺少规律。SEPAI高的县仅有97个,集中分布在长三角、珠三角、京津冀、长株潭等地;SEPAI较高的县有111个,空间上主要分布在SEPAI高等级县域的外围,集中区域增加了山东半岛、辽东半岛、呼包鄂榆等;SEPAI低的县多达1098个,在空间上近似呈倒“川”字形分布;SEPAI较低的县有786个,与倒“川”字的三竖相间分布。
图4
 新窗口打开|下载原图ZIP|生成PPT
图42015年不同行政区尺度下中国社会经济消贫指数的空间分布
Fig. 4Spatial distribution of social economic poverty alleviation index at different administrative scales in 2015
根据自然致贫指数和社会经济消贫指数确定研究区的贫困压力指数PPI,表达式为:
社会经济因素能够消除或者缓解区域贫困,然而其能在多大程度上消除或者缓解贫困,目前没有统一的说法,并且研究区域不同,其社会经济发展水平也存在着很大的差异,社会经济因素对贫困的缓解程度也不尽相同。本文在借鉴已有****研究[15, 17-18]的基础上,综合权衡,选取0.2作为社会经济消贫系数,即20%的SEPAI用于抵消或者减少当地的贫困。
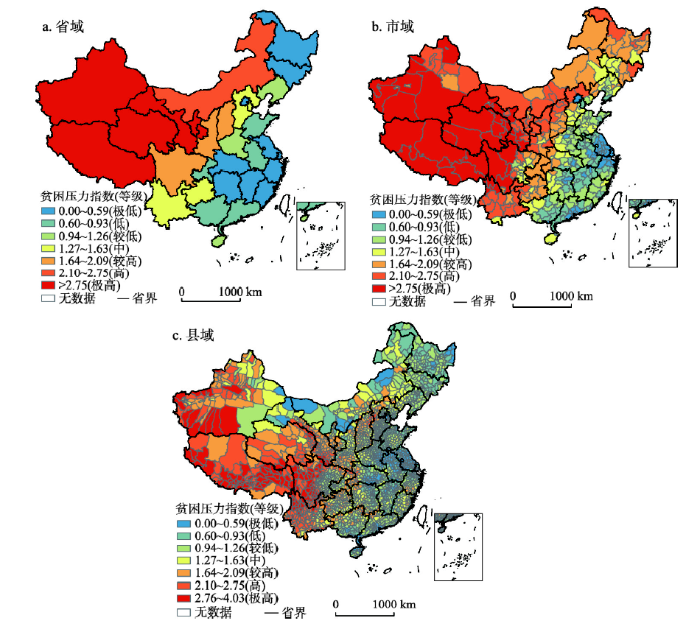
图5为省域、市域、县域3个尺度下贫困压力指数PPI的空间分布格局图。PPI极低(0 ≤ PPI ≤ 0.59)的省域有10个;PPI低(0.60 ≤ PPI ≤ 0.93)的省域有5个;PPI极高(PPI>2.75)的省域有5个,分别为青海(4.39)、甘肃(3.70)、宁夏(3.64)、西藏(3.47)和新疆(3.26);PPI高(2.10 ≤ PPI ≤ 2.75)的省域只有内蒙古(2.12)一个。PPI极低的地级市有39个,集中分布在长三角、珠三角等东部地区,以及武汉、郑州、长沙、南昌等中部省会城市;PPI低的地级市有52个,亦主要分布在中东部地区;PPI极高和高的地级市分别有37个和51个,集中分布在西北和西南地区。县域PPI以黑河—百色一线为界,分为迥然不同的东西两部分,总体来看,PPI呈现“大分散、小聚集”的空间分布格局,东中西差异显著。PPI极低的县区有301个,PPI低的县区有462个,这两个区域构成了“富裕俱乐部”;PPI极高、高和较高的县区则分别有131个、191个和333个,这些区域属于典型的“贫困俱乐部”成员。
图5
 新窗口打开|下载原图ZIP|生成PPT
图52015年不同行政区尺度下中国贫困压力指数的空间分布
Fig. 5Spatial distribution of poverty pressure index at different administrative scales in 2015
统计显示,14个连片特困区680个贫困区县的平均PPI为1.97,高于全国所有2389个区县的平均PPI(1.33)。14个连片特困区中,西藏地区的PPI最高(2.89),其次为四省藏区(2.57)和滇西边境山区(2.5)。分省区来看,西藏各县域的PPI平均值最高,为2.89,其次是青海(2.27)和云南(2.23)。从各省区PPI的变异系数来看,上海市的变异系数最大,为0.63,其次是天津(0.61)和海南(0.58),西藏和山西的变异系数最小,仅为0.16。
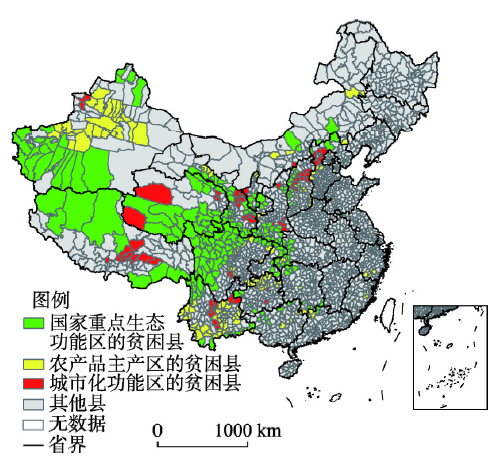
3.1.2 贫困县与主体功能区规划的叠置 本文将贫困压力指数处于极高、高和较高等级(PPI ≥ 1.64)的县区认定为贫困县,共计655个。将本文识别的贫困县与国家主体功能规划区相叠置,得到落在各个国家主体功能区的贫困县的数量和空间分布(图6)。从图6可以看出,国家重点生态功能区中的贫困县数量最多,共有230个,分布在黄土高原—川滇生态屏障、青藏高原生态屏障、祁连山—河西走廊内陆河流域生态屏障、秦巴山区生态屏障、北方防沙带和南方丘陵地带。这些地区以山地丘陵为主,是江河流域的主要分水岭和重要源地,在国家生态安全战略格局中占据着非常重要的作用。但是由于其距主流、干流和下游低平地以及社会经济较发达的区县较远,县区内外的物质输送与能量交换十分匮乏,资源承载力和生态系统服务缺少“挖潜”的空间,并且这些区县基础设施配套相对滞后,先进技术很难企及,资源利用效率低下,区域系统发展严重依赖于资源环境本底状况[27]。农产品主产区中的贫困县有183个,主要分布在新疆中部、甘肃张掖、四川盆地周边、云南南部、湘粤桂交界、苏闽交界和山西东部。相较于社会经济发展较先进的区县,此类区县往往人口增加迅猛,但人口的综合素质普遍不高,缺少外出谋生的一技之长,致使农村人口被束缚在本就负重累累的土地上,一代代地从事着粗放式的低效农业生产活动,不得不陷入“人口增长—贫困加剧—生态退化”的恶性轮回中。城市化功能区中的贫困县也有173个,主要分布在天山北坡、藏中南、滇中、黔中、成渝、关中—天水、兰州—西宁、京津冀、冀中和晋中等城市群地区。这些地区两极分化严重,大城市周边的贫困地区与核心区近在咫尺,但由于种种原因往往很难受到大城市的辐射,反而成为了都市“阴影区”。
图6
 新窗口打开|下载原图ZIP|生成PPT
图62015年贫困县在国家主体功能区的空间分布
Fig. 6Spatial distribution of poverty-stricken counties in national main function-oriented zones in 2015
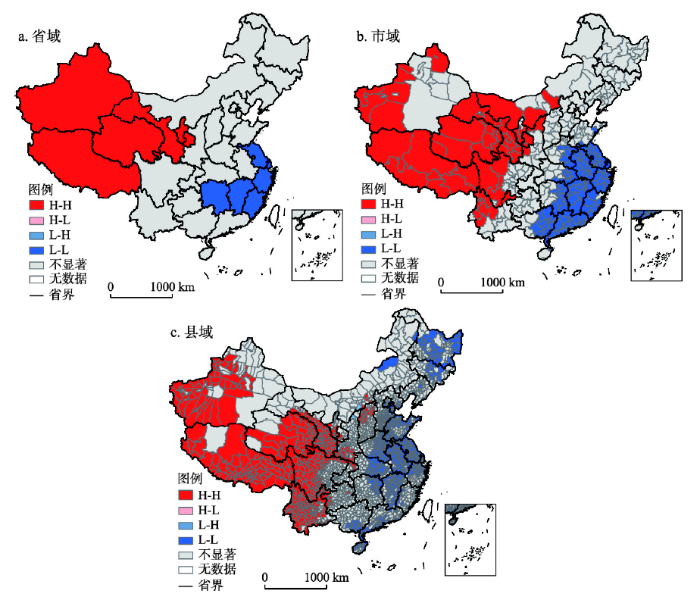
3.1.3 区域贫困空间依赖性格局 利用Rook标准构建了相应的空间权重矩阵[28],在GeoDA软件支持下计算得到中国省域、市域、县域3个尺度下贫困压力指数的全局Moran's I值分别为0.32、0.55和0.52,均通过了1%的显著性检验,说明3个尺度下PPI在空间上具有较高的集聚效应。贫困压力指数较高的省,其周边行政区的贫困压力指数值也比较高,反之亦然。根据各行政区与其周围相邻行政区的空间关系,在1%的显著性水平下,把全国各行政区划分为4种类型(图7):高—高(H-H)、低—低(L-L)、低—高(L-H)、高—低(H-L)。由图7可知,H-H集聚的省区有5个,分别为新疆、西藏、青海、甘肃、宁夏;L-L集聚的省市有6个,分别为上海、江苏、浙江、福建、江西和湖南;H-H集聚的地级市有55个,主要分布在阿勒泰、南疆三地州、西藏、青海、甘肃、宁夏、云南北部、四川西部、内蒙西部等;L-L集聚的地级市有116个,集中分布在东南、华南沿海地区。县域H-H型连片大面积分布在西北和西南地区,L-L型县区数目约占总数的20.3%,空间上聚为3片:以北京、上海、赣南、武汉为顶点的中东部菱形片区,东北片区和华南沿海片区;L-H型的县区嵌入H-H型分布,填空补实,主要有鄂尔多斯、榆林、宝鸡、咸阳、西宁、乐山、雅安和昆明等;H-L类型的县区则多分布在L-L型的周围,且数量较少,包括晋城市的陵川、丽水市的遂昌、宜春市的静安和郴州市的桂东等。
图7
 新窗口打开|下载原图ZIP|生成PPT
图72015年不同行政区尺度下中国贫困压力指数的局部空间自相关分布
Fig. 7Local spatial auto-correlation of poverty pressure index at different administrative scales in 2015
3.2 贫困发生聚集性及风险识别
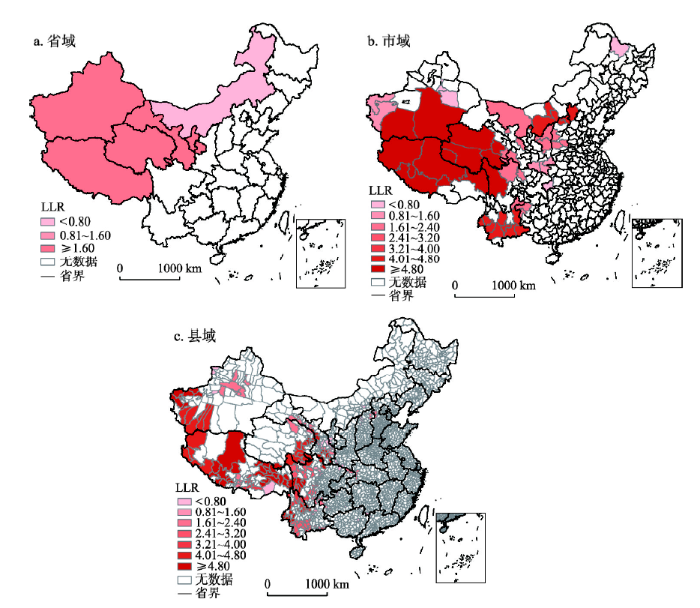
利用Flexible空间扫描计量方法,分别对3个尺度下识别出的贫困区进行扫描,进一步得到减贫难度较大的深度贫困区域。由于各级行政单元的边界往往不规则,根据识别出的贫困地区实际分布,利用泊松分布计算每个扫描窗口内PPI的理论值,继而根据贫困压力指数的实际值与理论值,建立检验统计量的对数似然度LLR(Log Likelihood Rate),通过LLR反映扫描窗口内PPI的异常程度。LLR值越大,说明分析窗口内的PPI异常程度越高。一般将LLR最大的窗口认定为PPI异常程度最高的窗口,然后评价该窗口的统计显著性水平。考虑到扫描统计量的概率分布非常复杂,本文采用Kulldorff等[29]提出的蒙特卡罗法计算检验统计量的p值。此外扫描统计量还可以分析和判断其他LLR较大窗口是否具有统计学意义,以便最大化地查找存在异常值的区域。为避免扫描得到的贫困风险集群规模过大,并提高扫描效率,本文选择LLR with Restriction统计类型,并将α值设定为默认值0.2,贫困风险集群的扫描结果由ArcGIS 10.2软件可视化展示。构建省域、市域、县域3个尺度下的检验统计量对数似然比LLR,空间扫描结果如图8所示。省级尺度上共得到3个达到统计显著性水平的贫困压力指数风险集群(图8a),最大值2.81,最小值0.25,均值2.16,标准差0.88。各集群贫困压力指数风险分别是:集群1为2.36,分别为西藏、新疆和青海;集群2为0.25,只包括内蒙古;集群3为2.81,包括甘肃和宁夏两个省区。这3个集群所包含的六个省区发生贫困的风险较高,甘肃和宁夏两个省区发生贫困的风险最大,扶贫工作中应该重点关注;新疆、西藏和青海发生贫困的风险次之,内蒙古最小。市域尺度上,有12个达到统计显著性水平的贫困压力指数风险集群(图8b),最大值8.28,最小值0.04,均值3.99,标准差2.66。各集群贫困压力指数风险分别是:集群1为8.28,包括巴音郭楞州、和田地区、拉萨市、阿里地区、那曲市、日喀则市、昌都市、果洛州、海南州、海西州、玉树州和甘孜州共12个地级行政区,具有最高的贫困风险;集群2为4.35,全部分布在云南省,包括保山、楚雄、德宏等9个市州,贫困风险次之;集群3为2.21,包括阿坝州、黄南州、甘南州和绵阳市;集群4为2.28,分布在陕西北部和山西交界地带,包括长治、临汾、吕梁、铜川、延安和榆林共6个地级市;集群5为0.27,仅包括乌鲁木齐和吐鲁番市;集群6为4.55,包括包头、鄂尔多斯、呼和浩特、大同、朔州、石嘴山和张家口共7个地级市;集群7为0.90,包括安康、汉中和商洛3个地级市;集群8为0.04,只有恩施州;集群9为1.53,包括喀什地区和克孜勒苏州;集群10为0.19,只有黑河市;集群11为1.97,包括毕节、六盘水和昭通市;集群12为2.12,包括阿拉善盟、白银市和金昌市。这12个集群所包含的53个地级市和地区具有较高的贫困发生风险。县级尺度上,共得到44个达到统计显著性水平的县域贫困压力指数风险集群(图8c),最大值5.77,最小值0.00,均值3.21,标准差1.75。44个集群共涉及243个县区,主要位于新疆、西藏、青海、甘肃、四川和云南等省区。
图8
 新窗口打开|下载原图ZIP|生成PPT
图82015年不同行政区尺度下中国贫困高风险集群空间分布
Fig. 8Spatial distribution of high-risk poverty clusters at different administrative scales in 2015
根据国务院扶贫开发领导小组在其官方网站发布的名单,全国共确定了592个国家扶贫工作重点县,其中深度贫困县有334个(
图9
 新窗口打开|下载原图ZIP|生成PPT
图92015年中国深度贫困县空间分布
Fig. 9Spatial distribution of severely impoverished counties in 2015
深度贫困县多出现在省域交界地带,诸如新藏、川藏、川黔桂、青甘川、川陕鄂渝、陕甘宁、晋冀蒙等省域交界处。区域经济发展的重心是省会或区域中心城市,其辐射往往以核心—边缘模式向外扩展,而省际交界地带易被遗忘、边缘化,成为政策“盲区”,这些地方本就地理位置偏远,自然条件恶劣,加之行政壁垒化和行政边缘化的限制,与省内发达地区的差距逐渐拉大,退化为贫困集中连片发展、脱贫难度大的深度贫困地区。
从片区来看,深度贫困县个数最多的片区是西藏地区,多达43个,占深度贫困县总数的20.7%;其次为四省藏区(37)、滇西边境山区(34)、六盘山区(26)、乌蒙山区(15)和秦巴山区(12);大兴安岭南麓山区、大别山区和罗霄山区没有深度贫困县。南疆三地州虽然不是深度贫困县个数最多的片区,但却是贫困风险最大的片区,风险平均值高达4.93。贫困风险较大的片区还包括西藏地区(4.50)、四省藏区(3.99)和滇西边境山区(3.82)。分省来看,深度贫困县个数最多的省为云南,有45个,占深度贫困县总个数的21.6%;其次为西藏(43)、四川(30)和甘肃(27)。新疆的贫困风险最大,为4.94,风险较大的省还有青海(4.59)、西藏(4.50)、云南(3.42)、甘肃(3.23)和四川(3.22)。
3.3 深度贫困县贫困空间差异形成机制的地理探测
3.3.1 区域贫困空间差异性的主导因素 区域贫困受多种因素的综合影响,本文综合考虑自然环境、社会和经济3方面的因素,运用Pearson相关分析和普通最小二乘回归分析得到由17个子指标组成的指标体系。分别为人口密度、平均夜间灯光、人均公共财政收入、人均居民储蓄存款余额、人均固定资产投资、每万人在校学生数、每万人医疗卫生机构床位数、每万人社会福利收养性单位床位数、农村居民人均可支配收入、高程、平均坡度、地形破碎度、集水指数、植被湿度指数、生物丰度指数、归一化植被指数、距最近地级市距离。根据贫困压力指数的较高、高和极高的等级划分,将选取的17个影响因子值分别分为3级:较贫困、贫困和极贫困,以此为阈值进行探测分析。将上述因子值和贫困压力指数导入地理探测器模型中,求得各因子对PPI的影响力值(q值,其值越大意味着该因子对PPI的影响也越大,反之亦然)和因子解释力值(p值,其值越小意味着该因子对PPI影响的解释能力越大,反之亦然)[30],选取p值小于0.1的因子[31],共11个(表3)。Tab. 3
表3
表3深度贫困县17个影响因子的地理探测结果
Tab. 3
| 影响因子 | q值 | p值 | 排序 |
|---|---|---|---|
| 平均坡度 | 0.3508 | 0.0000 | 1 |
| 平均高程 | 0.2970 | 0.0000 | 2 |
| 地形破碎度 | 0.2285 | 0.0000 | 3 |
| 距最近地级市距离 | 0.1950 | 0.0000 | 4 |
| 人均居民储蓄存款余额 | 0.1639 | 0.0000 | 5 |
| 农民人均可支配收入 | 0.1629 | 0.0000 | 6 |
| NDVI | 0.1575 | 0.0000 | 7 |
| 集水指数 | 0.0762 | 0.0351 | 8 |
| 人口密度 | 0.0656 | 0.0746 | 9 |
| 每万人在校学生数 | 0.0629 | 0.0183 | 10 |
| 夜间灯光平均强度 | 0.0435 | 0.0979 | 11 |
新窗口打开|下载CSV
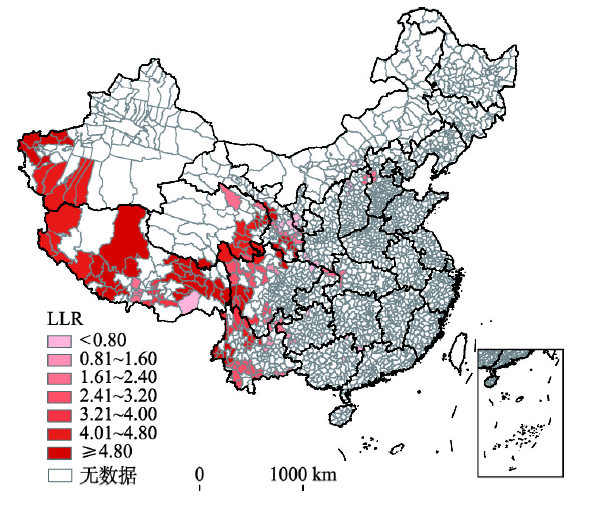
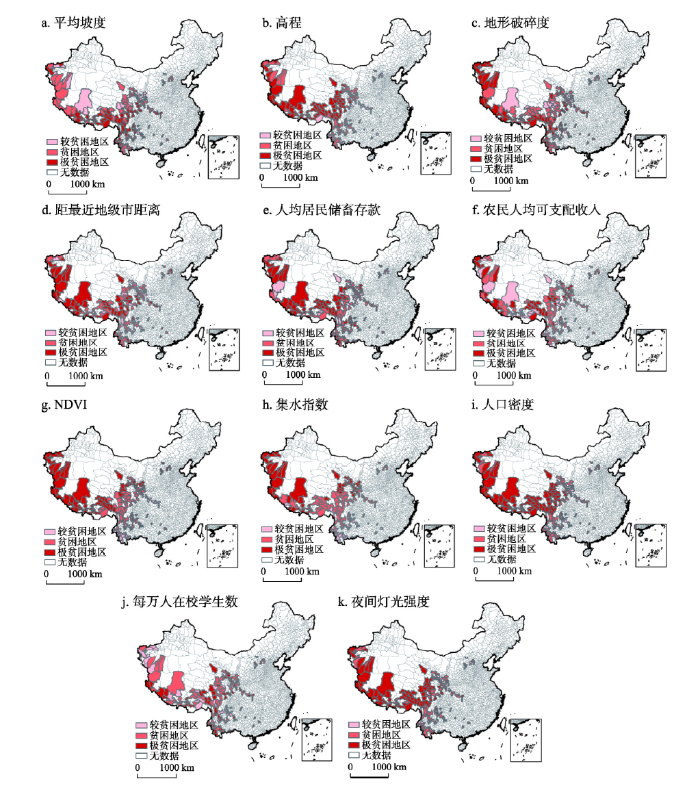
分析结果显示,对贫困压力指数影响较大的因子(q > 0.04且p < 0.1的因子)依次是:平均坡度(0.35)>平均高程(0.30)>地形破碎度(0.23)>距最近地级市距离(0.20)>人均居民储蓄存款余额(0.16)>农村居民人均可支配收入(0.16)>归一化植被指数(0.16)>集水指数(0.08)>人口密度(0.07)>每万人在校学生数(0.06)>夜间灯光平均强度(0.04),其余因子影响较弱。图10为上述11个因子的空间可视化分布图。将上述11个因子中对贫困压力指数影响较小(q < 0.1)的因子剔除,得到7个因子作为深度贫困县的主导致贫因素,分别为:平均坡度、高程、地形破碎度、距最近地级市距离、人均居民储蓄存款余额、农民人均可支配收入和归一化差值植被指数。
图10
 新窗口打开|下载原图ZIP|生成PPT
图102015年中国深度贫困县影响因子的空间分布
Fig. 10Spatial distribution of impact factors for severely impoverished counties of China in 2015
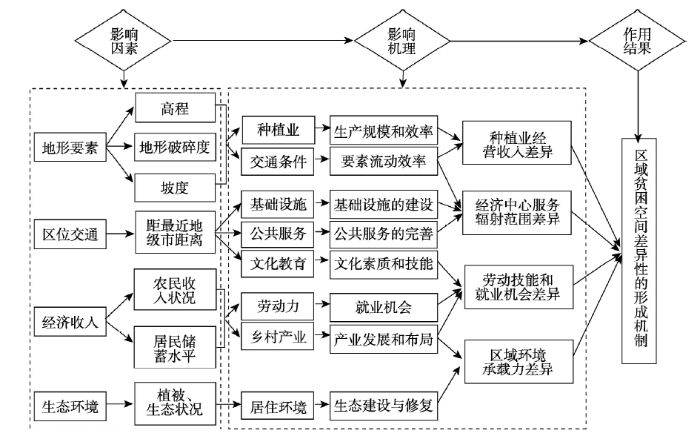
3.3.2 深度贫困县分类及差别化减贫政策启示 通过综合诊断得出影响深度贫困县空间分异的主导因素,进一步分析各主导因素对区域贫困空间差异的作用机制,为实现因地制宜、科学扶贫、精准脱贫实施政策提供参考依据。区域深度贫困空间差异性的形成机制如图11所示。依据上述结果,进一步将深度贫困县按照致贫主导因素分为4类[2]:
图11
 新窗口打开|下载原图ZIP|生成PPT
图11区域贫困空间差异性的形成机制
Fig. 11Regional poverty differentiation mechanism
(1)地形要素制约型。坡度、高程和地形破碎度是影响农业生产结构与方式的重要条件,也是交通道路等设施修建和社会经济发展的重要自然条件。从图10a、10b、10c可以看出,这3个因素对南疆三地州、日喀则市、林芝市、那曲市、山南市、昌都市、拉萨市、甘孜州、阿坝州所辖深度贫困县影响较大。该类贫困区一方面可因地制宜发展适度规模的标准化养殖业,探索适合当地发展的农牧结合、粮草兼顾、生态循环的种养模式。另一方面,应当立足资源禀赋,独特的土地、矿产、自然风光、生物等资源优势,以及民俗、文化等人文优势,推进全域旅游,把资源转化为产业优势和富民优势,带动经济发展。
(2)区位交通制约型。距最近地级市的距离反映了各县区受地级市经济与公共服务辐射的难易程度。从图10d可以看出,该因素对重庆市、张家口市、保定市、大同市、忻州市、吕梁市、桂林市、来宾市、绵阳市、凉山州、甘孜州、阿坝州、怒江州、德宏州、红河州、临沧市、普洱市、阿里地区、日喀则市、山南市、那曲市、林芝市、昌都市、南疆三地州所辖部分深度贫困县有较大影响。措施上应加快完善农村道路、水电气、环保、信息网络等基础设施,加强农村社会保障体系建设,增强基础教育能力,阻断贫困的代际传递。对于地形条件艰苦、交通闭塞的极其偏远地区可以采用异地搬迁扶贫。
(3)经济收入制约型。人均居民储蓄存款和农民人均可支配收入反映的是农村居民经济收入情况。从图10e、10f可以看出,这两个因素对凉山州、黔西州、怒江州、昌都市、山南市、日喀则市、那曲市、临夏州、果洛州、玉树州、中卫市、南疆三地州所辖部分深度贫困县的影响较大。此类地区应同时推进就业扶贫和产业帮扶,打造一批家庭微工厂、创意微作坊、乡村微车间,推进农村经济多元发展。激励返乡、下乡人员开展创新创业,发展特色产业,拓宽农民增收渠道。
(4)生态制约型。植被指数综合反映区域生态状况。从图10g可以看出,该因素对张家口市、忻州市、乌兰察布市、兰州市、白银市、定西市、临夏州、拉萨市、海东市、日喀则市、那曲市、海南州、果洛州、海西州、固原市、中卫市、南疆三地州所辖深度贫困县的影响较大。这些地区对区域资源环境本底存在较高的依赖性,必须走绿色减贫之路,在重点区域推进生态环境综合治理工程,探索建立上下游生态补偿机制,通过以工代赈、提供生态公益岗位等方式,为扶贫对象提供就业机会和收入。
4 结论与讨论
在减贫消贫政策制定中,决策者往往很难观测和获取到贫困家庭的真实属性特征,这会在某种程度上降低精准扶贫政策的瞄准度。考虑到多种空间尺度之间存在嵌套、反馈作用,微观尺度农户个人或家庭的贫困往往被中、宏观尺度上社会经济发展所制约,所以在中、宏观尺度下识别和测度贫困依然是有价值的[15]。本文利用GIS空间分析和BP人工神经网络,分别模拟省域、市域和县域3个尺度下的自然致贫指数和社会经济消贫指数,计算得到贫困压力指数;使用Flexible空间扫描探测确定出深度贫困县,运用地理探测器识别出深度贫困县致贫的主导因素,并提出相应的减贫消贫建议。研究发现,3个尺度下贫困压力指数的空间分布具有较高的一致性,东低西高的趋势很明显。县域尺度下识别出208个深度贫困县,多分布在西北、西南和省域交界地带;依据致贫主导因素将其归为地形要素制约型、区位交通制约型、经济收入制约型和生态环境制约型4种类型。由于本文尚属探索性工作,缺陷和不足在所难免。首先,受数据可获取性的限制,在指标体系构建上,基于县域尺度的部分重要指标(如新型农村社会养老保险、医疗保险、通互联网、自来水和有线电视的行政村等数据)难以获取到官方数据,一定程度上影响到指标体系的完整性;其次,由于东、中、西部的社会经济发展水平差异巨大,社会经济因素对贫困的缓解程度也不尽相同,本文计算贫困压力指数时,参考已有研究成果将20%的社会经济消贫指数用于消除或者缓解当地的贫困,存在一定的主观性。
为实现规划的扶贫、减贫目标,必须将基于区域(Region-based)的战略与基于个人(People-based)的政策相结合。2016年4月国家印发了《关于建立贫困退出机制的意见》,提出了贫困户、贫困村、贫困县3个层面的贫困退出标准。今后的研究将在获得高分辨率数据的前提下,开展以家庭人均收入和“两不愁、三保障”为标准的、基于贫困户层面的研究,乃至以贫困发生率为主要标准,辅以其他综合因素的基于贫困村层面的研究。在现阶段贫困研究的实践界更关注贫困的退出问题,而理论界则更关注2020年后中国的相对贫困问题。深度贫困地区返贫率高,减贫难,代际传递几率大,致贫原因复杂多样且相互交织,脱贫和返贫兼具艰难性、繁复性及反复性。本文识别出的深度贫困地区,很大程度上也可能是2020年后中国主要的相对贫困区域。在本文研究的基础上构建前瞻性的指标,预测和模拟2020年后中国相对贫困的空间分布,应是下一步研究的重点方向。
参考文献 原文顺序
文献年度倒序
文中引用次数倒序
被引期刊影响因子
[本文引用: 2]
[本文引用: 2]
DOI:10.11821/dlxb201701013URL [本文引用: 3]

Rural poverty has long aroused attention from countries around the world, and eliminating poverty and achieving realize common prosperity is an important mission to build the well-off society in an all-round way. Scientifically revealing the regional differentiation mechanism of rural poverty has become an important issue of implementation of national poverty alleviation strategy. This paper, taking Fuping County of Hebei Province as a typical case, diagnoses the dominant factors of differentiation of rural poverty and reveals the dynamic mechanism of rural poverty differentiation by using the Geodetector model and multiple linear regressions, and puts forward the poverty alleviation policies and models for different poverty regions. The result shows that the dominant factors affecting rural poverty differentiation include slope, elevation, per capita arable land resources, distance to the main roads and distance to the center of county, and their power determinant value to poverty incidence differentiation are 0.14, 0.15, 0.15, and 0.17. These factors affect the occurrence of poverty from different aspects and their dynamic mechanism is also different. Among various factors, the slope and per capita arable land resources affect the structure and mode of agricultural production, while distance to the main roads and distance to the center of county have influence on the relationship between the interior and exterior of the region. There are significant differences in the four types identified of regional rural poverty, namely, environment constrained region mainly affected by slope (seven towns), resource oriented region mainly affected by per capita arable land (seven towns), area dominated by traffic location affected by distance to the main roads (three towns), and economic development leading area mainly affected by distance to the center of county (four towns). Then, Fuping County is divided into single core, dual core and multi-core area according to the number of core elements of the township. The county has shown a multi differentiation of rural poverty with a horizontal center of dual core area, and both sides have a single core and multi-core, which are affected by different dominant factors. Finally, this paper suggests that policy of targeted poverty alleviation should take science and technology as the foundation and form innovation of targeted poverty alleviation according to the core dominant factors of the differentiation mechanism of rural poverty. The county's poverty alleviation and development under different driving mechanisms need orderly promotion of poverty alleviation and integration of urban and rural development strategy with adjusting measures to local conditions, respecting for science, and stressing practical results.
DOI:10.11821/dlxb201701013URL [本文引用: 3]
Rural poverty has long aroused attention from countries around the world, and eliminating poverty and achieving realize common prosperity is an important mission to build the well-off society in an all-round way. Scientifically revealing the regional differentiation mechanism of rural poverty has become an important issue of implementation of national poverty alleviation strategy. This paper, taking Fuping County of Hebei Province as a typical case, diagnoses the dominant factors of differentiation of rural poverty and reveals the dynamic mechanism of rural poverty differentiation by using the Geodetector model and multiple linear regressions, and puts forward the poverty alleviation policies and models for different poverty regions. The result shows that the dominant factors affecting rural poverty differentiation include slope, elevation, per capita arable land resources, distance to the main roads and distance to the center of county, and their power determinant value to poverty incidence differentiation are 0.14, 0.15, 0.15, and 0.17. These factors affect the occurrence of poverty from different aspects and their dynamic mechanism is also different. Among various factors, the slope and per capita arable land resources affect the structure and mode of agricultural production, while distance to the main roads and distance to the center of county have influence on the relationship between the interior and exterior of the region. There are significant differences in the four types identified of regional rural poverty, namely, environment constrained region mainly affected by slope (seven towns), resource oriented region mainly affected by per capita arable land (seven towns), area dominated by traffic location affected by distance to the main roads (three towns), and economic development leading area mainly affected by distance to the center of county (four towns). Then, Fuping County is divided into single core, dual core and multi-core area according to the number of core elements of the township. The county has shown a multi differentiation of rural poverty with a horizontal center of dual core area, and both sides have a single core and multi-core, which are affected by different dominant factors. Finally, this paper suggests that policy of targeted poverty alleviation should take science and technology as the foundation and form innovation of targeted poverty alleviation according to the core dominant factors of the differentiation mechanism of rural poverty. The county's poverty alleviation and development under different driving mechanisms need orderly promotion of poverty alleviation and integration of urban and rural development strategy with adjusting measures to local conditions, respecting for science, and stressing practical results.
[本文引用: 1]
[本文引用: 1]
[本文引用: 1]
[本文引用: 1]
[本文引用: 1]
[本文引用: 1]
[本文引用: 3]
[本文引用: 3]
[本文引用: 1]
DOI:10.1007/s11136-017-1731-1URLPMID:29119453 [本文引用: 1]
This study explores the relationships between neighborhood structural differences such as socioeconomic status (SES), income inequality, and ethnic diversity on women's mental health in Accra, Ghana.
[本文引用: 2]
[本文引用: 2]
[本文引用: 1]
[本文引用: 1]
[本文引用: 1]
[本文引用: 1]
[本文引用: 1]
[本文引用: 1]
DOI:10.1016/j.apgeog.2016.06.004URL [本文引用: 1]
DOI:10.13249/j.cnki.sgs.2017.02.007URL [本文引用: 1]
China has been a long-period fast economic growth after its opening policy. The whole degree of poverty in China has decreased sharply, which plays an important role in fulfilling Millennium Development Goals (MDG) made by the United Nations. As a developing country, however, China still has a challenge of reducing poverty and promoting regional development. Rural poverty is still a serious problem in rural China, especially in mountainous or ethnic areas. Different scales of governments in China develop much poverty-alleviation policy, but the efficacy of these policy are sometimes low because “one size fits all” policy always neglect regional difference in poverty resulting from different contexts of different places. Spatial patterns and determinants of regional poverty is a key theme for scholars from many disciplines. Giving that determinants of rural poverty in different places are different and the effects of significant factor are dependent on spatial scales, there is a need for more empirical evidences at different scales or in different regions. Furthermore there is little study to explore the spatial variations of effects of determinants. The present article can fill these gap to some extent through analyzing the determinants of county-level poverty and its spatial variation of their effects within Guizhou Province in the southwestern China. The rate of county-level poverty is largely different within this province. Based on methods of OLS regression, spatial econometric and geographic weighted regression (GWR), this article studies spatial variations and determinants of rural poverty at the county level. The results show that rate of rural poverty is higher in the eastern, southern, western counties than middle and northern counterparts. There is a significant spatial autocorrelation of rural poverty, for index of Moran’s I is between 0.45 and 0.55, which indicates that poverty of neighboring counties have a positive effect on the poverty of a specific county. Some counties with a high-high poor pattern fall into spatial trap of poverty based on results of index of Local Moran’s I. These counties are located at southeast and southern parts of Guizhou and have a high proportion of ethnic minorities’ population. For the determinants, the OLS estimation results show that topographic slope, distance to a local urban center, the percentage of teenagers, the percentage of ethnic minorities are key determinants of spatial variations in rural poverty at the county level. The effects of these four factors are found to have different spatial patterns based on GWR analysis. There is no significant effect for distance to the provincial capital on the rural poverty. The above results have important policy implication. The core implication is to combine place-based and people-based policy, which surpass the current Poverty-Targeting-Alleviation (jing zhun fu pin) initiatives dominating poverty-reduction policy of China’s governments.
DOI:10.3724/SP.J.1047.2015.00069URL [本文引用: 4]
With the implementation of new regional development and poverty alleviation strategy, contiguous destitute region shave turned into the main battle field to promote poverty alleviation and development. Selecting the contiguous destitute regions in Wuling Mountain as the study area, taking county as the study unit, this paper selects the main influence factors of poverty from common natural and social factors to build an evaluation index system. Using GIS and BP Neural Network, this paper simulates natural impoverishing index and socio-economic poverty alleviation index, analyses the reason of regional poverty from the perspective of nature and society, and explores the spatial distribution characteristics of poverty in order to provide decision support for establishing policies for poverty alleviation and development, and achieving regional harmonious development. The results show that the natural factors, such as terrain, slope, and disaster, are the main impoverishing index for the study area. The socio- economic factors, such as education, road, and medical care, could alleviate poverty to some extent. The natural poverty degree for most counties in the study area is above average, in which the Tongren and Xiangxi regions have relatively high level of poverty. Most destitute areas have low socio-economic level, and their ability to alleviate poverty is not strong. The degree of poverty in Qianjiang and Zhangjiajie regions is lower, while in Tongren and Xiangxi regions is higher. Large differences exist between these counties'poverty situations. Guzhang, Longchuan, Wuichuan, Zhengan, Longhui, Xinhua, Daotong, and Chengbu together constitute the poverty distribution pattern of "large dispersion, small aggregation" in Wuling Mountain area. In the process of poverty alleviation and development, considerations should be given to the natural factors, and take advantage of local nature resources, especially the mining resources. According to the poverty type and self-development ability, different regions are compatible with different approaches. Meanwhile, the contiguous destitute regions inWuling Mountain area should interactively strengthen their exchange and cooperation.
[本文引用: 1]
[本文引用: 1]
[本文引用: 2]
[本文引用: 2]
[D].
[本文引用: 2]
[D].
[本文引用: 2]
[本文引用: 1]
[本文引用: 1]
[本文引用: 2]
[本文引用: 2]
[本文引用: 1]
[本文引用: 1]
[本文引用: 1]
[本文引用: 1]
[本文引用: 1]
[本文引用: 1]
[本文引用: 1]
DOI:10.1016/j.ecolind.2016.02.052URL [本文引用: 1]
[本文引用: 1]
[本文引用: 1]
DOI:10.1016/j.landurbplan.2014.01.016URL [本文引用: 1]
The urban heat island (UHI) is a mounting problem in built-up areas, leading to increased temperatures, air pollution, and energy consumption. This paper explores the urban determinants of the UHI, using two-dimensional (2-D) and three-dimensional (3-D) urban information as input to spatial statistical models. The research involves: (a) estimating land surface temperatures, using satellite images, (b) developing a 3-D city model with LiDAR data, (c) generating urban parameters with 2-D/3-D geospatial information, and (d) conducting spatial regression analyses. The data are captured over three grids of square cells 480 m, 240 m, and 120 m and characterize the center of Columbus, Ohio. The results show that solar radiations, open spaces, vegetation, building roof-top areas, and water strongly impact surface temperatures, and that spatial regressions are necessary to capture neighboring effects. The best regression is obtained with the general spatial model (GSM), which is then used to simulate the temperature effects of different greening scenarios (green roofs, greened parking and vacant lots, vegetation densification) in the center of Columbus. The results demonstrate the potential of such models to mitigate the UHI through design and land-use policies. (C) 2014 Elsevier B.V.
DOI:10.1002/sim.4780140809URLPMID:7644860 [本文引用: 1]
We present a new method of detection and inference for spatial clusters of a disease. To avoid ad hoc procedures to test for clustering, we have a clearly defined alternative hypothesis and our test statistic is based on the likelihood ratio. The proposed test can detect clusters of any size, located anywhere in the study region. It is not restricted to clusters that conform to predefined administrative or political borders. The test can be used for spatially aggregated data as well as when exact geographic co-ordinates are known for each individual. We illustrate the method on a data set describing the occurrence of leukaemia in Upstate New York.
[本文引用: 1]
[本文引用: 1]
DOI:10.11821/dlxb201701010URL [本文引用: 1]
Spatial stratified heterogeneity is the spatial expression of natural and socio-economic process, which is an important approach for human to recognize nature since Aristotle. Geodetector is a new statistical method to detect spatial stratified heterogeneity and reveal the driving factors behind it. This method with no linear hypothesis has elegant form and definite physical meaning. Here is the basic idea behind Geodetector: assuming that the study area is divided into several subareas. The study area is characterized by spatial stratified heterogeneity if the sum of the variance of subareas is less than the regional total variance; and if the spatial distribution of the two variables tends to be consistent, there is statistical correlation between them. Q-statistic in Geodetector has already been applied in many fields of natural and social sciences which can be used to measure spatial stratified heterogeneity, detect explanatory factors and analyze the interactive relationship between variables. In this paper, the authors will illustrate the principle of Geodetector and summarize the characteristics and applications in order to facilitate the using of Geodetector and help readers to recognize, mine and utilize spatial stratified heterogeneity.
