Spatio-temporal evolution and trend prediction of urban carbon emission performance in China based on super-efficiency SBM model
WANG Shaojian1, GAO Shuang1, HUANG Yongyuan2, SHI Chenyi1收稿日期:2019-04-25修回日期:2020-03-12网络出版日期:2020-06-25
| 基金资助: |
Received:2019-04-25Revised:2020-03-12Online:2020-06-25
| Fund supported: |
作者简介 About authors
王少剑(1986-),男,河南驻马店人,博士,副教授,博士生导师,中国地理学会会员(S110011019M),研究方向为城市地理、城市与区域规划E-mail:1987wangshaojian@163.com。

摘要
关键词:
Abstract
Keywords:
PDF (3876KB)元数据多维度评价相关文章导出EndNote|Ris|Bibtex收藏本文
本文引用格式
王少剑, 高爽, 黄永源, 史晨怡. 基于超效率SBM模型的中国城市碳排放绩效时空演变格局及预测. 地理学报[J], 2020, 75(6): 1316-1330 doi:10.11821/dlxb202006016
WANG Shaojian.
1 引言
气候变化及其影响已经成为当今世界面临的最为严重的环境问题之一[1]。联合国政府间气候变化专门委员会(IPCC)第四次全球气候评估中指出,全球变暖已是无可争议的事实,人类活动及温室气体的大量排放是导致全球气候变化的主要原因。CO2作为最重要的温室气体之一,与全球气候变暖息息相关[2]。随着城市化与工业化的继续推进,CO2的排放量持续增加,由CO2带来的环境问题引起了各国政府和****的广泛关注。为了实现可持续发展,在“低碳化”的趋势下,各国提出相应的低碳行动计划,例如英国的低碳行动计划,日本的低碳社会行动计划等。中国作为世界上最大的CO2排放国,节能减排一直是国家发展战略的重点[3]。中国于2005年签订《京都协议书》,同时在国家的规划中也有明确的节能减排目标,例如国家在“十二五”规划提出到2015年实现碳排放强度比2010年下降17%的减排目标,“十三五”规划强化了绿色低碳发展的目标,在2020年相比2015年的碳排放强度下降18%,中美联合声明也提出中国规划在2030年CO2的排放总量达到峰值[4],一系列的规划纲要明确提出了低碳发展的目标。相关研究表明,城市是最大的能源消耗及温室气体排放来源[5],建立低碳城市是中国应对气候变化、发展低碳经济的必然选择。基于上述背景,“低碳”“减排”迅速成为学术研究的热点话题,诸如CO2排放的估算方法[6,7]、影响因素[8,9,10]、强度[11,12]和绩效[13]等相关研究相继开展,其中碳排放绩效作为环境绩效评估的重要内容,是相关****关注的重点。当前对于碳排放绩效的研究,根据测度方法可以分为单要素和全要素两类。对于单要素指标,Mielnik等最先以单位能源消耗的碳排放量即碳指数评估发展中国家的碳排放绩效[14];Yamaji则将CO2排放总量与GDP的比值定义为CO2生产率,以此研究日本地区的碳排放水平[15];此后又逐渐出现了其他单要素指标,包括CO2排放强度[16]、人均CO2排放量[17]、工业化的人均累积排放量[18]、能源强度[19]等。
上述有关碳排放绩效的单要素指标,多以CO2排放量与经济或能源相关指标的比值衡量,在实际测算过程中便于理解和操作,但是存在着一定的局限性。碳排放绩效实质是一种经济活动过程中的投入产出效率,无法单纯依赖能源直接产生,是资本、劳动力等经济投入共同作用的结果,故在测算过程中需要突出指标的“全要素”特点,考虑经济生产过程其他投入要素的替代效应[20]。基于全要素和要素替代的思想,在经济生产的过程中将能源消费、资本投资、劳动力作为投入指标形成GDP期望产出与CO2非期望产出,使得CO2排放绩效测算结果更加精确与合理[21]。以此为基础,Ramanathan利用数据包络分析法(Data Envelopment Analysis, DEA)构建包含二氧化碳排放、能源消耗和经济活动变量的投入产出指标体系,以此比较各国的碳排放绩效水平[22]。随后大量****沿用这一思路,研究各国不同行业的碳排放绩效水平。例如Zhou等利用DEA模型和Malmquist指数对全球碳排放量最高的18个国家碳排放绩效进行测度,并考察其影响因素[23];Wang等从产业的角度,利用DEA方法进一步分析了中国各工业部门碳排放效率,结果发现轻工业的碳排放绩效水平普遍高于重工业[24];Meng等利用RAM-DEA模型对中国工业部门2001—2013年期间的低碳经济效率进行估计,发现大部分行业低碳经济效率仍处于较低的水平,但在研究期间效率有了很大提高[25]。研究方法上,由于DEA模型只注重经济活动过程中的期望产出而忽视了非期望产出,可能使结果产生偏差[26],部分****在测算碳排放绩效时使用改进后的模型,如有向距离函数模型[27,28]、基于松弛变量测度模型(Slacks-Based Measure, SBM)[29,30,31]、基于超效率SBM模型[32]等。总体来看,已有研究多从国家尺度、区域尺度和行业尺度开展碳排放绩效的测度分析,缺少城市尺度碳排放绩效的相关研究。
基于以上分析,目前关于碳排放绩效的研究现状主要有两点不足:① 受限于城市能源统计数据的缺失,大多数研究关注的是国家或区域CO2排放绩效,主要反映不同国家或区域之间CO2排放绩效的对比研究,对城市尺度CO2排放绩效研究不足,而城市作为最大的能源消费和温室气体排放的来源[33],研究其碳排放绩效水平对低碳城市建设和低碳经济发展具有重要的理论与现实意义。② 已有研究主要对排放绩效的测度、空间特征和影响因素进行分析,较少涉及CO2排放绩效预测研究,而研究CO2排放绩效的未来发展趋势有助于实现经济增长与碳减排之间的解耦发展。基于此,本文以中国283个地级市的碳排放为研究对象,采用基于非期望产出的超效率SBM模型核算中国各城市1992—2013年CO2的排放绩效,分析其时空演变特征;并分别构建传统和空间马尔科夫链转移概率矩阵对中国城市碳排放绩效的空间溢出效应进行了实证分析,预测中国城市碳排放绩效的长期演变和发展趋势。本文旨在通过以上探索性研究工作,分析中国城市碳排放绩效的时空演变特征及空间溢出效应,预测其长期演变和发展趋势,从而为科学制定低碳可持续发展政策提供依据。
2 数据来源与研究方法
2.1 数据来源
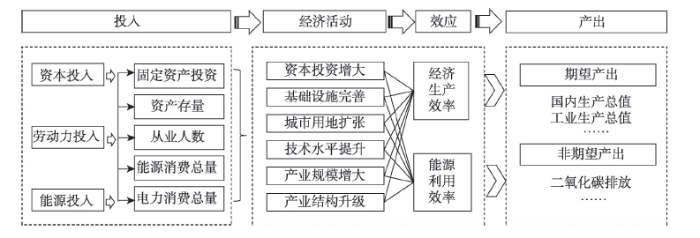
本文研究内容为基于投入产出视角测算中国城市碳排放绩效,考虑到部分城市数据的缺失,最终研究对象为全国283个城市,研究时段为1992—2013年,从城市层面对全国碳排放绩效及其空间溢出效应及未来演变趋势进行评价。在有关碳排放绩效核算的文献中,最重要的投入要素一般为资本、劳动力、能源[20, 29],对经济活动过程中碳排放的影响机制如图1所示。借鉴已有研究,本文选取固定资产投资作为资本投入,选取各城市年末从业人数作为劳动力投入,选取城市电力消费作为能源投入,并选取国内生产总值作为经济活动过程中的期望产出,将城市CO2排放量视为经济活动的非期望产出,构建中国城市碳排放绩效投入产出指标体系(表1)。由于中国实行自上而下的能源统计模式,缺乏城市尺度的能源消费数据,无法进行城市的碳排放核算。为分析城市尺度碳排放绩效的空间溢出效应和发展趋势,本文碳排放数据来自Wang等的研究[34],由夜间灯光影像模拟反演得到。根据DMSP/OLS夜间灯光影像获取城市范围内的夜间灯光数据进行模拟,为确保夜间灯光模拟碳排放数据的精确性,将基于夜间灯光数据模拟的碳排放量结果与部分具有能源消费数据城市的统计计算值进行对比分析,发现模拟值与计算值的相对误差为7.65%[35],具有较好的模拟精度,因此可以使用模拟结果开展中国城市尺度的碳排放绩效研究。投入产出指标体系其余数据均来自《中国城市统计年鉴》和相关城市统计资料,部分年份缺失数据通过线性插值法得到。为了消除通货膨胀的影响以保证数据之间的可比性,国内生产总值、固定资产投资均折算为2000年不变价。图1
 新窗口打开|下载原图ZIP|生成PPT
图1基于投入产出视角的城市碳排放绩效影响机制
Fig. 1Impact mechanism of urban carbon emission efficiency based on input and output perspectives
Tab. 1
表1
表1城市碳排放绩效投入产出指标体系
Tab. 1
| 指标 | 变量 | 单位 | 平均值 | 中间值 | 标准差 | 最小值 | 最大值 |
|---|---|---|---|---|---|---|---|
| 投入指标 | 固定资产投资 | 108元 | 42.65 | 22.50 | 66.34 | 12.95 | 836.24 |
| 从业人员 | 104人 | 220.36 | 183.02 | 169.70 | 0.32 | 1729.55 | |
| 电力消费 | 104 kwh | 680.87 | 366.25 | 907.31 | 0.25 | 8514.69 | |
| 期望产出 | GDP | 108元 | 103.97 | 71.34 | 125.46 | 2.96 | 1483.55 |
| 非期望产出 | CO2排放 | 104 t | 1665.89 | 896.10 | 2219.91 | 0.62 | 20832.94 |
新窗口打开|下载CSV
2.2 研究方法
2.2.1 基于非期望产出的超效率SBM模型 在经济生产过程中,劳动力、资本、能源的投入不仅生产出工业产品,同时也会产生副产品CO2,即非期望产出。最先由Tone[36]提出的SBM模型,由于考虑了生产过程中的非期望产出,更加符合实际情况,故被广泛应用于碳排放绩效[37]、生态效率[38]和能源效率[39]等的测算研究。与传统的数据包络模型(DEA)相比,基于非期望产出的SBM模型一方面可以解决投入产出松弛性问题,另一方面也解决了非期望产出存在下的效率分析问题[40]。因此,基于前人的研究,本文采用了基于非期望产出的SBM模型核算中国城市CO2的排放绩效。假设有n个决策单元的生产系统,每个决策单元由投入、期望产出和非期望产出三个投入产出向量构成,使用m单位投入产生S1的期望产出和S2的非期望产出[41]。三个投入产出向量可表示为:
假设X > 0,Yg > 0,Yb > 0,则生产可能性集可定义为:
式中:实际的期望产出低于前沿理想期望产出水平,实际非期望产出高于前沿的非期望产出水平[42]。基于生产可能性集,根据Tone的SBM模型将非期望产出纳入评价决策单元
式中:
在大多数效率评价的研究中,存在一个共同的现象,即多个决策单元具有100%的“效率状态”,因此在效率排序时,区分这些效率决策单元与影响因素是非常重要的。为了保证效率分析产生更合理的效率评价值,结合Tone[43]的研究,本文选择超效率SBM模型进行测算,其模型表达如下:
式中:ρ*的目标函数值是决策单元的效率值,值的大小可以超过1,其他变量定义与公式(3)类似,以上的模型都是基于规模不变的假设之下。
2.2.2 空间马尔科夫链 揭示区域的时空动态变化是地理学研究中的重要内容。泰尔指数、锡尔系数和变异系数等方法与探索性空间统计方法的结合,可以反映地理现象的时空演变规律和空间分布特征,进一步通过比较不同年份的核密度估计结果,可以描述数据整体分布形态的演变特征与规律。然而,上述方法偏重于反映区域现象的静态过程,不能直接反映区域的动态发展特征,同时上述方法更偏向于提供区域整体的信息,却不能提供事物在演进过程中的任何内部动态的信息。为了补充上述方法的不足,马尔科夫链方法将区域现象的演变过程视为马尔科夫过程,通过引入转移概率矩阵分析方法从而叠合区域内每个个体现象在不同时期的动态演变过程,能够反映出区域内每个地区的状态及其向上或向下转移的流动性[44,45]。
马尔科夫链的基本方法是:根据区域现象量化的连续数值的大小,将区域现象离散为k种状态类型,计算各种类型的变化及其概率,从而将区域现象演变过程近似为马尔科夫过程。首先,建立一个1×k的矩阵
Tab. 2
表2
表2马尔科夫转移概率矩阵M (k=4)
Tab. 2
| t\t+1 | 1 | 2 | 3 | 4 |
|---|---|---|---|---|
| 1 | P11 | P12 | P13 | P14 |
| 2 | P21 | P22 | P23 | P24 |
| 3 | P31 | P32 | P33 | P34 |
| 4 | P41 | P42 | P43 | P44 |
新窗口打开|下载CSV
式中:zij表示在整个研究期间内由t时刻属于i类型的研究区在下一时刻转移为j类型的研究区的数量总和;zi表示在整个研究时期内属于类型i的区域数量总和。
在不同时期的研究中,****们均发现由于地理邻近性而产生的空间溢出性对区域的发展演变具有重要的作用[46]。考虑区域现象空间性特征,基于传统马尔科夫链的转移概率矩阵,引入“空间滞后”的概念作为条件并同样划分为k种类型,将k×k的转移概率矩阵分解为k个k×k的转移条件概率矩阵(表3)。其中,矩阵中的元素Pki|j表示在空间滞后类型为k的条件下,区域从初始状态类型i在下一时刻转移为类型j的概率。例如P12|1表示在邻域城市碳排放绩效类型为1的条件下,城市在t时刻碳排放绩效为类型2在t+1时刻转移为类型1的概率。空间滞后类型考虑了地理上与该区域邻近的单元,区域a的空间滞后值Laga是该区域周边地理单元观测值的加权平均,具体公式为:
Tab. 3
表3
表3空间马尔科夫转移概率矩阵N (k=4)
Tab. 3
| Lag | t\t+1 | 1 | 2 | 3 | 4 |
|---|---|---|---|---|---|
| 1 | 1 | P11|1 | P12|1 | P13|1 | P14|1 |
| 2 | P21|1 | P22|1 | P23|1 | P24|1 | |
| 3 | P31|1 | P32|1 | P33|1 | P34|1 | |
| 4 | P41|1 | P42|1 | P43|1 | P44|1 | |
| 2 | 1 | P11|2 | P12|2 | P13|2 | P14|2 |
| 2 | P21|2 | P22|2 | P23|2 | P24|2 | |
| 3 | P31|2 | P32|2 | P33|2 | P34|2 | |
| 4 | P41|2 | P42|2 | P43|2 | P44|2 | |
| 3 | 1 | P11|3 | P12|3 | P13|3 | P14|3 |
| 2 | P21|3 | P22|3 | P23|3 | P24|3 | |
| 3 | P31|3 | P32|3 | P33|3 | P34|3 | |
| 4 | P41|3 | P42|3 | P43|3 | P44|3 | |
| 4 | 1 | P11|4 | P12|4 | P13|4 | P14|4 |
| 2 | P21|4 | P22|4 | P23|4 | P24|4 | |
| 3 | P31|4 | P32|4 | P33|4 | P34|4 | |
| 4 | P41|4 | P42|4 | P43|4 | P44|4 |
新窗口打开|下载CSV
式中:Yb为区域b的观测值;Laga为区域a的空间滞后值;n为城市总个数;空间权重矩阵Wab表示区a域和区域b的空间关系,本文采用邻接原则定义空间关系,即地区相邻值为1,否则为0。同时,由于统计数据缺失而形成的孤岛问题,本文将与该城市距离最近的城市定义为邻接城市。
假设在长时间的转移后,系统将出现一个稳定的状态,也称为终极状态,这意味着该状态将不受时间变化的影响,处于平衡状态,此刻对应的概率被称为终极状态概率或者平衡状态概率。结合极限的定义,通过马尔科夫转移概率矩阵能够计算出终极状态。利用随机过程的平衡分布概率可以对预测马尔科夫过程在未来可能会出现的趋势提供重要信息。按照极限的定义有:
将式(7)代入马尔科夫预测模型的递推公式中可得:
式中:π为马尔科夫过程演变的终极状态矩阵。若π满足
3 中国城市碳排放绩效时空演变特征
3.1 中国城市碳排放绩效测算与时空分布
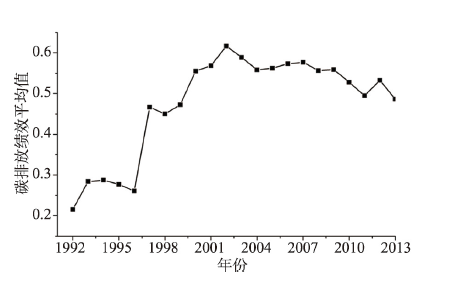
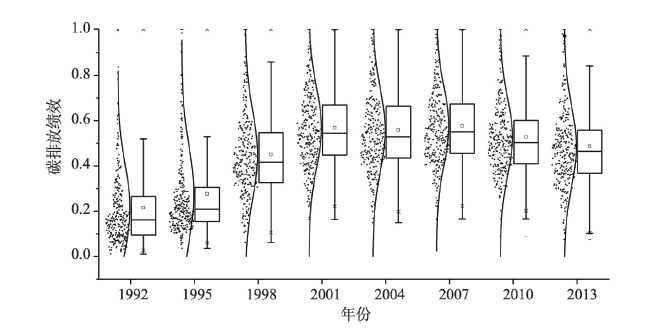
基于非期望产出的超效率SBM模型,对中国1992—2013年283个城市的碳排放绩效进行测定,求解各年份平均值,并分析中国城市碳排放绩效的时空演变特征。由图2可知,整体上中国城市碳排放绩效仍处于较低的水平,各年份平均碳排放绩效基本处在0.6以下,由此可见,中国经济发展过程中有着较大的技术进步和低碳减排的空间。其中,中国碳排放绩效呈现波动并稳定上升的趋势,1995—2002年中国碳排放绩效上升幅度最明显,2002年达到峰值0.62,随后呈现平稳下降的趋势,但下降的幅度较小。基于对低碳城市建设的重视和节能减排的决心,中国政府的一系列措施使碳排放效率在1995—2002年间有了明显的提高。但随着节能减排瓶颈的到来,中国碳排放绩效也出现停滞状态,急需新一轮的产业转型和能源结构调整提高碳排放绩效水平。箱型图(图3)展示了1992—2013年中国各城市碳排放绩效的分布特征变化,可知在研究期间中国城市整体碳排放绩效水平有较大提升。其中各城市碳排放均值的变化由低值集中,发展为向两端扩散、中值集中的分布形态。有较多碳排放处于低效率的城市随着技术的投入和产业的升级,其碳排放绩效有了较为明显的提升,但部分城市碳排放绩效依旧处于较低水平,国内碳排放绩效水平的差异性明显。
图2
 新窗口打开|下载原图ZIP|生成PPT
图21992-2013年中国城市碳排放绩效变化趋势
Fig. 2The evolution trend of urban carbon emission performance
图3
 新窗口打开|下载原图ZIP|生成PPT
图31992-2013年中国城市碳排放绩效箱型图
Fig. 3Urban carbon emission performance box chart of China in 1992-2013
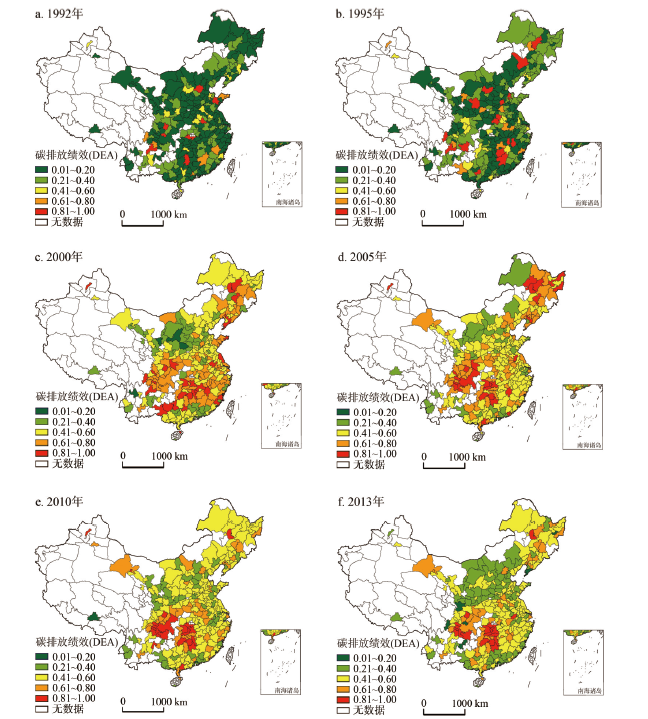
为更好地了解中国城市碳排放绩效的空间演变特征,使用ArcGIS 10.3软件将全国城市碳排放绩效可视化,得到中国城市碳排放绩效空间分布图(图4)。从空间维度看,大多数城市的碳排放绩效在研究期间内均有较大的提升,其中1995—2000年提升尤为明显。自2000年以来,湖南、湖北、江西、浙江、江苏、安徽、山东和辽宁省等地区城市的碳排放绩效均有较大幅度提升,而陕西、山西、河北、广西和广东省的城市碳排放绩效提升幅度相对较低。值得注意的是,在2000—2005年期间黑龙江、吉林地区的城市碳排放绩效较高,随后出现一定程度的下滑;此外,陕西、河北、河南、广东省等地区在2010—2013年期间均出现下滑的趋势。至2013年,全国城市碳排放绩效空间格局呈现“南高北低”特征,南方地区城市碳排放绩效普遍高于北方地区,主要呈现以湖南、四川为核心,碳排放绩效逐渐向外降低的格局,黑龙江、吉林等地区为中国城市碳排放绩效高值副核心,华北平原和东部沿海地区的城市碳排放绩效相对较低。
图4
 新窗口打开|下载原图ZIP|生成PPT
图41992—2013年中国城市碳排放绩效空间分布格局
Fig. 4Spatial distribution pattern of urban carbon emission performance of China in 1992-2013
3.2 中国城市碳排放绩效时空演变特征
为了深入分析中国城市碳排放绩效的时空演变特征,构建传统的马尔科夫转移概率矩阵和基于空间的马尔科夫转移概率矩阵。碳排放绩效被离散为低、较低、较高、高4种状态,并分别用k = 1, 2, 3, 4表示。其中,从低值向高值转移定义为向上转移,由高值向低值转移定义为向下转移。表4为1992—2013年中国城市碳排放绩效类型传统的马尔科夫转移概率矩阵,根据计算结果可得:① 对角线的概率值均大于非对角线的概率值,说明中国城市碳排放绩效类型转移具有稳定性,维持原有状态的概率较大。② 中国城市碳排放绩效存在“俱乐部收敛”现象,碳排放绩效低和高的类型在下一阶段维持原有状态类型的概率最大,分别为74.37%和80.13%。③ 在相邻年份的城市碳排放绩效类型转移实现“跨越式”发展的概率较小,各状态类型实现跨等级转移的概率均小于6%。Tab. 4
表4
表41992—2013年中国城市碳排放绩效类型马尔科夫转移概率矩阵
Tab. 4
| t\t+1 | n | 1 | 2 | 3 | 4 |
|---|---|---|---|---|---|
| 1 | 1514 | 0.7437 | 0.1777 | 0.0575 | 0.0211 |
| 2 | 1457 | 0.1030 | 0.6603 | 0.1929 | 0.0439 |
| 3 | 1472 | 0.0177 | 0.1793 | 0.6372 | 0.1658 |
| 4 | 1500 | 0.0133 | 0.0253 | 0.1600 | 0.8013 |
新窗口打开|下载CSV
在传统的马尔科夫链转移概率矩阵中加入空间滞后条件,构建空间马尔科夫转移概率矩阵,通过对比分析在不同邻域背景下城市碳排放绩效的转移概率探讨邻域背景对城市碳排放绩效转移的影响。表5为1992—2013年中国城市碳排放绩效类型空间马尔科夫转移概率矩阵,根据计算结果可得:① 地理背景在中国城市碳排放绩效转移过程中发挥重要作用。对比传统的马尔科夫转移概率矩阵,在不同的地理背景下,中国城市的碳排放绩效转移概率发生了明显的变化。② 城市的碳排放绩效与区域碳排放绩效类型具有协同性。当邻域类型为1时,在t时段处于碳排放绩效低的城市数量明显多于其他类型的城市数量,当邻域类型为4时,在t时段处于碳排放绩效高的城市数量亦明显大于其他类型的城市数量。③ 一般来说,与碳排放绩效低的区域为邻,该城市碳排放绩效类型向下转移的概率增大,当与碳排放绩效高的区域为邻时,该城市的碳排放绩效类型向上转移的概率将增大。例如,在碳排放绩效低的邻域条件下,P21|1(0.1565)> P21(0.1029),P32|1(0.2330)> P32(0.1793),而在碳排放绩效高的邻域条件下,P12|4(0.3272)> P12(0.1776),P23|4(0.2089)> P23(0.1928)(表5)。④ 空间马尔科夫转移概率矩阵在空间维度为“俱乐部收敛”现象提供了解释依据。受邻域类型溢出效应的影响,中国城市碳排放绩效类型转移容易在一定的地理空间范围内形成“俱乐部收敛”现象。在碳排放绩效低的区域,碳排放绩效状态类型向上转移的概率上升,向下转移的概率下降,因此该地理范围内碳排放绩效低的城市数量有增大的趋势,反之亦然。
Tab. 5
表5
表51992—2013年中国城市碳排放绩效类型空间马尔科夫转移概率矩阵
Tab. 5
| 邻域类型 | t\t+1 | n | 1 | 2 | 3 | 4 |
|---|---|---|---|---|---|---|
| 1 | 1 | 807 | 0.7720 | 0.1437 | 0.0595 | 0.0248 |
| 2 | 313 | 0.1565 | 0.6006 | 0.1821 | 0.0607 | |
| 3 | 206 | 0.0388 | 0.2330 | 0.5631 | 0.1650 | |
| 4 | 176 | 0.0341 | 0.0455 | 0.1364 | 0.7841 | |
| 2 | 1 | 470 | 0.7319 | 0.2000 | 0.0553 | 0.0128 |
| 2 | 436 | 0.1124 | 0.6651 | 0.1789 | 0.0436 | |
| 3 | 321 | 0.0218 | 0.2274 | 0.5919 | 0.1589 | |
| 4 | 256 | 0.0430 | 0.0313 | 0.1953 | 0.7305 | |
| 3 | 1 | 182 | 0.6923 | 0.2253 | 0.0495 | 0.0330 |
| 2 | 440 | 0.0750 | 0.6841 | 0.2045 | 0.0364 | |
| 3 | 475 | 0.0147 | 0.1537 | 0.6505 | 0.1811 | |
| 4 | 371 | 0.0054 | 0.0296 | 0.2075 | 0.7574 | |
| 4 | 1 | 55 | 0.6000 | 0.3273 | 0.0727 | 0.0000 |
| 2 | 268 | 0.0709 | 0.6828 | 0.2090 | 0.0373 | |
| 3 | 470 | 0.0085 | 0.1489 | 0.6872 | 0.1553 | |
| 4 | 697 | 0.0014 | 0.0158 | 0.1277 | 0.8551 |
新窗口打开|下载CSV
在考虑邻域背景条件后,中国城市碳排放绩效的转移情况发生明显的改变,说明城市碳排放绩效的演变具有空间溢出效应。为验证空间滞后效应在统计学意义上是否显著,需要进行假设检验,假设城市的碳排放绩效类型的转移是相互独立的,与邻域状态类型无关,检验的公式为:
式中:k为城市碳排放绩效状态类型数量,本文中k = 4;mij为传统马尔科夫转移概率;mij(S)表示邻域状态类型为S的空间马尔科夫转移概率;nij(S)表示邻域状态类型为S的空间马尔科夫转移的城市个数;Qb服从自由度为k(k-1)2的卡方分布。未调整自由度的情况下,自由度为36,在α = 0.005的置信水平下,Qb = 109.15 > χ2(40) = 66.77,因此拒绝接受中国城市碳排放绩效的类型转移在空间上是相互独立的假设。
空间马尔科夫转移概率矩阵的结果表明,中国城市的碳排放绩演变具有明显的空间溢出效应。主要表现为城市的碳排放绩效与区域碳排放绩效类型具有协同性,区域内部能源利用效率具有较强的空间关联性;同时中国城市碳排放绩效类型转移受邻域类型溢出效应的影响,容易在一定的地理空间范围内形成“俱乐部收敛”现象,地理背景在中国城市碳排放绩效转移过程中发挥重要作用。基于投入产出视角可知,区域碳排放绩效水平是期望产出和非期望产出共同作用的结果,受区域的经济活动主导(图1)。因此,区域碳排放绩效的空间溢出效应是区域经济活动空间溢出效应的具体表现。
根据经济增长理论,区域的经济活动是资本、市场、技术和政策等多种因素共同作用的结果,各要素在特定的资本条件、技术水平和制度环境等地理背景下相互作用形成了区域经济发展模式[47]。在市场化和开放经济的条件下,统一市场的出现加深了各经济要素自由流动,开放经济使得区域可以学习其他地区尤其是邻近地区的先进技术,政策创新的边际效用递减促使政府间的制度学习与模仿,使得区域的经济发展模式在演化中不断趋于协同,经济活动存在空间溢出效应[47]。特别是信息化的发展和区域基础设施的不断完善,降低了区域间要素的流动成本,促进区域间的要素自由流动从而使得经济活动的空间溢出效应更加显著[48]。一方面,区域经济活动的空间溢出效应影响着产业结构、技术水平等经济活动指标,改变了区域的经济产出效率,使得区域经济活动的期望产出在演化中存在空间溢出效应;另一方面,《2010年世界发展指标》指出,中国工业部门的能源消耗占总能耗的70%,所带来的碳排放占排放总量的85%[49],表明区域的经济活动具有强烈的能源依赖性。区域经济发展模式的协同转变导致区域内部的能源消费模式和能源利用效率的协同转变[50],使得经济活动的非期望产出碳排放同样趋于协同从而存在空间溢出效应。区域间的经济活动的空间溢出受到多种要素相互作用的影响,通过改变经济活动的期望产出和非期望产出影响区域的碳排放绩效,因此碳排放绩效的空间溢出效应是市场、技术和制度等多种地理要素共同作用的结果。
4 中国城市碳排放绩效预测
马尔科夫转移概率的极限分布为各种类型转移达到一种平衡状态下的分布,计算马尔科夫和空间马尔科夫的极限分布能够有效地预测中国碳排放绩效的长期演变和发展趋势。当k→∞时,求得中国城市碳排放绩效的状态类型在k次转移后的极限分布,在加入空间滞后条件后,可分析在每一类邻域背景下城市碳排放绩效状态类型的极限分布。表6为中国城市碳排放绩效长期演变趋势的预测结果。在不考虑空间滞后的情况下,根据传统的马尔科夫转移概率矩阵求解极限分布并与初始状态对比,发现处于状态1、2、3的数量均在减少,而状态4的数量则有明显增加。这说明从长期来看,中国城市碳排放绩效类型将随时间推移而逐步由低级状态向高级状态转移,呈现由低至高依次递增的演变趋势,碳排放绩效逐步提高。在考虑空间滞后的条件下,中国城市碳排放绩效的演变趋势发生明显的变化。从长期来看,与碳排放绩效低的区域(类型1)为邻,将出现1、2、3、4这4种状态类型城市数量相当的局面。其中,碳排放绩效高的城市数量(27.13%)略多于其他类型的城市,整体进步的空间较大。而与碳排放绩效较高的区域(类型为3和4)为邻,城市碳排放绩效类型为3和4的数量(34.71%和30.93%,32.49%和40.54%)将远高于类型1和2。在该邻域背景下,碳排放绩效的“马太效应”现象将逐渐消失,并向高绩效区间集聚。
Tab. 6
表6
表61992—2013年中国城市碳排放绩效类型的演变趋势预测
Tab. 6
| 状态类型 | 1 | 2 | 3 | 4 | ||
|---|---|---|---|---|---|---|
| 不考虑空间滞后 | 初始状态 | 0.1484 | 0.3534 | 0.3004 | 0.1979 | |
| 终极状态 | 0.1377 | 0.2512 | 0.2948 | 0.3162 | ||
| 考虑空间滞后 | 终极状态 | 1 | 0.2521 | 0.2524 | 0.2242 | 0.2713 |
| 2 | 0.1908 | 0.3184 | 0.2708 | 0.2201 | ||
| 3 | 0.0851 | 0.2585 | 0.3471 | 0.3093 | ||
| 4 | 0.0477 | 0.2220 | 0.3249 | 0.4054 | ||
新窗口打开|下载CSV
总体而言,按目前的趋势发展,中国碳排放绩效长期的演变趋势较为乐观,碳排放绩效随时间的推移而逐步提升,碳排放绩效分布呈现向高值集中的趋势,各类型的城市数量由等级低至高(1→4)依次增加。不同邻域背景对城市碳排放绩效演变的影响具有异质性,与绩效低的区域为邻的城市,碳排放绩效提升的幅度较小,呈现4种状态类型数量相似的分布。而与绩效较高的区域为邻的城市,碳排放绩效类型向3和4集聚,呈现整体提升的趋势。
5 结论与讨论
本文以1992—2013年中国主要地级市的面板数据为研究单元,将城市碳排放作为非期望产出,采用超效率SBM模型对城市碳排放绩效进行测定,并分别构建传统和基于空间马尔科夫链转移概率矩阵对中国城市碳排放绩效的空间溢出效应进行实证分析,得出城市碳排放绩效的时空动态演变特征,并预测其未来演变发展的趋势。主要结论为:(1)从时空格局分布来看,基于碳排放折线图、箱型图和空间分布图,整体上中国城市碳排放绩效呈现波动中稳定上升的趋势,但是仍处于较低的水平,城市碳排放绩效仍具有较大的提升空间。各城市碳排放均值的变化由低值集中,发展为向两端扩散、中值集中的分布形态,城市间碳排放绩效水平的不均衡性尤为突出。空间上,全国城市碳排放绩效空间格局呈现“南高北低”特征,南方地区城市碳排放绩效普遍高于北方地区,主要呈现以湖南、四川为核心,碳排放绩效逐渐向外降低的格局。
(2)从时空演变特征来看,传统马尔科夫概率转移矩阵结果显示,中国城市碳排放绩效具有稳定性,且存在“俱乐部收敛”现象,在相邻年份较难实现跨越式发展,矩阵两端类型不变的概率最大。与空间马尔科夫转移概率矩阵进行对比显示,地理背景在中国城市碳排放绩效转移过程中发挥重要作用,在不同的地理背景下,中国城市的碳排放绩效转移概率发生了明显变化。某城市与碳排放绩效低的区域为邻时,该城市碳排放绩效类型向下转移的概率增大,当与碳排放绩效高的区域为邻时,该城市的碳排放绩效类型向上转移的概率将增大。空间马尔科夫转移概率矩阵在空间维度为“俱乐部收敛”现象提供了解释依据。受邻域类型溢出效应的影响,中国城市碳排放绩效容易在一定的地理空间范围内形成“俱乐部收敛”现象。
(3)从长期演变和发展趋势来看,中国碳排放绩效未来较为乐观,碳排放绩效随时间的推移而逐步提升,碳排放绩效分布呈现向高值集中的趋势,各类型的城市数量由等级低至高(1→4)依次增加。不同邻域背景对城市碳排放绩效演变的影响具有异质性,与绩效低的区域为邻的城市,碳排放绩效提升的幅度较小,呈现4种状态类型均匀分布。而与绩效较高的区域为邻的城市,碳排放绩效类型向3和4集聚,呈现整体提升的趋势。
中国城市碳排放绩效的现状来看,沿海等经济活动发达地区的碳排放绩效仍低于中西部经济欠发达地区,由此可见,当前中国的经济发展仍为“高能耗、高排放、高增长”的三高模式[20]。虽然中国各级政府重视低碳减排,陆续出台了一系列政策措施,取得了较为积极的成果,但是中国仍处在经济发展与碳排放之间倒“U”型环境库兹涅兹曲线的上升区段[51]。中国城市碳排放绩效的演变趋势显示目前城市间碳排放绩效的不均衡性较强,部分城市的碳排放绩效仍然存在较大的提升潜力,因此中国经济现代化发展仍面临资源节约、节能减排的艰巨任务,未来中国应继续加大研发力度以提高城市碳排放绩效,实现国家节能减排的目标[52,53]。马尔科夫矩阵和空间马尔科夫矩阵结果表明中国城市碳排放绩效演化具有明显的空间依赖特征,城市的碳排放绩效与区域碳排放绩效类型具有协同性。因此不同地理背景的邻域城市之间应该建立完善的经济合作联动机制,尤其是邻域类型为碳排放绩效高值地区的城市,应加强与高值地区的产业、技术、制度的交流,提升自身的碳排放绩效水平;同时政府应从区域和城市视角制定节能减排政策,根据城市自身经济发展水平提出相应的减排目标,并与区域其他城市联动在区域层面形成协同减排效应,从而在整体上实现中国建设低碳城市和发展低碳经济的目标[4]。
本文基于遥感数据核算全国1992—2013年283个地级以上城市的碳排放绩效,并测度城市碳排放绩效水平、空间溢出效应和未来演变发展的趋势,对中国建设低碳城市具有重要的政策意义,但仍存在不足之处。使用夜间灯光数据模拟反演城市碳排放量为城市尺度的碳排放研究提供了新的视角,但模拟数据仍具有一定的相对误差,同时现有的DMSP/OLS灯光影像数据仅公布至2013年,其继任产品VIIRS/DNB夜间灯光数据,由于两种传感器在光谱波段、分辨率和扫描幅宽等参数存在差异使得两种数据不匹配,本文并未解决两种数据的衔接问题,因此无法开展更具时效性的研究。近年来,随着中国发展进入新常态,经济发展态势改变较大,对碳排放绩效水平和演变趋势也会产生深远的影响,未来需要解决两种夜间灯光数据的衔接问题或拓展城市尺度的碳排放数据来源渠道以开展更具时效性的研究。另外,本文在建立投入产出指标体系时使用替代数据虽然出于数据的可获取性和便捷性考虑,但研究精度仍略显不足,例如使用电力消费替代能源投入,没有考虑不同城市的能源消费状况;使用年末从业人数替代劳动力投入,忽视了不同产业结构劳动力种类和质量的差别造成的影响,未来研究需要在数据全面性和精确性方面进一步细化。
参考文献 原文顺序
文献年度倒序
文中引用次数倒序
被引期刊影响因子
DOI:10.11821/dlxb201311007URL [本文引用: 1]

It is critical for China to make the emission reduction targets and development of the scientific emission reduction planning in the future. On the basis of the DMSP/OLS night light imageries, this research estimates the China's city-level carbon emissions from 1992 to 2010. This makes up the vacancies of statistical carbon emission data and overcomes the inconsistence of statistical carbon emission methods. Analysis results from three scales (the whole mainland of China, 4 economic regions and 6 urban agglomerations) show that the national CO2 emissions grew continually, but varied from place to place. What is more, the spatial agglomeration of China's CO2 emissions has become more and more obvious, which have led to the current CO2 emission pattern—"high-high concentration in eastern coastal cities and low-low concentration in western undeveloped cities". The carbon emission intensity of per capita basically maintains as the "Eastern > Northeastern > Western > Central" pattern. The carbon emission intensity of per GDP shows the "Higher in Northeastern and Western China" and "Lower in Eastern and Central China" pattern. Growth rate of GDP is the major factor affecting the increasing speed of carbon emissions. Energy structures, energy efficiencies, industrial structures are the three main factors influencing the carbon intensities. As for the Western and Northeastern regions, whose industries are mainly energy-related and heavy ones, their best mitigation policies should be optimizing the energy structure and increasing energy use efficiently.
DOI:10.11821/dlxb201311007URL [本文引用: 1]
It is critical for China to make the emission reduction targets and development of the scientific emission reduction planning in the future. On the basis of the DMSP/OLS night light imageries, this research estimates the China's city-level carbon emissions from 1992 to 2010. This makes up the vacancies of statistical carbon emission data and overcomes the inconsistence of statistical carbon emission methods. Analysis results from three scales (the whole mainland of China, 4 economic regions and 6 urban agglomerations) show that the national CO2 emissions grew continually, but varied from place to place. What is more, the spatial agglomeration of China's CO2 emissions has become more and more obvious, which have led to the current CO2 emission pattern—"high-high concentration in eastern coastal cities and low-low concentration in western undeveloped cities". The carbon emission intensity of per capita basically maintains as the "Eastern > Northeastern > Western > Central" pattern. The carbon emission intensity of per GDP shows the "Higher in Northeastern and Western China" and "Lower in Eastern and Central China" pattern. Growth rate of GDP is the major factor affecting the increasing speed of carbon emissions. Energy structures, energy efficiencies, industrial structures are the three main factors influencing the carbon intensities. As for the Western and Northeastern regions, whose industries are mainly energy-related and heavy ones, their best mitigation policies should be optimizing the energy structure and increasing energy use efficiently.
DOI:10.1016/j.apenergy.2018.11.082URL [本文引用: 1]
[本文引用: 1]
[本文引用: 1]
[本文引用: 2]
[本文引用: 2]
DOI:10.1016/j.enpol.2009.08.022URL [本文引用: 1]
URL [本文引用: 1]
Energy-related CO2 emission is one of the largest drivers for accelerating atmosphere radiative forcing which contribute to global warming, and thus needs to be taken in high priority for Greenhouse-gas (GHG) emission abatement. Cities, with its aggregation of economic activities and associated energy use, are the main contributors of energy consumption CO2 emissions and may be critical for CO2 mitigation and adaptation to climate change. However, uncertainty exists among urban energy consumption CO2 emissions, as the accounting methods of carbon emissions for urban energy consumption would affect accounting results, hindering climate adaptation and CO2 mitigation policies. Here, we analyzed the discrepancy between different CO2 accounting methods, and illustrated the underlying reasons. The study is based on the reference approach of IPCC Guideline for National Greenhouse-gas Emission Inventory, adopted China’s energy statistical data, and categorized energy consumption into three accounting methods based on apparent energy consumption data, i.e., 1) final energy use of carbon emission from an energy input-output perspective, 2) total energy consumption account by major energy category, and 3) final use account by energy category. Solid, liquid, and gas fuel are accounted for. Furthermore, an accounting system of carbon emissions from urban energy consumption was established based on the three types of accounting methods. Accounting results of carbon emission from energy consumption in Beijing were obtained with the three methods. Results show that discrepancies exist among the three types of accounting methods. By further analyzing the causes of discrepancy, it was concluded that 1) the discrepancy is generally caused by differing account methods and associated data error; 2) the accounting method of CO2 emissions based on the energy balance sheet may avoid the omission and double counting of the secondary energy consumption due to its direct reflection on the input and output status of energy production and use, and lead to a smaller error compared with other methods in theory. It was indicated that the accounting method based on the energy balance sheet needs to be placed in high priority for urban energy consumption CO2 emission accounting. The current statistics system needs to be more explicit to satisfy the calculation requirement of carbon emissions from energy consumption.
DOI:10.11821/xb201206004URL [本文引用: 1]
Cities are areas where human energy activities and carbon emission concentrated. The study on carbon cycle of urban system is helpful to understand the role of cities in the regional carbon cycle process, and can provide theoretical reference for establishing urban carbon emission estimation standard and low-carbon urban development pattern. Based on the method of IPCC and other researches, systematic urban carbon storage and carbon flux estimation methods was established, carbon cycle of urban system of Nanjing city was studied, and carbon storage, carbon flux and carbon balance of Nanjing city were analyzed. The main conclusions can be drawn as follows. (1) The total carbon storage of Nanjing city presented a slow rising trend. In 2009, the total carbon storage was 6937?104 t, in which natural carbon storage accounted for 88%. Human carbon storage, especially the carbon pool in urban greenbelt and buildings presented a drastically increasing trend. (2) Vertical carbon input flux of Nanjing city mainly included photosynthesis and water carbon absorption. Lateral carbon input flux rapidly increased and reached 3043?104 t, in which carbon input by energy and timber increased and carbon input by food deceased. (3) Vertical carbon output flux rapidly increased and reached 3295?104 t, in which carbon emission by fossil energy use accounted for nearly 80%, but carbon from natural process only accounted for 6%, indicating that human carbon emission constituted the main part of urban vertical carbon flux. Lateral carbon output flux presented a declining trend, which included energy products, aquatic products and organic waste. (4) In the past years, the carbon output was higher than carbon input of Nanjing city, and the balance between them showed an expanding trend. Generally, the percentage of hidden carbon flow and the carbon needed for manufacturing decreased, which indicated that the carbon efficiency was increasing. (5) Carbon compensation rate of Nanjing city obviously decreased, which indicated that the terrestrial carbon sink function of Nanjing city were not enough to compensate the anthropogenic carbon emissions, and the carbon balance of Nanjing city was seriously disturbed, which caused the increase of carbon cycle pressure.
URL [本文引用: 1]
With rapid growth of economy in China, a series of problems associated with resources and the environment have emerged. In this paper, a decomposition model based on the extended Kaya equation was established. The LMDI addition approach was applied to examine the influential factors of carbon emissions in China based on different industries and different sectors within an industry from 1995 to 2009. Impacts of economy output, population scale, energy structure, energy intensity, and industrial structures on carbon emissions were fully examined. Results were obtained as follows. In general, the major driver of carbon emissions was the economy output effect, whose contribution ratio reached 148.49%, followed by the population scale effect of 9.65%, and the energy structure effect of 1.36%. The major constraint was the energy intensity effect, whose contribution ratio reached -53.43%. The industry structure showed a restraining effect, whose contribution ratio reached -6.07%, but the potential has not appeared. It was found that agriculture, forestry, animal husbandry, and fishery and building industry have achieved a good state of development of low carbon, whereas transportation, storage, postal industry, wholesale, retail trade, accommodation, and catering industries show a poor state. Carbon emissions come mostly from electricity power steam and water production industry, petroleum processing and coking plant industry, black metal smelting and rolling processing industry, chemical raw material and chemical products manufacturing industry, and nonmetal mineral product industry. Policies as to carbon emissions reduction are put forward from the aspects of energy utilization efficiency, energy structure, industrial structure, as well as economy growth. Concerning current policies, firstly, our country is suggested to focus on regulating industrial structure to improve the ratio of the tertiary industry in national economy. Secondly, continued improvement in the energy utilization efficiency is strongly encouraged so as to reduce the overall energy intensity. For example, the government should place more emphasis on developing non-fossil-fuel resources, increasing the proportion of natural gas instead of coal in the primary energy consumption by means of technology, policy, and law, and promoting energy efficiency, especially reducing energy intensity in the secondary industry. Thirdly, more attention should be paid to the quality of economic growth instead of the quantity of growth. Finally, the concepts of low-carbon consumption and green consumption should be advocated by the government to encourage the public to save energy and abate emission.
[本文引用: 1]
[本文引用: 1]
DOI:10.1016/j.apenergy.2013.01.036URL [本文引用: 1]
DOI:10.11821/xb201009002URL [本文引用: 1]
Using energy consumption and land use data of each region of China in 2007, this paper established carbon emission and carbon footprint model based on energy consumption, and estimated the carbon emission amount of fossil energy and rural biomass energy of different regions of China in 2007. The main conclusions are as follows: (1) The total amount of carbon emission from energy consumption of China in 2007 was about 1.65 GtC, in which, the proportion of carbon emission from fossil energy was 89%. (2) Carbon emission intensity of industrial space of China in 2007 was 1.98 t/hm2, in which, carbon emission intensity of living & industrial-commercial space and of transportation industrial space was 55.16 t/hm2 and 49.65 t/hm2 respectively. (3) Carbon footprint caused by industrial activities of China in 2007 was 522.34×10⁶ hm2, which brought about ecological deficit of 28.69×10⁶ hm2. (4) The per unit area carbon footprint of industrial spaces in China was about 0.63 hm2/hm2 in 2007.
[本文引用: 1]
[本文引用: 1]
[本文引用: 1]
[本文引用: 1]
DOI:10.1016/S0301-4215(99)00018-XURL [本文引用: 1]
DOI:10.1016/0301-4215(93)90134-2URL [本文引用: 1]
DOI:10.1016/j.enpol.2003.10.023URL [本文引用: 1]
Abstract
This viewpoint proposes the definition: “Decarbonization refers to a decrease of CO2 emission intensity in a trend”. This viewpoint then argues that an analysis of decarbonization at national and global levels based on that definition would lead to the correct calculation of decarbonization.DOI:10.1016/j.ssresearch.2008.08.004URL [本文引用: 1]
Abstract
This research uses panel data (1989–2003) to examine the relationship between per capita carbon dioxide emissions and exports for 169 countries. Fixed effects regression results indicated that within country worldwide exports and United States exports are positively related to per capita carbon dioxide emissions. However, when both exports to the world and to the U.S. are examined simultaneously, only exports to the U.S. are related to carbon dioxide emissions. Additional analysis suggests that not all exports to the U.S. are responsible for the carbon-exports relationship. Specifically, the association between per capita carbon dioxide emissions and exports to the U.S. is largely the result of the oil and gas, petroleum and coal products, chemicals, and re-import industries. The data suggest consumption practices in the U.S. are partially responsible for elevated per capita carbon dioxide emissions in other nations, and that carbon dioxide trends in other nations are in part driven by U.S. demands for goods. These results also indicate that inefficient production methods among countries that export products to the United States may signal a problematic trend in global carbon dioxide emissions.DOI:10.1007/s11442-008-0387-8URL [本文引用: 1]
Anthropogenic greenhouse gases (GHG) emission and related global warming issues have been the focus of international communities for some time. The international communities have reached a consensus to reduce anthropogenic GHG emissions and restrain global warming. The quantitative assessment of anthropogenic GHG emissions is the scientific basis to find out the status of global GHG emission, identify the commitments of each country, and arrange the international efforts of GHG emission reduction. Currently the main assessment indicators for GHG emission include national indicator, per capita indicator, per GDP indicator, and international trade indicator etc. The introduction to the above indicators is put forward and their merits and demerits are analyzed. Based on the GHG emission data from the World Resource Institute (WRI), the US Energy Information Administration (EIA), and the Carbon Dioxide Information Analysis Center (CDIAC), the results of each indictor are calculated for the world, for the eight G8 industrialized countries (USA, UK, Canada, Japan, Germany, France, Italy and Russia), and the five major developing countries including China, Brazil, India, South Africa and Mexico. The paper points out that all these indicators have some limitations. The Indicator of Industrialized Accumulative Emission per Capita (IAEC) is put forward as the equitable indicator to evaluate the industrialized historical accumulative emission per capita of every country. IAEC indicator can reflect the economic achievement of GHG emission enjoyed by the current generations in every country and their commitments. The analysis of IAEC indicates that the historical accumulative emission per capita in industrialized countries such as UK and USA were typically higher than those of the world average and the developing countries. Emission indicator per capita per GDP, consumptive emission indicator and survival emission indicator are also put forward and discussed in the paper.
DOI:10.1016/S0301-4215(99)00084-1URL [本文引用: 1]
[本文引用: 3]
[本文引用: 3]
DOI:10.11820/dlkxjz.2015.02.004URL [本文引用: 1]
Climate change has in recent years become an environmental issue globally. Through deepening research into and analysis of the phenomenon, most climate scientists now identify greenhouse gases, most notably CO2 emissions, as constituting the main cause of global warming. Based on literature study and comparative analysis, this article discusses the progress of the research of CO2 emissions from a multidisciplinary perspective and analyzes the calculation methods, intensity, performance, influencing factors, and forecasting methods of CO2 emissions. This article also discusses the remaining issues and future directions of the research on CO2 emissions. Results indicate that the research of CO2 emissions has gained fruitful achievements and has experienced rapid development in recent years. CO2 emission is an integrated, complex, interdependent system engineering of numerous variables interplay between different factors. Under the framework of multidisciplinary integration, geographical and spatial factors have however received insufficient attention. Research scale has mainly focused on global and international levels, although recent studies have begun to highlight multi-scale research and pay attention to scale effect. Panel study of provincial and city scales is still scarce. Panel data are gradually receiving attention; however, dynamic analysis and comparative assessment still need improvement. Future research should focus on creating more detailed and comprehensive datasets, exploring multi-scale integrated research, and highlighting city scale analysis. Furthermore, future study should emphasize adapting theories to localized practices, employing systemic thinking and methods for differentiated trend research.
DOI:10.1504/IJGEI.2002.000941URL [本文引用: 1]
DOI:10.1016/j.eneco.2009.10.003URL [本文引用: 1]
[本文引用: 1]
DOI:10.3390/su9030451URL [本文引用: 1]
DOI:10.1007/s10479-009-0587-3URL [本文引用: 1]
Data Envelopment Analysis (DEA) models with undesirable inputs and outputs have been frequently discussed in DEA literature, e.g., via data transformation. These studies were scatted in the literature, and often confined to some particular applications. In this paper we present a systematic investigation on model building of DEA without transferring undesirable data. We first describe the disposability assumptions and a number of different performance measures in the presence of undesirable inputs and outputs, and then discuss different combinations of the disposability assumptions and the metrics. This approach leads to a unified presentation of several classes of DEA models with undesirable inputs and/or outputs.
[本文引用: 1]
[本文引用: 1]
DOI:10.1016/j.apenergy.2013.10.046URL [本文引用: 1]
[本文引用: 2]
[本文引用: 2]
DOI:10.1016/j.apenergy.2012.03.024URL [本文引用: 1]
This paper uses nonparametric efficiency analysis technique to estimate the energy efficiency, potential emission reductions and marginal abatement costs of energy-related CO2 emissions in China. We employ a non-radial slacks-based data envelopment analysis (DEA) model for estimating the potential reductions and efficiency of CO2 emissions for China. The dual model of the slacks-based DEA model is then used to estimate the marginal abatement costs of CO2 emissions. An empirical study based on China's panel data (2001-2010) is carried out and some policy implications are also discussed. (c) 2012 Elsevier Ltd.
[本文引用: 1]
[本文引用: 1]
DOI:10.15244/pjoes/76794URL [本文引用: 1]
[本文引用: 1]
DOI:10.1016/j.apenergy.2017.05.085URL [本文引用: 1]
DOI:10.11821/dlxb201803003URL [本文引用: 1]
Carbon emissions are increasing due to human activities related with the energy consumptions for economic development. Thus, attention has been paid to the reduction of the growth of carbon emissions and formulation of policies for addressing climate change. Although most studies have explored the driving forces behind carbon emissions in China, literature lacks studies at the city-level due to a limited availability of statistics on energy consumptions. In this study, based on China's city-level remote sensing carbon emissions from 1992 to 2013, we applied the spatial autocorrelation, spatial Markov-chain transitional matrices, dynamic spatial panel model and Sys-GMM to empirically estimate the key determinants of carbon emissions at the city-level and discuss its spatial spillover effects in consideration of spatiotemporal lag effects and different geographical and economic weighting matrices. Results indicated that the regional inequalities of city-level carbon emissions decreased over time and presented an obvious spatial spillover effect and high-emission "club" agglomeration. In addition, the evolution of the emission pattern has the characteristic of obvious path dependence. Panel data analysis results indicated that there was a significant U-shaped curve that can reflect the relationship between carbon emissions and GDP per capita. In addition, carbon emissions per capita are increasing with economic growth for most cities. High-proportion of secondary industry and extensive growth of investment exerted significantly positive effects on China's city-level carbon emissions. Conversely, rapid population agglomeration, the improvement of technology level, the increase of trade openness and road density play an inhibiting role in carbon emissions. Therefore, in order to reduce carbon emissions, the Chinese government should inhibit the effects of promotion factors and enhance the effects of mitigation factors. Combining with the analysis of results, we argued that optimizing the industrial structure, streamlining the extensive investment, increasing the level of technology and improving the road accessibility are the effective ways to increase energy savings and reduce carbon emissions in China.
DOI:10.1016/S0377-2217(99)00407-5URL [本文引用: 1]
In this paper, we will propose a slacks-based measure (SBM) of efficiency in Data Envelopment Analysis (DEA). This scalar measure deals directly with the input excesses and the output shortfalls of the decision making unit (DMU) concerned. It is units invariant and monotone decreasing with respect to input excess and output shortfall. Furthermore, this measure is determined only by consulting the reference-set of the DMU and is not affected by statistics over the whole data set. The new measure has a close connection with other measures proposed so far, e.g., Charnes–Cooper–Rhodes (CCR), Banker–Charnes–Cooper (BCC) and the Russell measure of efficiency. The dual side of this model can be interpreted as profit maximization, in contrast to the ratio maximization of the CCR model. Numerical experiments show its validity as an efficiency measurement tool and its compatibility with other measures of efficiency.
[本文引用: 1]
[本文引用: 1]
DOI:10.1016/j.ecolind.2017.12.011URL [本文引用: 1]
DOI:10.1016/j.scitotenv.2019.01.413URL [本文引用: 1]
[本文引用: 1]
[本文引用: 1]
DOI:10.1016/j.jclepro.2015.06.111URL [本文引用: 1]
[本文引用: 1]
DOI:10.1016/S0377-2217(01)00324-1URL [本文引用: 1]
In most models of Data Envelopment Analysis (DEA), the best performers have the full efficient status denoted by unity (or 100%), and, from experience, we know that usually plural Decision Making Units (DMUs) have this “efficient status”. To discriminate between these efficient DMUs is an interesting subject. This paper addresses this “super-efficiency” issue by using the slacks-based measure (SBM) of efficiency, which the author proposed in his previous paper [European Journal of Operational Research 130 (2001) 498]. The method differs from the traditional one based on the radial measure, e.g. Andersen and Petersen model, in that the former deals directly with slacks in inputs/outputs, while the latter does not take account of the existence of slacks. We will demonstrate the rationality of our approach by comparing it with the radial measure of super-efficiency. The proposed method will be particularly useful when the number of DMUs are small compared with the number of criteria employed for evaluation.
DOI:10.1177/0160017603262402URL [本文引用: 1]
DOI:10.1016/j.apgeog.2012.05.003URL [本文引用: 1]
DOI:10.1111/gean.2001.33.issue-3URL [本文引用: 1]
[本文引用: 2]
[本文引用: 2]
[本文引用: 1]
[本文引用: 1]
[本文引用: 1]
[本文引用: 1]
DOI:10.11821/dlxb201906005URL [本文引用: 1]
Since the Paris Climate Change Conference in 2015, reducing carbon emission and lowering carbon intensity has become a global consensus to deal with climate change. Due to different economic development stages, carbon intensity is regarded as a better index to measure regional energy-related carbon emissions. Although previous scholars have made great efforts to explore the spatiotemporal patterns and key driving factors of carbon intensity in China, the results lack the perspective from city level because of limited availability of statistical data of city-level carbon emission. In this study, based on carbon intensity of 283 cities in China from 1992-2013, we used the kernel density estimation, spatial autocorrelation, spatial Markov-chain and quantile regression panel model to empirically reveal its spatial spillover effects and explore the critical impact factors of carbon intensity at the city level. Our result indicates that although the total carbon emission increased during the study period, carbon intensity saw a gradual decline and regional differences were shrinking. Secondly, the city-level carbon intensity presented a strong spatial spillover effect and diverse regional backgrounds exerted heterogeneous effects on regions. Thirdly, quantile panel data analysis result showed that for low-intensity cities, on the one hand, FDI and transport sector were main contributing factors, and economic growth, technical progress and high population density negatively affected carbon intensity. On the other hand, industrial activity, extensive growth of investment and urban sprawl were key promoting factors for high-intensity cities, and population density was beneficial to emission reduction task. Furthermore, technological advance has not exerted negative influence on carbon intensity in high-intensity cities. At last, we suggested that Chinese government should take different carbon intensity levels into full consideration before policy making.
[本文引用: 1]
[本文引用: 1]
DOI:10.1016/j.apenergy.2016.10.052URL [本文引用: 1]
DOI:10.1016/j.scitotenv.2015.10.027URL [本文引用: 1]
