Variability of the event-based extreme precipitation in the south and north Qinling Mountains
LI Shuangshuang, WANG Chengbo, YAN Junping, LIU XianfengSchool of Geography and Tourism, Shaanxi Normal University, Xi'an 710119, China收稿日期:2019-03-18修回日期:2020-02-18网络出版日期:2020-05-25
| 基金资助: |
Received:2019-03-18Revised:2020-02-18Online:2020-05-25
| Fund supported: |
作者简介 About authors
李双双(1988-),男,陕西潼关人,博士,讲师,中国地理学会会员(S110011553M),研究方向为全球变化与区域灾害防治E-mail:lss40609010@126.com。

摘要
关键词:
Abstract
Keywords:
PDF (10013KB)元数据多维度评价相关文章导出EndNote|Ris|Bibtex收藏本文
本文引用格式
李双双, 汪成博, 延军平, 刘宪锋. 面向事件过程的秦岭南北极端降水时空变化特征. 地理学报[J], 2020, 75(5): 989-1007 doi:10.11821/dlxb202005008
LI Shuangshuang.
1 引言
全球变暖背景下,气温每升高1.0 ℃,大气持水能力大约增加7.0%,导致极端降水事件频率和强度增加[1,2,3]。同时,观测和气候模式模拟表明,人类活动也贡献了更多的极端降水,而且中纬度地区短历时、高强度的极端降水事件对变暖响应尤为明显[4,5,6]。加之城市道路硬化、前期排水管“快干快排”的设计,往往引发城市内涝,诱发流域洪水、泥石流等次生灾害,对社会发展和生态系统造成严重影响[7,8,9]。因此,科学家倡导5个行动路径适应气候变化风险[10],提出“扩大观测范围、理解气候相互作用、支持城市绿色转型”等6个优先研究领域[11]。其中,理清极端天气事件时空规律,对落实气候适应行动路径和优先研究计划,提高城市可持续发展能力具有重要的现实意义。秦岭位于中国东部季风区,是北亚热带和暖温带的分界线,位置与1月0 ℃等温线、800 mm等降水量线一致,是生态环境脆弱区,也是气候变化敏感区[12,13,14]。近年来,秦岭南北区域经济快速发展,宏观发展定位逐渐分化。具体而言,关中平原以“西咸一体化”为发展主导,利好的人才引进政策,使得大规模的人口集聚,加之区域产业转型升级,社会脆弱性和贫困人口空间结构也呈现新特征[15,16,17]。在此,以西安为例,2005年城镇化率为44.9%,2018年上升为74.0%,2019年全市常驻人口突破1000.0万[18]。快速人口聚集加剧了秦岭以北地区用水紧张问题,“引汉济渭、引红济石”等调水工程逐步实施,以缓解城市和工业缺水问题[19]。与此同时,2014年南水北调中线工程正式运行,汉江上游丹江口水库作为京津冀地区重要水源地,秦岭以南生态环境保护、水资源监测,也被提高到新的高度[20]。可见,秦岭以北快速城市化建设,秦岭以南生态环境保护,都面临“水安全”问题。极端降水增加,势必会影响区域社会—经济—生态的可持续发展。因此,关注秦岭南北极端降水变化规律,对构建区域综合风险防范体系具有重要的意义。
当前极端降水研究呈现新特征,即理清极端降水时空格局变化基础上,对极端降水指标的现象分析越来越少,对极端降水变化特征的解释分析越来越多;面向极端降水事件过程建模在增加,对模拟极端降水趋势的情景分析成为新的增长点[21,22,23,24,25,26,27,28,29]。其中,面向极端降水过程建模,细分极端降水类型,可弥补绝对或相对阈值判断降水量、频次和强度时空变化,忽略极端降水持续性、阶段性的不足,为分析极端降水对气候变暖响应提供了新的视角[29]。
基于此,本文利用1970—2017年秦岭南北72个站点气象数据,对4种极端降水事件类型(偏前型、偏后型、均衡型和单日型)时空特征进行分析,探讨不同区域、不同类型极端降水与区域增温的响应关系,以期为提高气候适应能力提供理论依据和方法参考。
2 研究区概况
秦岭西起甘肃迭山,东至河南伏牛山,东西长约800 km,北坡陡峻,南坡平缓,南北跨越近200 km,是中国南北地理重要的分界线[12]。研究范围选定涉及以下3个概念:秦岭山脉、秦岭山地和秦岭南北。其中,秦岭山脉是一个地貌学概念,指“大陆内部由山岭和山谷组成,并沿一定方向延伸的地理单元,以高耸狭长的地貌为特征”[30]。秦岭山地和秦岭南北,更侧重于人地关系视角,属于地理学关注的概念体系。秦岭山地是具有一定高度和坡度的自然综合体,是地质、地貌、气候、水文、土壤和植被等地方性自然地理要素的载体,是过去和现在人类活动综合影响的产物[31]。当前,由于人类不合理的生产和生活方式,引起秦岭山地资源和生态环境退化、山区经济贫困化等一系列可持续发展问题。因此,秦岭山地研究范围,不包括关中平原和汉江谷地,重点分析海拔导致垂直地带分异规律,探讨人类活动强度与山地环境的演化关系。
秦岭南北,是典型的区域地理概念。以中国北亚热带和暖温带环境响应差异为切入,侧重区域比较思维,核心观点为“抓住区域进行综合研究,深化地域分异规律认识”,研究范围界定更加关注人类活动[32]。因此,已有秦岭南北研究,不仅探讨秦岭过渡带的性质,也关注区域城市发展的环境效益,这也决定了研究范围不限于秦岭山脉或秦岭山地,还包括关中平原和汉江谷地。
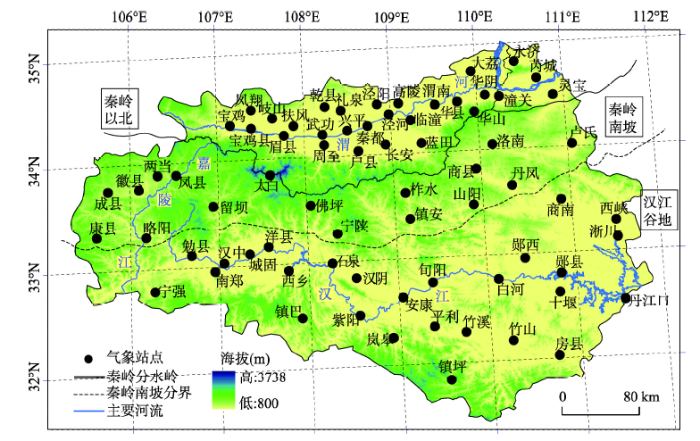
本文研究范围为秦岭南北,综合考虑气候、地形和人类活动等因素,以秦岭分水岭为分界,将研究区域分为:秦岭以北和秦岭以南。再从气候分析角度,以秦岭南麓1000 m等高线作为分界,将秦岭以南分为2个子区域:秦岭南坡和汉江谷地(图1)。这种分区方案既符合秦岭地区自然地域分异,也不会阻断秦岭南坡垂直自然规律,可有效反映暖温带、山地暖温度带、北亚热带的地带分异性。
图1
 新窗口打开|下载原图ZIP|生成PPT
图1秦岭南北地理环境与气象站点分布[12]
Fig. 1Geography and meteorological stations distribution in the south and north of Qinling Mountains
3 数据与方法
3.1 数据来源
本文1970—2017年秦岭南北72个气象站点逐日降水和气温数据,来源于中国国家级地面气象站基本气象要素日值数据集(V3.0)。为了保证数据完整性和连续性,将研究时段确定为1970—2017年。同时,查阅陕西省基层台站简史,宝鸡县气象站建站于1972年12月,2003年撤县建区后为陈仓区,宝鸡县气象站名留用[33]。因此,本文宝鸡县气象数据时间段为:1973年10月—2017年12月。值得一提的是,受气象站点迁移、资料遗失、建站时间等原因影响,城固、十堰和永济气象站数据为:1971年1月—2015年12月,其他站点数据具有完整性。3.2 研究方法
3.2.1 趋势分析 采用非参数化趋势度(Theil-Sen)方法,对秦岭南北不同极端降水事件变化趋势进行分析,通过Modified Mann-Kendall(MMK)进行趋势显著性检验,可避免线性回归受异常值干扰,提高极端降水趋势判断的准确性[34]。具体公式如下:式中:β为不同极端降水事件降雨量、频次或天数的趋势;ti和tj为时间序列;xi和xj分别为i和j时刻不同类型极端降水判断指标值。当β > 0时,表示该类型极端降水呈现增加趋势;反之,当β < 0时,表示该类型极端降水呈现下降趋势。MMK显著性统计值Z绝对值大于1.68,表示变化趋势通过0.10显著水平检验。
3.2.2 定义极端降水事件类型 极端降水峰值发生时间不同,致灾过程和效应也存在明显差异。借鉴已有研究,以面向事件过程为切入,类比地震发生序列,将极端降水事件分为4种类型,即偏前型、偏后型、均衡型和单日型[29]。具体定义如下:
① 偏前型:一次极端降水事件中,超过90.0%阈值的极端降水时刻分布在前半段,类似于地震时间序列中的“主震—余震”型。也就是说,前期为极端事件发生时段,后期降水强度明显减弱,且无极端降水事件发生。
② 偏后型:一次极端降水事件中,超过90.0%阈值的极端降水时刻,主要分布在后半段,类似于地震时间序列中的“前震—主震—余震”型。致灾过程如下:前期降水量偏少,后期遭遇极端降水事件打击,随后降雨量减少直至结束。
③ 均衡型:一次极端降水事件中,超过90.0%阈值的极端降水时刻,前后两阶段均有分布,与地震时间序列中的“双震型”或“多震型”相似,说明致灾过程具有多次性,区域面临灾害风险较大。
④ 单日型:与前3种类型不同,属于孤立型,即整个极端降水事件,仅发生在1天之内,类型于地震序列中,没有前震,也没有余震。
⑤ 其他型:类似于震群型,没有突出的主震(极端降水事件),能量释放以多次震级相近的地震释放。现实中,这种类型降水事件也比较常见,比如华西秋雨和江南梅雨等,没有极端降水发生,但持续时间较长。本文关注秦岭南北极端降水时空变化,并未涉及此事件类型。
基于上述定义,将秦岭南北极端降水类型判断流程细化如图2所示:
图2
 新窗口打开|下载原图ZIP|生成PPT
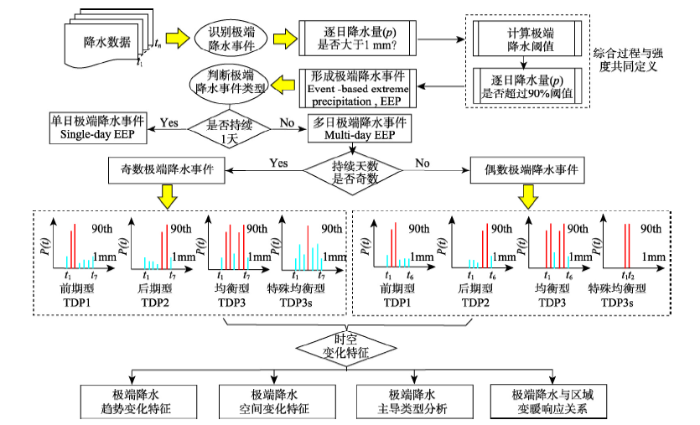
图2面向事件过程的极端降水事件定义与识别流程
Fig. 2Definition and identification process of the event-based extreme precipitation
① 识别极端降水事件。在站点尺度上,以逐日降水量是否大于1.0 mm为判断条件,形成降水序列;以逐日降水是否超过90.0%阈值为判断标准,形成极端降水序列。其中,1次极端降水事件,至少有1天降水不低于90.0%阈值,其他连续逐日降水量不低于1.0 mm。
② 判断极端降水类型。以单日或持续降水为判断条件,极端降水事件仅持续1天,为单日型极端降水事件;反之,为连续型极端降水事件。在持续型极端降水事件中,依据持续天数的奇数或偶数情况,可分为前期型、后期型、均衡型和特殊均衡型(图2)。
特殊均衡型包括2种情况:一是降水过程持续天数为奇数,仅有1天降水量超过90.0%阈值,且发生在中间奇数天;二是降水过程持续天数为偶数,有2天降水量超过90.0%阈值,呈中间两侧对称分布。考虑可行性,本文将偶数特殊均衡型直接归为均衡型,将奇数特殊均衡型细化。其中,前期降水量高于后期,归为前期型极端降水事件;反之,后期降水量高于前期,则归为后期型极端降水事件;前期和后期降水量相同,归为均衡型极端降水事件。
③ 时空变化特征分析。以趋势分析、相关分析和小波相干等方法为基础,从极端降水量、降水频次、降水日数和影响因素等4个维度,对4种极端降水事件时空变化特征进行分析。
3.2.3 降水插值方法 复杂山地环境中,利用ANUSPLIN方法可对气温和降水进行有效分析,减少常规插值方法受地形因素影响,造成部分统计误差[35]。利用澳大利亚****Hutchinson基于样条函数理论开发的ANUSPLIN软件,对秦岭南北降水平均态、不同极端降水类型累积降水频次、累积降水量进行空间插值,空间分辨率为90 m×90 m。
在插值结果验证方面,采用交叉验证(Cross-validation)的方法,对16个降水指标插值结果进行精度检验,具体指标包括:有效参数或拟合样条自由度(Signal)、剩余自由度(Error)、信噪比(Signal to noise ratio, SNR)、误差估计均方根(Root mean square error estimate, RTMSE)和噪音估计标准差(Estimate of the standard deviation of the noise in the spline model, RTVAR)。其中,SNR为Signal和Error的比值,其值越接近0,说明插值效果越好,且要求Signal小于站点数一半;同时,RTMSE值越小,且低于RTVAR,表明插值精度越高[36]。降水插值交叉验证结果如表1所示,16个插值结果均达到精度要求。
Tab. 1
表1
表1秦岭南北降水空间插值交叉验证结果
Tab. 1
| 类型 | 插值要素 | 有效参数 (Signal) | 剩余自由度 (Error) | 信噪比 (SNR) | 误差估计均方根 (RTMSE) | 噪音估计标准差 (RTVAR) |
|---|---|---|---|---|---|---|
| 降水量 平均态 | 1970—2000年 | 21.0 | 50.0 | 0.42 | 25.9 | 46.2 |
| 1980—2010年 | 22.7 | 48.3 | 0.45 | 26.2 | 45.6 | |
| 1990—2017年 | 18.1 | 52.9 | 0.36 | 24.0 | 47.6 | |
| 2008—2017年 | 18.9 | 52.1 | 0.38 | 28.1 | 54.5 | |
| 极端降水量平均态 | 1970—2000年 | 16.0 | 55.0 | 0.32 | 18.7 | 39.4 |
| 1980—2010年 | 18.8 | 52.2 | 0.38 | 19.5 | 38.0 | |
| 1990—2017年 | 17.4 | 53.6 | 0.35 | 19.8 | 40.0 | |
| 2008—2017年 | 14.9 | 56.1 | 0.30 | 23.9 | 52.1 | |
| 累积极端 降水频次 | 偏前型 | 11.2 | 59.8 | 0.22 | 0.0072 | 0.0182 |
| 偏后型 | 13.7 | 57.3 | 0.27 | 0.0061 | 0.0140 | |
| 均衡型 | 9.4 | 61.6 | 0.19 | 0.0054 | 0.0149 | |
| 单日型 | 11.1 | 59.9 | 0.22 | 0.0069 | 0.0174 | |
| 累积极端 降水量 | 偏前型 | 8.3 | 62.7 | 0.17 | 0.0073 | 0.0214 |
| 偏后型 | 12.7 | 58.3 | 0.25 | 0.0092 | 0.0217 | |
| 均衡型 | 10.6 | 60.4 | 0.21 | 0.0105 | 0.0272 | |
| 单日型 | 11.6 | 59.4 | 0.23 | 0.0041 | 0.0102 |
新窗口打开|下载CSV
值得一提的是,太白山海拔远高于其他站点,在ANUSPLIN插值过程将其剔除,有效站点数为71个。需要肯定的是,秦岭南坡800 mm雨量线年代波动,需要关注海拔因素的影响。但秦岭高海拔地区,观测资料相对较少,空间插值尚不能解决无资料的问题,未来需结合遥感和数值模拟方法,更加准确评估秦岭南北高海拔地区降水变化特征。
4 结果分析
4.1 秦岭南北降水呈现极端化
近年来中国东部“南涝北旱”的格局发生变化,北方地区也呈现“东干西湿”的变化趋势。受观测方式和数据来源不同,GRACE遥感数据显示,中国东部陆地水储量“南涝北旱”的格局并未发生变化[37]。本文发现,在站点尺度上秦岭南北降水和极端降水变化规律与全国大尺度降水格局响应具有一致性,也具有特殊性。具体规律可总结为:秦岭南北响应一致,近期降水量增加,降水日数下降,整体呈现极端化。(1)秦岭南北响应一致。对秦岭以北、秦岭南坡和汉江谷地降水量和极端降水量进行相关分析,秦岭以北和南坡降水量相关系数为0.86,高于汉江谷地相关系数0.70,也高于汉江谷地和南坡降水相关性0.84。同时,1997—2017年三者之间降水变化相关系数均有提升,秦岭以北、汉江谷地与南坡降水量之间相关系数分别为0.87、0.86,均高于秦岭以北与汉江谷地相关系数0.73。在降水日数变化方面,无论是极端降水,还是年降水,秦岭南北3个分区降水日数相关系数均高于0.91,相关性通过0.01显著水平检验。说明在降水趋势变化上,秦岭南坡的降水具有过渡性,与秦岭以北暖温带更为相似。同时,3个分区在降水日数变化一致性更强。
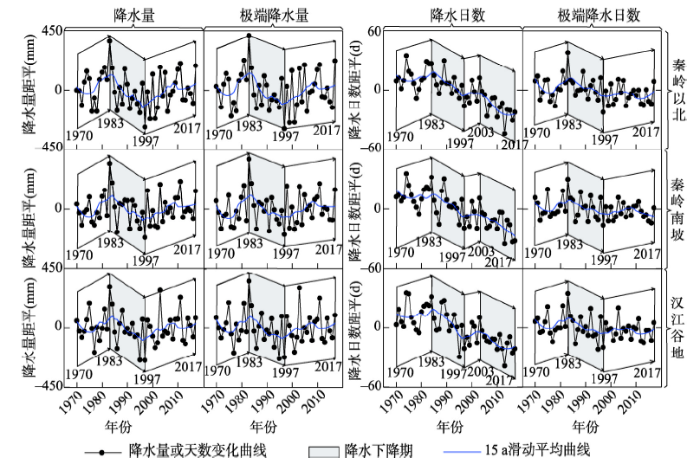
(2)近期降水量增加,降水日数减少,降水呈现极端化。利用15 a滑动平均曲线,滤除低频波动信息,秦岭南北降水和极端降水年代波动特征更为突出,具体变化过程可分为3个阶段:1970—1983年秦岭南北降水先减少后增加,在1983年达到峰值。查阅《陕西气象灾害大典》,1983年关中和陕南阴雨连绵,在7月27—31日,汉中、安康普降暴雨,局部大暴雨,造成严重的洪涝灾害,可佐证上述结论[38];1984—1997年秦岭南北气温快速上升,降水持续减少,区域气候呈现暖干化;1998—2017年秦岭南北降水由负距平转为正距平,极端降水呈现波动增加。
1970—2017年间秦岭南北降水日数变化可以分为2个阶段:1970—1984年降水日数多为正距平,降水呈现增加趋势;1985—2017年降水日数持续下降,可细分为3个阶段:1985—1997年快速下降期、1998—2003年短暂平稳波动期、2004—2017年持续下降期。以1997年为时间节点,前期极端降水日数与降水日数变化阶段相似,后期极端降水日数并未呈现出明显的下降趋势。说明在区域变暖停滞期,秦岭南北降水日数减少,是弱降水日数减少所致,非极端降水下降主导。
图3
 新窗口打开|下载原图ZIP|生成PPT
图31970—2017年秦岭南北年降水和极端降水变化特征
Fig. 3Variation of annual and extreme precipitation in the south and north of Qinling Mountains during 1970-2017
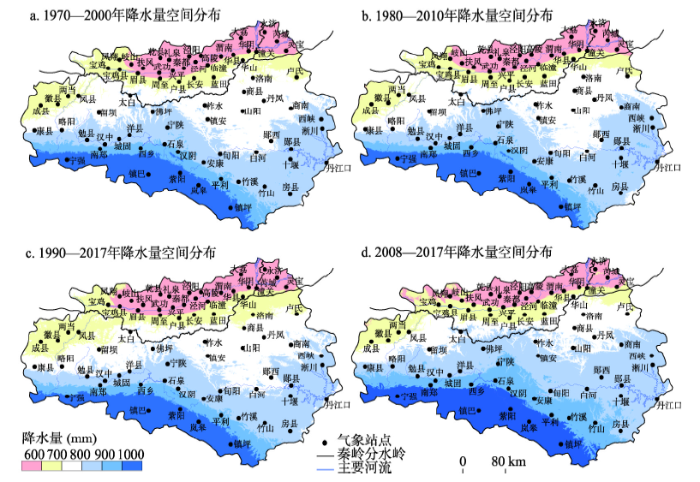
(3)秦岭南北降水量站点平均,易忽略空间格局的差异性。因此,利用空间插值方法对1970—2000年、1980—2010年、1990—2017年以及近10年(2008—2017年)区域典型等降水线控制面积变化进行分析(图4和表2)。结果表明:以30年为气候平均态,秦岭南北降水格局变化不大,以秦岭山脉为界,基本维持“南多北少”的空间格局。其中,800 mm等降水量线位于秦岭南坡,大致从西向东在“康县—略阳—留坝—洋县—宁陕—镇安—旬阳—郧西—商南”一线波动。但是,分析近10年降水格局发现,秦岭南北降水增加明显(图4d)。与1990—2017年相比,秦岭南北2008—2017年600~700 mm和700~800 mm等降水量线控制面积减少分别为3.9%(黄色底纹)和11.2%(白色底纹),900 mm以上区域面积占比增加17.3%,而秦岭以北< 600 mm降水量面积减少了2.2%(红色底纹)。在空间上,降水变化主要位于秦岭以南800~1000 mm过渡带。同时,极端降水空间变化与年降水相似,2008—2017年秦岭南北极端降水≥ 600 mm区域相比于1990—2017年由减少状态转为增加,再次佐证区域降水呈现增加的结论。
图4
 新窗口打开|下载原图ZIP|生成PPT
图41970—2017年秦岭南北降水格局变化特征
Fig. 4Change of precipitation pattern in the south and north of Qinling Mountains during 1970-2017
Tab.2
表2
表2秦岭南北典型等降水量线控制面积变化(%)
Tab.2
| 降水量 (mm) | 1970—2000年 | 1980—2010年 | 1990—2017年 | 2008—2017年 | |||||||
|---|---|---|---|---|---|---|---|---|---|---|---|
| 面积占比 | 变化率 | 面积占比 | 变化率 | 面积占比 | 变化率 | 面积占比 | 变化率 | ||||
| < 600 | 10.1 | - | 9.9 | -0.2 | 11.3 | 1.4 | 9.1 | -2.2 | |||
| 600~700 | 13.0 | - | 11.9 | -1.1 | 15.7 | 3.8 | 11.8 | -3.9 | |||
| 700~800 | 29.9 | - | 29.9 | 0.0 | 29.6 | -0.3 | 18.4 | -11.2 | |||
| 800~900 | 27.9 | - | 29.8 | 1.9 | 26.0 | -3.8 | 32.1 | 6.1 | |||
| 900~1000 | 7.6 | - | 7.3 | -0.3 | 6.8 | -0.4 | 13.5 | 6.6 | |||
| ≥ 1000 | 11.6 | - | 11.3 | -0.3 | 10.6 | -0.7 | 15.2 | 4.6 | |||
| 极端降水量 (mm) | 1970—2000年 | 1980—2010年 | 1990—2017年 | 2008—2017年 | |||||||
| 面积占比 | 变化率 | 面积占比 | 变化率 | 面积占比 | 变化率 | 面积占比 | 变化率 | ||||
| <400 | 8.3 | - | 7.4 | -0.9 | 9.0 | 1.6 | 5.9 | -3.1 | |||
| 400~500 | 13.4 | - | 11.6 | -1.8 | 15.6 | 4.0 | 15.0 | -0.6 | |||
| 500~600 | 38.4 | - | 37.3 | -1.2 | 42.8 | 5.6 | 23.4 | -19.4 | |||
| 600~700 | 24.2 | - | 28.2 | 4.0 | 18.8 | -9.4 | 34.2 | 15.4 | |||
| 700~800 | 7.6 | - | 7.3 | -0.3 | 6.8 | -0.5 | 10.8 | 4.0 | |||
| ≥ 800 | 8.1 | - | 8.3 | 0.1 | 7.0 | -1.3 | 10.7 | 3.7 | |||
新窗口打开|下载CSV
4.2 秦岭南北极端降水的主导类型
对比累积频次和累积降水量空间格局发现,秦岭南北极端降水类型具有复杂性,而非前期研究中以偏后型为主[29]。具体特征如下:① 全区尺度上,降水量和降水频次分析视角不同,秦岭南北极端降水主导类型判断存在差异。其中,从累积降水频次分析,秦岭南北各站点累积频次偏前型和偏后型占比分别为31.0%和30.5%,高于均衡型占比的26.3%,单日型极端降水事件发生相对较少(12.1%);从累积降水量分析,秦岭南北各站点极端降水类型则以均衡型为主导,占比为37.3%;② 分区视角上,无论是极端降水累积频次,还是累积降水量为判断标准,4种类型极端降水事件主导区域具有一致性。其中,偏前型主导区位于汉江谷地东部,以“柞水—镇安—旬阳—安康—紫阳”为界呈现东西分异,而秦岭以北、嘉陵江、汉中盆地、西乡盆地为偏前型分布偏少区;偏后型与偏前型格局相反,主导区为汉中盆地、秦岭以北,汉江谷地东部为偏后型分布偏少区;均衡型主导区为秦岭以南,自西南向东北逐渐减少,高值区在“大巴山—米仓山”一带,单日型主导区位于秦岭以北;③ 从空间离散程度分析,单日型和偏前型各站点累积频次占比标准差较大,其他类型标准差较小;对于累积降水量占比而言,均衡型标准差最大,单日型标准差最小。但是,所有指标标准差均小于0.04,说明秦岭南北4种极端降水空间分异是一种相对状态,区域整体以不同类型之间的空间差异为主导(图5)。图5
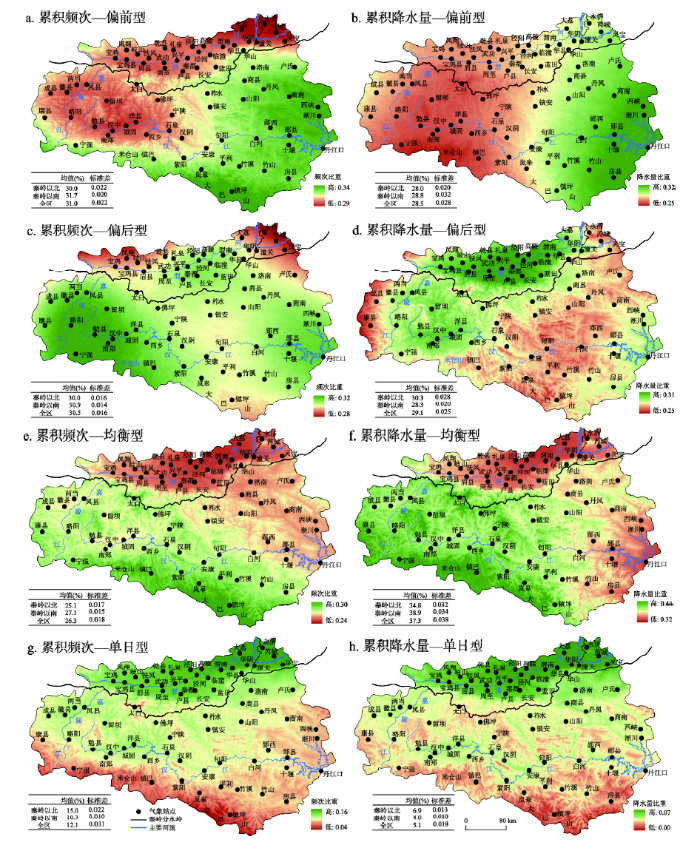 新窗口打开|下载原图ZIP|生成PPT
图5秦岭南北不同极端降水事件累积频次和降水量占比的空间特征
Fig. 5Spatial pattern of total frequencies and amount of the event-based extreme precipitation in the south and north of Qinling Mountains
前文分析可见,无论是极端降水量,还是极端降水频次作为衡量指标,秦岭南北极端降水事件主导类型中,单日型占比相对较低,偏前型、偏后型和均衡型占比大致相当。如直接借鉴前期研究,以4种极端降水类型最高占比为判断标准,识别极端降水主导类型,可能忽略降水类型的组合关系。
以临潼站为例,偏前型累积极端降水量占比为28.9%,偏后型和均衡型占比分别为32.5%和31.1%,单日型占比为7.6%。以类型最高占比为判断标准,临潼站极端降水类型为偏后型。但是均衡型与偏后型占比相差不多,以组合型定义区域极端降水主导类型更为合理。因此,以累积极端降水量和频次占比超过30.0%为标准,将极端降水主导类型由4种扩展为10种类型(图6)。
图6
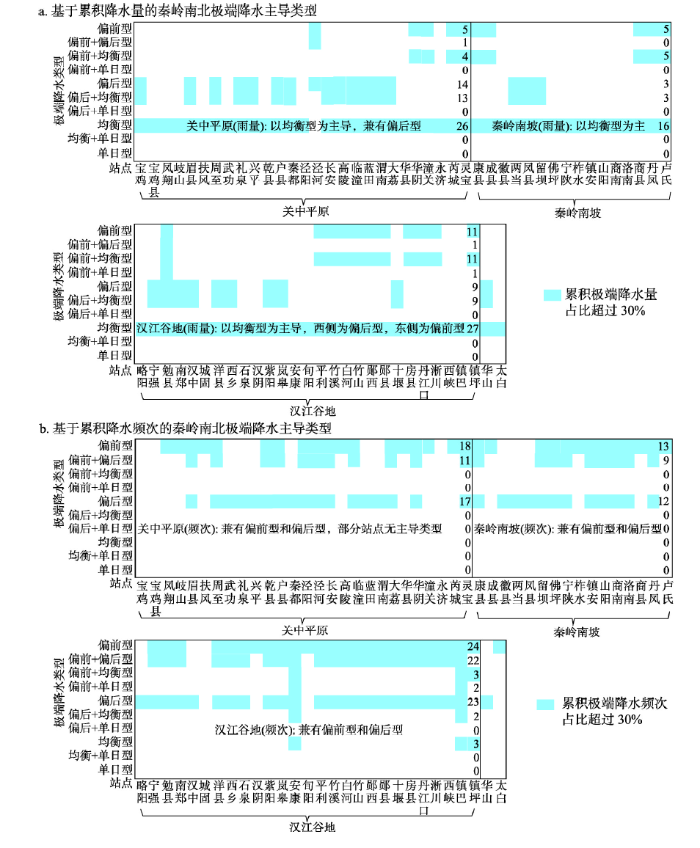 新窗口打开|下载原图ZIP|生成PPT
图6秦岭南北极端降水事件主导类型
注:图中数字为各极端降水事件主导类型站点数。
Fig. 6Dominant type of the event-based extreme precipitation in the south and north of Qinling Mountains
结果表明:① 从累积降水量分析,秦岭以北以均衡型极端降水事件为主导,兼有偏后型的性质;秦岭南坡极端降水类型组合关系较弱,为单一均衡型;汉江谷地西侧为“均衡型+偏后型”,东侧以“均衡型+偏前型”组合为主,说明汉江流域极端降水过程存在空间差异;② 从累积降水频次分析,秦岭南北极端降水主导类型中,偏前型与偏后型的站点数大致相当,汉江谷地“偏前型+偏后型”组合形态比较突出,这与Wu等分析中国东部季风区多以偏后型为主的结果略有差异[29]。
需要说明的是,受均衡型极端降水定义的影响,降水过程前后两段均需有降水量超过阈值,导致发生频次相对较低,而降水量相对较高。因此,以累积降水量为判断标准,极端降水主导类型多为均衡型;以累积频次为判断标准,均衡型主导的站点则相对较少;同时,除单日型极端降水之外,秦岭南北其他3种极端降水事件占比相近,多在30.0%左右波动,一方面说明区域极端降水事件具有均衡分布的特征,另一方面也佐证了累积降水量和累积降水频次两个角度分析主导类型的必要性。
4.3 秦岭南北不同类型极端降水变化趋势
1970—2017年秦岭南北4种极端降水类型、3个分区和3个指标组合36种关系,变化趋势以增加为主,可细分为2种类型:一是以显著增加为主,且集中于单日型极端降水,分布于秦岭以南地区;二是以波动变化为主(变化趋势并未通过0.10显著水平检验),秦岭南北多数站点趋势变化组合关系属于此类。说明秦岭南北不同类型极端降水事件呈现极端化趋势,但从长期趋势分析,极端降水增加依然属于年代波动,秦岭以南的亚热带地区偏前型和单日型极端降水日数和降水量增加的原因,还需要进一步分析。图7
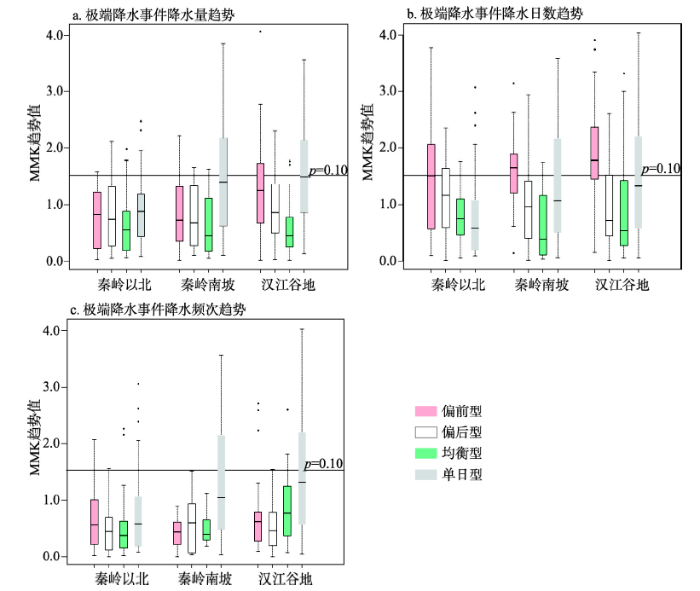 新窗口打开|下载原图ZIP|生成PPT
图7秦岭南北4种极端降水事件降水量和降水日数变化趋势
Fig. 7Trends in annual precipitation amount, frequency and days of the event-based extreme precipitation in the south and north of Qinling Mountains
4.4 秦岭南北不同类型极端降水对区域变暖的响应
全球变暖停滞下,中国1998—2012年气温变化率为-0.221 ℃/10a,相对中纬度其他地区减缓更明显[39]。秦岭南北气温在2003—2015年也经历增温停滞,并且南北响应方式存在差异[12]。利用灯光数据将秦岭南北气象站点分为城市站和乡村站,发现秦岭北麓增温幅度高于南麓,并且南北两侧城市化发展差异也加剧了气温变化的非均匀性[13]。秦岭南北气温响应的差异性,也体现在秦岭山地1月平均气温和1月0 ℃等温线变化,近50 a秦岭1月0 ℃等温线平均上升高度为143.7 m,107°E~109°E范围上升高度最为强烈,且高于秦岭山地东西段[14]。可以看出,秦岭南北气温变化既有年代差异,也有空间差异。气候模式模拟结果显示,世界季风区暴露在极端降水事件人口和区域呈现增加趋势,中国也面临极端干旱或暴雨灾害风险在增加[40,41,42,43,44]。在此,选取线性趋势相关和多时态小波相干两个角度,对秦岭南北不同类型极端降水对气温变化响应特征进行分析。4.4.1 线性趋势相关分析 线性趋势相关分析表明,秦岭南北3个分区4种类型极端降水对区域变暖响应明显。其中,偏前型、偏后型、均衡型极端降水量、降水日数、降水频次与气温呈现负相关,单日型极端降水指标呈现显著正相关。即当秦岭南北气温升高时,区域持续性极端降水事件呈现下降趋势,单日型极端降水事件呈现增加趋势,特别是汉江谷地偏前型和单日型所有极端降水指标、偏后型和均衡型降水日数与区域气温响应尤为明显,这也印证了全球变暖背景下,短历时极端降水增加速率的更快的结论。秦岭以北对气温响应特征主要体现在:偏前型、均衡型极端降水日数与气温变化呈现负相关,降水日数相关性高于降水量、降水频次;秦岭南坡与秦岭以北规律相似,不同的是秦岭南坡显著响应类型为偏前型和偏后型,均衡型降水响应关系相对较弱(表3)。
Tab. 3
表3
表3秦岭南北4种极端降水事件与气温变化相关性
Tab. 3
| 类型 | 指标 | 秦岭以北 | 秦岭南坡 | 汉江谷地 | |||||
|---|---|---|---|---|---|---|---|---|---|
| 相关系数 | 显著性 | 相关系数 | 显著性 | 相关系数 | 显著性 | ||||
| 偏前型 | 极端降水量 | -0.26 | 0.92 | -0.27 | 0.93 | -0.32 | 0.97 | ||
| 极端降水日数 | -0.47 | 1.00 | -0.46 | 1.00 | -0.57 | 1.00 | |||
| 极端降水频次 | -0.26 | 0.93 | -0.21 | 0.84 | -0.36 | 0.99 | |||
| 偏后型 | 极端降水量 | -0.16 | 0.72 | -0.10 | 0.49 | -0.28 | 0.94 | ||
| 极端降水日数 | -0.28 | 0.95 | -0.33 | 0.98 | -0.43 | 1.00 | |||
| 极端降水频次 | -0.12 | 0.57 | 0.11 | 0.53 | -0.06 | 0.32 | |||
| 均衡型 | 极端降水量 | -0.26 | 0.93 | -0.13 | 0.63 | -0.25 | 0.91 | ||
| 极端降水日数 | -0.34 | 0.98 | -0.23 | 0.89 | -0.37 | 0.99 | |||
| 极端降水频次 | -0.11 | 0.55 | 0.04 | 0.20 | -0.15 | 0.71 | |||
| 单日型 | 极端降水量 | 0.41 | 1.00 | 0.45 | 1.00 | 0.52 | 1.00 | ||
| 极端降水日数 | 0.36 | 0.99 | 0.43 | 1.00 | 0.54 | 1.00 | |||
| 极端降水频次 | 0.36 | 0.99 | 0.43 | 1.00 | 0.54 | 1.00 | |||
新窗口打开|下载CSV
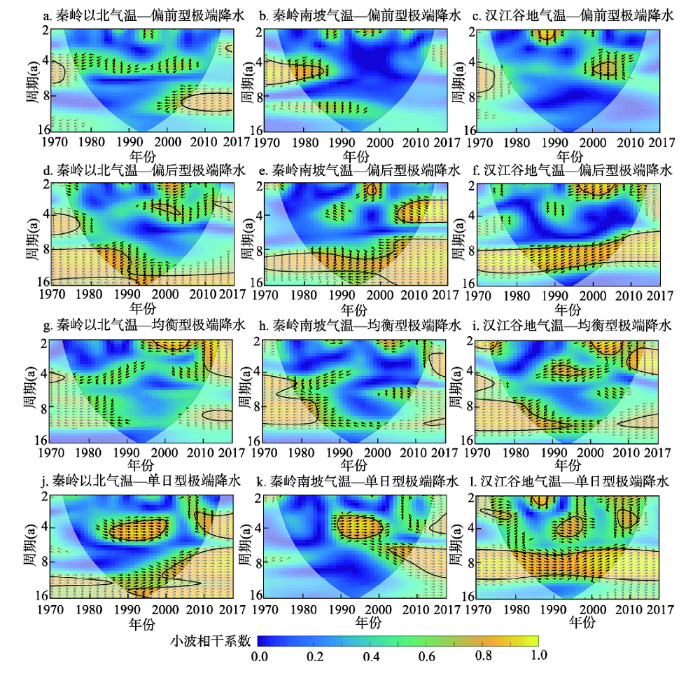
4.4.2 小波相干“多尺度、非线性”分析 秦岭南北3个分区4种极端降水事件与相应气温变化的小波相干分析结果(图8)表明:① 秦岭南北4种极端降水与区域气温小波相干分析结果,印证了前文分析结论,即偏前型、偏后型、均衡型极端降水量与气温变化呈现负相关,单日型极端降水量与气温变化呈现正相关,汉江谷地是气温响应变化的关键区域;② 极端降水对气温变化响应关系存在周期性和阶段性。以秦岭以北为例,偏前型极端降水与气温响应显著负相关时段为:20世纪70年代初,相关周期为4~6 a。尽管上述短周期负相关持续到20世纪90年代末,但两者相关显著性逐渐降低;到21世纪初,偏前型极端降水对气温响应增强,负相关也由短周期向8~12 a中长周期转变。也就是说,相对于1970—2017年,秦岭以北快速增温趋势(T = 0.33 ℃/10a,R2 = 0.514),1998—2017年气温增速有所减缓(T = 0.25 ℃/10a,R2 = 0.108),在2006—2012年呈现出下降趋势(T = -0.25 ℃/10a,R2 = 0.722),即2006—2012年秦岭以北地区偏前型极端降水在逐年增加;③ 汉江谷地偏后型、单日型极端降水与气温响应关系在8~12 a尺度上呈现全时域高度相关。说明在年际变化上,汉江谷地气温上升,单日型极端降水呈现显著增加,偏后型极端降水显著减少,且两者相关关系具有全时域性。
图8
 新窗口打开|下载原图ZIP|生成PPT
图8不同类型极端降水事件与秦岭南北气温的小波相干分析
注:小波相干系数越大表明两者相关性越高。“→”表示两者同相位变化(正相关);“←”表示两者反相位变化(负相关);“↑”表示极端降水变化超前气温变化;“↓”表示极端降水变化滞后气温变化;黑色实线表示相关性通过0.05显著性检验。
Fig. 8Wavelet coherence analysis between temperature and extreme precipitation in the south and north of Qinling Mountains
综上所述,秦岭南北极端降水与气温变化关系密切,汉江谷地是区域气温响应的关键区和敏感区。值得一提的是,2000年后,秦岭南北全区单日型、秦岭以北偏前型和均衡型、秦岭南坡偏后型、汉江谷地均衡型极端降水对气温变化响应关系逐渐增强。以2012年为时间节点,1998—2012年秦岭南北气温下降,2012年气温回升,对应的区域极端降水响应规律如下:秦岭南北单日型、短历时、高强度的极端降水在增加,持续性极端降水在减少,而后者空间响应具有差异性。其中,秦岭以北持续性极端降水响应类型为:偏前型和均衡型,秦岭南坡响应密切的为偏后型,汉江谷地为均衡型和偏后型。
5 结论与展望
面向极端降水过程,利用1970—2017年72个气象站点实测逐日气温和降水数据,本文分析了秦岭南北地区降水极端化的背景,并从降水量、降水日数和降水频次3个维度,对4种极端降水事件类型时空变化进行分析,探讨了不同区域、不同类型极端降水与区域增温的响应关系。得到结论如下:(1)秦岭南北降水变化趋于极端化。从长期气候分析,秦岭南北降水格局稳定,以秦岭山脉为界,基本维持“南多北少”的空间格局,800 mm等降水量线位于秦岭南坡,大致在“康县—略阳—留坝—洋县—宁陕—镇安—旬阳—郧西—商南”一线波动。同时,秦岭南北3个分区降水变化空间响应具有一致性,共同呈现出“降水以波动变化为主,近期降水量增加,降水日数下降,整体呈现极端化”的特征。
(2)极端降水主导类型呈南北分异。无论是累积降水量,还是累积降水频次作为衡量指标,秦岭南北极端降水事件主导类型中,单日型占比相对较低,偏前型、偏后型和均衡型占比大致相当。在空间上,从累积极端降水量分析,秦岭以北以均衡型为主,兼有偏后型的性质;秦岭南坡类型组合关系较弱,为单一均衡型,汉江谷地西侧为“均衡型+偏后型”,东侧为“均衡型+偏前型”组合;从累积极端降水频次分析,秦岭南北主导类型为偏前型,其次是偏后型,汉江谷地“偏前型+偏后型”组合形态比较突出。
(3)极端降水与区域变暖关系密切。当秦岭南北气温升高时,区域持续性极端降水事件呈现下降趋势,单日型极端降水事件呈现增加趋势。近期秦岭南北单日型、短历时、高强度的极端降水事件呈现增加趋势,秦岭以北地区偏前型和均衡型极端降水事件在减少,秦岭南坡响应密切的为偏后型,汉江谷地为均衡型和偏后型。
面向极端降水过程分析,关注极端降水对区域气候变暖的响应,精细化极端降水致灾过程,未来还有需要工作值得探索。
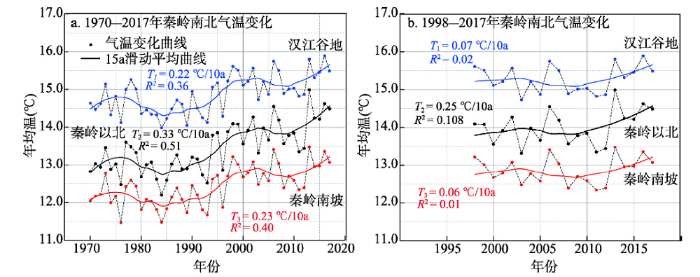
(1)气温变化与极端降水响应关系。1970—2015年秦岭南北气温变化呈现出“非平稳、非线性、阶梯状”的增温过程,3个分区气温变化具有明显的同步性[12]。1998—2012年区域变暖停滞后,近期气温再次呈现增加趋势,这意味着未来一段时间内秦岭南北单日型极端降水事件依然会增加,持续性极端降水事件可能减少(图9)。但是,这种极端降水事件和气温变化的响应关系内在机理和大气动力学过程是什么,还需要进一步研究。与此同时,全球变暖与极端降水变化具有复杂性,未来需要关注天内(sub-daily precipitation)极端降水变化,精细化面向过程的极端降水类型昼夜变化差异,在高时间分辨率尺度下,再认识秦岭南北气温变化与极端降水的响应关系。
图9
 新窗口打开|下载原图ZIP|生成PPT
图9秦岭南北长期趋势和变暖停滞期气温变化特征
Fig. 9Variation of temperature in the south and north of Qinling Mountains during 1970-2017 and warming hiatus
(2)极端降水事件类型方法的细化。与相对阈值和绝对阈值极端降水指标相比,面向过程的极端降水事件分析,为精细化研究极端降水时空变化特征以及影响因素提供了新的思路[29]。值得一提的是,以时间序列中间时刻为分割标准,以极端降水事件位置为判断条件,划分偏前型、偏后型、均衡型和单日型极端降水事件。其中,偏前型、偏后型和单日型概念相对清晰,均衡型降水指代内容更丰富,未来需要结合前后两阶段中降水量多少,再细化均衡型降水类型为偏前型、偏后型和均衡型。同时,要关注没有达到极端降水事件,构建模型分析长时间、低强度降水事件变化特征。
(3)大气环流异常对极端降水影响。秦岭南北位于东亚季风区,具有气候南北分界意义[45,46,47]。东亚夏季风强弱变化,对中国南北过渡带极端降水变化具有重要的影响[48]。在空间遥相关角度,赤道太平洋海温异常变化,与之相应的厄尔尼诺和拉尼娜事件,具有2~7年周期性,对中国极端降水变化具有重要的影响[49]。在未来研究中,需要结合东亚季风、ENSO事件以及北大西洋涛动等环流指数,综合分析秦岭南北不同极端降水类型时空变化特征,解释极端降水对区域变暖响应的周期性和年代变化。
(4)不同类型极端降水的风险管理。类似于地震灾害,不同类型极端降水具有不同的致灾过程。需要结合城市调洪蓄水用地面积,利用城市洪涝淹没模型,分析不同类型极端降水对秦岭南北典型城市雨洪安全格局的影响[7]。同时,自然灾害致灾过程具有复杂性,需要关注多灾种事件,分析极端降水导致的灾害链和灾害遭遇,如极端降水—滑坡(泥石流)—堰塞湖—洪水等,构建模型刻画多灾种群聚群发特征,为落实气候适应行动路径,提供城市恢复力和适应能力提供理论基础[50,51,52]。
(5)面向过程极端降水的方法启示。已有极端降水对区域变暖的研究,往往两者响应关系不显著或存在不确定性。统计学经典的“辛普森悖论”揭示,特定条件下分组讨论满足的结论,一旦合并考虑,就出现相反的结论[53]。本研究中,以气候或地域分异规律为基础,将秦岭南北进行区域细化,以面向过程的极端降水方法为基础,再将极端降水事件变化过程细化,可从新的视角验证中国南北过渡带极端降水对气候变暖响应的规律。因此,将区域尺度的细化,极端气候事件的细分,分析极端降水对全球变暖响应是否存在“辛普森悖论”,其对未来研究方法完善和研究思路设计具有启示性。
致谢:
感谢清华大学公共管理学院孔锋博士提供的数据支持。参考文献 原文顺序
文献年度倒序
文中引用次数倒序
被引期刊影响因子
[本文引用: 1]
[本文引用: 1]
[本文引用: 1]
[本文引用: 1]
[本文引用: 1]
[本文引用: 1]
[本文引用: 2]
[本文引用: 2]
[本文引用: 1]
[本文引用: 1]
[本文引用: 1]
[本文引用: 1]
[本文引用: 1]
[本文引用: 5]
[本文引用: 5]
[本文引用: 2]
[本文引用: 2]
[本文引用: 2]
[本文引用: 2]
[本文引用: 1]
[本文引用: 1]
[本文引用: 1]
[本文引用: 1]
[本文引用: 1]
[本文引用: 1]
,
URL [本文引用: 1]
,
URL [本文引用: 1]
[本文引用: 1]
[本文引用: 1]
[本文引用: 1]
[本文引用: 1]
[本文引用: 1]
[本文引用: 1]
[本文引用: 1]
[本文引用: 1]
[本文引用: 1]
[本文引用: 1]
[本文引用: 1]
[本文引用: 1]
[本文引用: 6]
[本文引用: 1]
[本文引用: 1]
[本文引用: 1]
[本文引用: 1]
[本文引用: 1]
[本文引用: 1]
[本文引用: 1]
[本文引用: 1]
[本文引用: 1]
[本文引用: 1]
[本文引用: 1]
[本文引用: 1]
[本文引用: 1]
[本文引用: 1]
[本文引用: 1]
[本文引用: 1]
[本文引用: 1]
[本文引用: 1]
[本文引用: 1]
[本文引用: 1]
[本文引用: 1]
[本文引用: 1]
[本文引用: 1]
[本文引用: 1]
[本文引用: 1]
[本文引用: 1]
DOI:10.18306/dlkxjz.2019.03.001URL [本文引用: 1]

Since the Qinling-Huaihe line was delimited as the boundary between north and south China in 1958, discussions on the local position of the line, criteria for dividing temperature zones, the line's environmental effect, among others, are ongoing. The National Basic Resources Investigation Program "Integrated Scientific Investigation of the North-South Transitional Zone" launched in 2017, introduced the concept of north-south transitional zone (Qinling-Daba Mountains) and planned to explore the north-south dividing line from the perspective of transitional zone, so as to strengthen and make some breakthroughs in the study of the north-south division. The Qinling-Daba Mountains are the main body of China's north-south transitional zone, with multi-dimensional zonal structures and high degree of environmental complexity, biological diversity, and climatic sensitivity. The following 10 scientific issues need to be dealt with in the years to come: 1) The relationship between the north-south dividing line and the north-south transitional zone; 2) improvement of criteria for identifying subtropical and warm-temperate zones; 3) integral north-south series and variation of vegetation and soil types; 4) relationship between global warming and spatial change of key bioclimatic criteria; 5) decomposition and integration of multi-dimensional zonal structures in the Qinling-Daba Mountains; 6) pattern and mechanism of biological diversity and endemics; 7) the corridor effect of the Qinling-Daba Mountains; 8) regional environmental effect of the Qinling-Daba Mountains and implications for the national ecological security; 9) significance and position of the Qinling-Daba Mountains for the history and development of China; and 10) significance of the geographic structure of Western Qinling Mountains for the origin of the Chinese civilization. These key issues are not only the results of previous research, but also the starting point for further exploration and study in the future. They are intended to inspire and encourage an in-depth study of China's north-south dividing line or transitional zone, and to provide new perspectives and framework for the exploration of physio-geographic theories, biodiversity, and ecological security, and even the birthplace of the earliest Chinese civilization.
DOI:10.18306/dlkxjz.2019.03.001URL [本文引用: 1]
Since the Qinling-Huaihe line was delimited as the boundary between north and south China in 1958, discussions on the local position of the line, criteria for dividing temperature zones, the line's environmental effect, among others, are ongoing. The National Basic Resources Investigation Program "Integrated Scientific Investigation of the North-South Transitional Zone" launched in 2017, introduced the concept of north-south transitional zone (Qinling-Daba Mountains) and planned to explore the north-south dividing line from the perspective of transitional zone, so as to strengthen and make some breakthroughs in the study of the north-south division. The Qinling-Daba Mountains are the main body of China's north-south transitional zone, with multi-dimensional zonal structures and high degree of environmental complexity, biological diversity, and climatic sensitivity. The following 10 scientific issues need to be dealt with in the years to come: 1) The relationship between the north-south dividing line and the north-south transitional zone; 2) improvement of criteria for identifying subtropical and warm-temperate zones; 3) integral north-south series and variation of vegetation and soil types; 4) relationship between global warming and spatial change of key bioclimatic criteria; 5) decomposition and integration of multi-dimensional zonal structures in the Qinling-Daba Mountains; 6) pattern and mechanism of biological diversity and endemics; 7) the corridor effect of the Qinling-Daba Mountains; 8) regional environmental effect of the Qinling-Daba Mountains and implications for the national ecological security; 9) significance and position of the Qinling-Daba Mountains for the history and development of China; and 10) significance of the geographic structure of Western Qinling Mountains for the origin of the Chinese civilization. These key issues are not only the results of previous research, but also the starting point for further exploration and study in the future. They are intended to inspire and encourage an in-depth study of China's north-south dividing line or transitional zone, and to provide new perspectives and framework for the exploration of physio-geographic theories, biodiversity, and ecological security, and even the birthplace of the earliest Chinese civilization.
DOI:10.3878/j.issn.1006-9895.1712.17261URL [本文引用: 1]
The present paper has reanalyzed and reassessed the basic characteristics, the driving forces and the inter-decadal variability of the East Asian summer monsoon with new-inputs of data and research findings. It includes four parts:(1) the basic characteristic features and properties of the East Asian summer monsoon; (2) the driving forces of the East Asian summer monsoon; (3) the inter-decadal variability of the East Asian summer monsoon, and (4) the association of the East Asian monsoon with the global monsoon. The results obtained here have shown that the East Asian summer monsoon is an important and integrated part of the Asian summer monsoon system, with the monsoonal airflow of tropical origin. It is the main circulation and precipitation system in summer to shape the weather and climate in East Asia. The main forces that drive the East Asian summer monsoon consist of three kinds:external forcing, coupled forcing and internal variability. Among them, the anthropogenic external forcing (e.g., greenhouse gas, urbanization effect, and aerosols), which is an emerging driving force, is changing the properties and evolution trend of the East Asian summer monsoon. As a nature factor, the coupled forcing of oceanic and land-surface processes is the main cause of the inter-decadal variability of the East Asian summer monsoon. The coordinated effect of the Pacific Decadal Oscillation (PDO) and the Atlantic Multi-decadal Oscillation (AMO) is the dominant forcing for the 30-40 year period. Since the 1960s, the East Asian summer monsoon has experienced a strong?weak?strong inter-decadal scale evolution, along with the PDO and AMO. Correspondingly, the precipitation pattern in East China has also shifted from the "North flooding and South drought" pattern to the "North drought and South flooding" pattern with increasing precipitation in North China in the recent decade. Actually, this inter-decadal variation is consistent with the change of the Afro-Asian summer monsoon system. In the present century, influenced by increasing climate warming, the summer monsoon precipitation belt will continue to advance northward, and therefore northern and western China will have persistent above-normal precipitation scenarios. Finally, it is indicated that the Afro-Asian summer monsoon is well corresponding to the concept of the global monsoon compared to other regional monsoons worldwide.
[本文引用: 1]
[本文引用: 1]
[本文引用: 1]
[本文引用: 1]
[本文引用: 1]
[本文引用: 1]
[本文引用: 1]
[本文引用: 1]
