杨中文2,
宋进喜1,,,
郝彩莲2,
夏瑞2,
贾蕊宁2,
陈焰2,
张晓娇2
1.西北大学城市与环境学院/陕西省地表系统与环境承载力重点实验室 西安 710127
2.中国环境科学研究院/水生态保护与修复研究室 北京 100012
基金项目: 中国科学院战略性先导科技专项XDA20040302
详细信息
作者简介:马驰, 研究方向为水文水资源。E-mail: chima@stumail.nwu.edu.cn
通讯作者:宋进喜, 主要研究方向为河流水文与水生态。E-mail: jinxisong@nwu.edu.cn
中图分类号:F326.11;F323.213计量
文章访问数:333
HTML全文浏览量:31
PDF下载量:104
被引次数:0
出版历程
收稿日期:2020-06-01
录用日期:2020-09-06
刊出日期:2021-02-01
Characteristics of crop water footprint changes in five Central Asian countries from 1992 to 2017
MA Chi1, 2,,YANG Zhongwen2,
SONG Jinxi1,,,
HAO Cailian2,
XIA Rui2,
JIA Ruining2,
CHEN Yan2,
ZHANG Xiaojiao2
1. Shaanxi Key Laboratory of Earth Surface System and Environmental Carrying Capacity/College of Urban and Environmental Sciences, Northwest University, Xi'an 710127, China
2. State Key Laboratory of Environment Criteria and Risk Assessment, Chinese Research Academy of Environmental Sciences, Beijing 100012, China
Funds: the Strategic Priority Research Program of Chinese Academy of SciencesXDA20040302
More Information
Corresponding author:SONG Jinxi, E-mail: jinxisong@nwu.edu.cn
摘要
HTML全文
图
参考文献
相关文章
施引文献
资源附件
访问统计
摘要
摘要:本研究以中亚五国为研究区域,以农作物水足迹为评估手段,分析了1992-2017年间中亚五国农作物水足迹的时空变化特征,以揭示中亚五国农作物水足迹结构,厘清引起中亚五国水足迹变化的主要农作物的贡献。结果表明:1)中亚五国农作物水足迹时间变化特征明显,1992-2017年中亚五国农作物绿水足迹(-9.7×10⁹ m3)和蓝水足迹(-5.6×10⁹ m3)均趋于减少。中亚五国农作物水足迹空间分布差异显著,哈萨克斯坦农作物绿色水足迹最高(平均4.96×10¹⁰ m3),且远高于其他4国(平均3.6×10⁹ m3),而蓝水足迹以乌兹别克斯坦最高(平均1.53×10¹⁰ m3)。农作物绿水足迹和蓝水足迹增长率最大的国家分别是土库曼斯坦(87.6%)和吉尔吉斯斯坦(32.3%);绿、蓝水足迹减少率最大的国家分别是哈萨克斯坦(-20.7%)和乌兹别克斯坦(-24.2%)。2)中亚地区农作物绿水足迹主要以粮食作物为主,蓝水足迹以粮食作物和油料纤维作物为主;而粮食作物水足迹结构中,主要以小麦、水稻和玉米为主,油料纤维作物水足迹结构中,主要以棉花为主。3)哈萨克斯坦作为绿水足迹减少最多的国家,大麦(51.6%)和小麦(28.2%)的贡献最大;乌兹别克斯坦作为蓝水足迹减少最多的国家,棉花(61.9%)贡献最大。通过开展中亚地区的农作物水足迹研究,发现中亚农作物水足迹整体呈下降趋势,厘清了中亚地区引起水足迹下降的主要农作物种类,相关成果可以为中亚地区的农作物优化种植和水资源节约提供支撑。
关键词:中亚五国/
农作物/
水足迹/
绿水足迹/
蓝水足迹
Abstract:This study analyzed the spatio-temporal characteristic of crop water footprint in five Central Asian countries from 1992 to 2017 using the crop water footprint as the assessment method, in order to reveal the structure of crop water footprint, and clarify the contribution of main crops that caused the change of water footprint in the five Central Asian countries. The results showed variation in the crop water footprints of these five Central Asian countries. From 1992 to 2017, changes in green water footprints were similar to those in their respective planting areas, and the overall trend was decreasing (-9.7×10⁹ m3). The overall blue water footprint also tended to decrease (-5.6×10⁹ m3). There were significant differences in the spatial distribution of crop water footprints in the five Central Asian countries. Kazakhstan had the highest green water footprint (average 49.6×10⁹ m3), much higher than the other four countries (average 3.6×10⁹ m3). Uzbekistan had the highest blue water footprint (average 15.3×10⁹ m3). From 1992 to 2017, the countries with the largest growth rates in the green and blue water footprints of crops were Turkmenistan (87.6%) and Kyrgyzstan (32.3%). The countries with the largest reduction rates in the green and blue water footprints were Kazakhstan (-20.7%) and Uzbekistan (-24.2%). The green water footprint of crops in Central Asia was mainly from cereals, and the blue water footprint was mainly from cereals and oil crops. The water footprint structure of cereals was mainly composed of wheat, rice, and corn, and the water footprint structure of oil crops was mainly composed of cotton. Kazakhstan had the largest reduction in green water footprint and accounted for most of crops with reduced green water footprint, barley (51.6%) and wheat (28.2%). Uzbekistan had the largest reduction in blue water footprint, with cotton (61.9%) contributing the most. The aim of this study was to examine the impact of crop yield on the virtual water content of crops and expand the virtual water content of dozens of crops in these five Central Asian countries. This avoids the shortcomings of inaccurate calculations of the long-term water footprint series in previous studies where the virtual water content remains unchanged. Research on the water footprint of crops in Central Asia revealed that the water footprint was declining, and the main crops causing the water footprint declines had been identified. These results can be used to optimize crop planting and water conservation in Central Asia.
Key words:Five Central Asian countries/
Crops/
Water footprint/
Green water footprint/
Blue water footprint
HTML全文
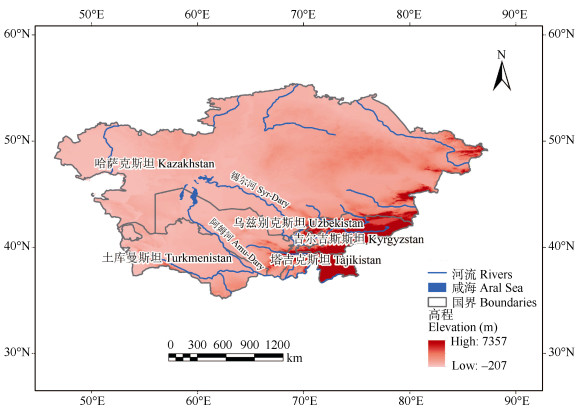
图1中亚五国地理位置
Figure1.Geographic location of the five Central Asian countries
 下载: 全尺寸图片幻灯片
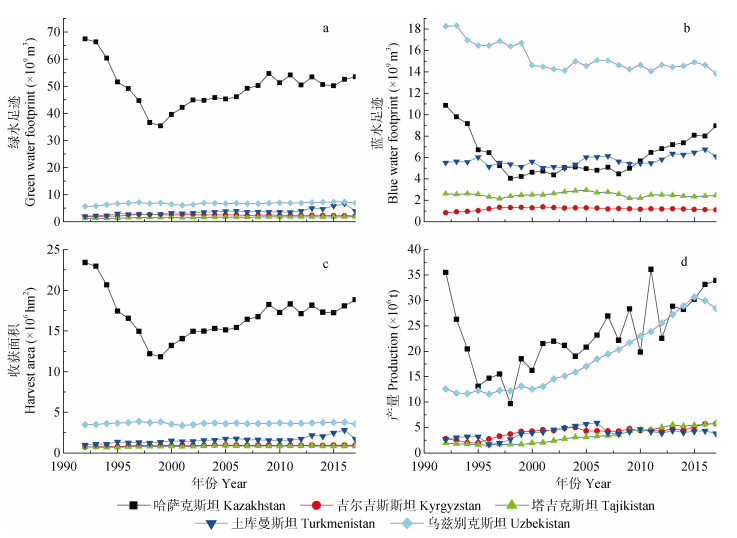
图2中亚五国作物水足迹、作物产量、收获面积时间变化(a: 绿水足迹; b: 蓝水足迹; c: 作物收获面积; d: 作物产量)
Figure2.Time changes of crop water footprint, production and harvest area in five Central Asian countries (a: green water footprint; b: blue water footprint; c: crop harvested area; d: crop yields)
下载: 全尺寸图片幻灯片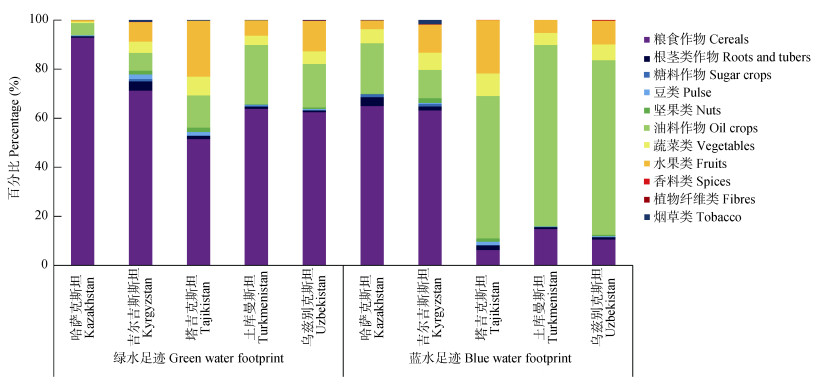
图3中亚五国农作物水足迹结构
Figure3.Crops water footprint structures of five Central Asian countries
下载: 全尺寸图片幻灯片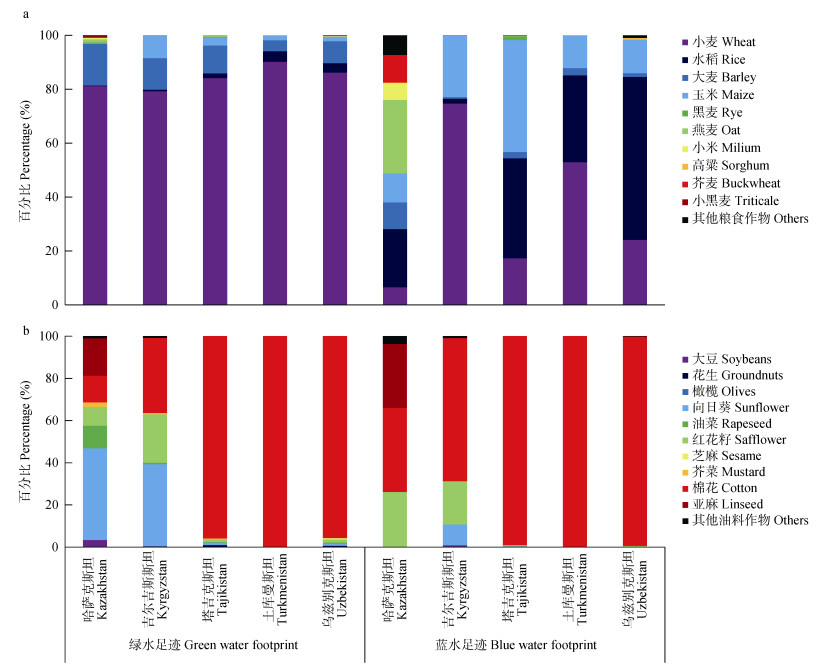
图4中亚五国粮食作物(a)和油料作物(b)的绿水足迹和蓝水足迹结构
Figure4.Structure of green and blue water footprints of food crops (a) and oil crops (b) in the five Central Asian countries
下载: 全尺寸图片幻灯片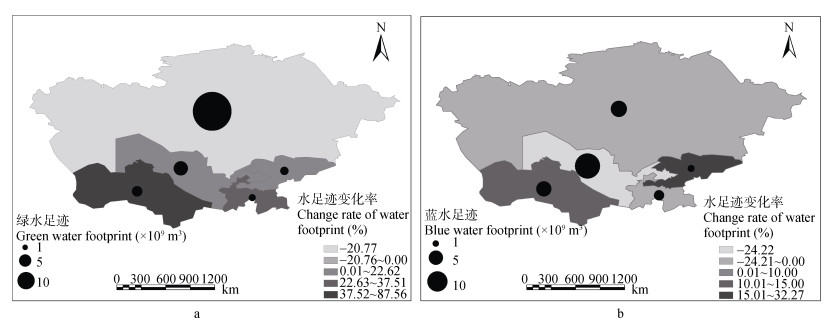
图51992-2017年中亚五国平均农作物绿水足迹和蓝水足迹及其变化率的空间变化
Figure5.Spatial variations of average green and blue water footprints of crops in the five Central Asian countries from 1992 to 2017
下载: 全尺寸图片幻灯片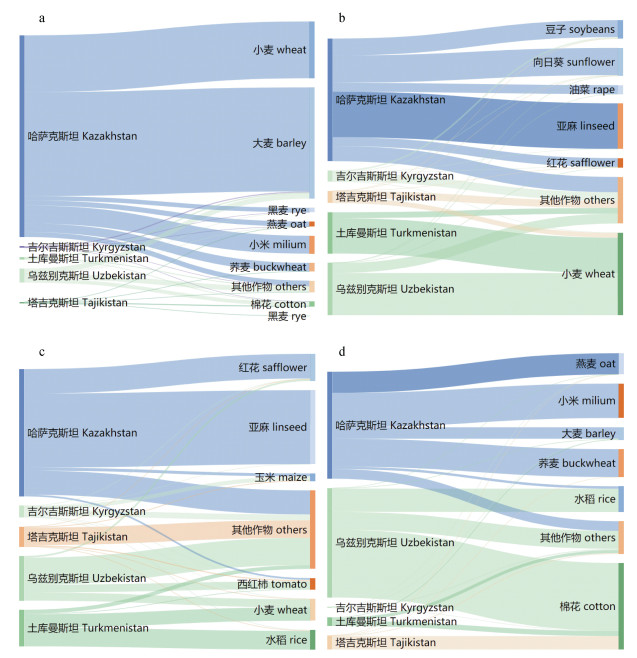
图6中亚五国水足迹变化的主要驱动农作物(a: 绿水足迹减少作物; b: 绿水足迹增加作物; c: 蓝水足迹增加作物; d: 蓝水足迹减少作物)
图中不同颜色分别表示5个国家。单幅图左侧表示国家水足迹变化相对量, 单幅图右侧表示农作物水足迹变化相对量, 中间部分表示水足迹变化对应的国家与农作物之间的关系。图中量纲均为1。
Figure6.Driving crops of water footprint changes in the five Central Asian countries (a: green water footprint reducing crops; b: green water footprint increasing crops; c: blue water footprint increasing crops; d: blue water footprint reducing crops)
Different colors in the figure represent five countries. The left side of the single figure shows the relative amount of change in the national water footprint, the right side shows the relative amount of change in the water footprint of crops, and the middle part shows the relationship between countries and crops corresponding to changes in water footprint. The dimensions in the figure are all 1.
下载: 全尺寸图片幻灯片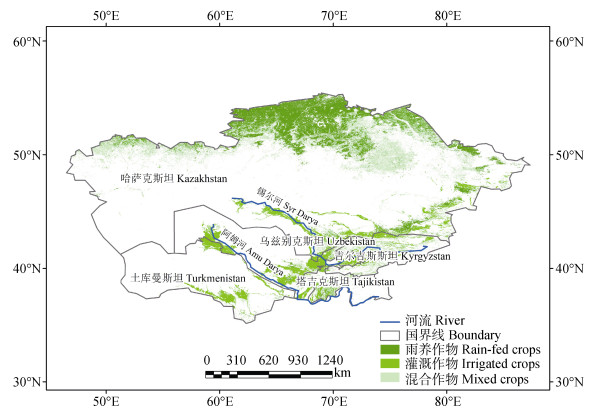
图7中亚五国耕地分布[14]
Figure7.Distribution of cultivated land in the five Central Asian countries
下载: 全尺寸图片幻灯片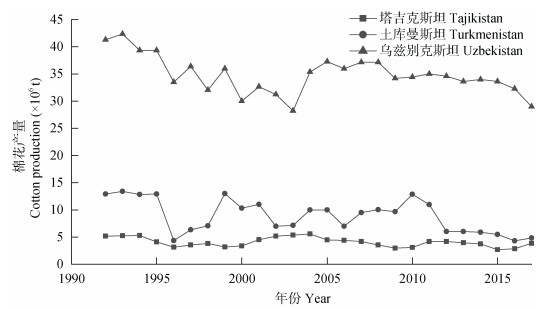
图8塔吉克斯坦、土库曼斯坦和乌兹别克斯坦棉花产量变化
Figure8.Cotton production in Tajikistan, Turkmenistan and Uzbekistan
下载: 全尺寸图片幻灯片参考文献
| [1] | RUAN H W, YU J J, WANG P, et al. Increased crop water requirements have exacerbated water stress in the arid transboundary rivers of Central Asia[J]. Science of The Total Environment, 2020, 713: 136585 doi: 10.1016/j.scitotenv.2020.136585 |
| [2] | SACCON P. Water for agriculture, irrigation management[J]. Applied Soil Ecology, 2018, 123: 793-796 doi: 10.1016/j.apsoil.2017.10.037 |
| [3] | 于水, 陈迪桃, 黄法融, 等. 中亚农业水资源脆弱性空间格局及分区研究[J]. 中国农业资源与区划, 2020, 41(4): 11-20 https://www.cnki.com.cn/Article/CJFDTOTAL-ZGNZ202004002.htm YU S, CHEN D T, HUANG F R, et al. Spatial pattern and zoning of agricultural water resources vulnerability in central Asia[J]. Chinese Journal of Agricultural Resources and Regional Planning, 2020, 41(4): 11-20 https://www.cnki.com.cn/Article/CJFDTOTAL-ZGNZ202004002.htm |
| [4] | GUAN X F, YANG L M, ZHANG Y X, et al. Spatial distribution, temporal variation, and transport characteristics of atmospheric water vapor over Central Asia and the arid region of China[J]. Global and Planetary Change, 2019, 172: 159-178 doi: 10.1016/j.gloplacha.2018.06.007 |
| [5] | ZHANG Y F, LI Y P, SUN J, et al. Optimizing water resources allocation and soil salinity control for supporting agricultural and environmental sustainable development in Central Asia[J]. Science of The Total Environment, 2020, 704: 135281 doi: 10.1016/j.scitotenv.2019.135281 |
| [6] | 吉力力·阿不都外力, 马龙. 中亚环境概论[M]. 北京: 气象出版社, 2015 JILILI·A, MA L. Overview of Central Asian Environments[M]. Beijing: China Meteorological Press, 2015 |
| [7] | 杨恕, 田宝. 中亚地区生态环境问题述评[J]. 东欧中亚研究, 2002, (5): 51-55 doi: 10.3969/j.issn.1671-8461.2002.05.009 YANG S, TIAN B. Comments on central Asian ecological environment[J]. East European, Russian & Central Asian Studies, 2002, (5): 51-55 doi: 10.3969/j.issn.1671-8461.2002.05.009 |
| [8] | EGAN M. The water footprint assessment manual: Setting the global standard[J]. Social and Environmental Accountability Journal, 2011, 31(2): 181-182 doi: 10.1080/0969160X.2011.593864 |
| [9] | LOVARELLI D, BACENETTI J, FIALA M. Water footprint of crop productions: A review[J]. Science of the Total Environment, 2016, 548/549: 236-251 doi: 10.1016/j.scitotenv.2016.01.022 |
| [10] | 邓铭江, 龙爱华, 章毅, 等. 中亚五国水资源及其开发利用评价[J]. 地球科学进展, 2010, 25(12): 1347-1356 https://www.cnki.com.cn/Article/CJFDTOTAL-DXJZ201012007.htm DENG M J, LONG A H, ZHANG Y, et al. Assessment of water resources development and utilization in the five Central Asia countries[J]. Advances in Earth Science, 2010, 25(12): 1347-1356 https://www.cnki.com.cn/Article/CJFDTOTAL-DXJZ201012007.htm |
| [11] | 邓铭江, 龙爱华. 中亚各国在咸海流域水资源问题上的冲突与合作[J]. 冰川冻土, 2011, 33(6): 1376-1390 https://www.cnki.com.cn/Article/CJFDTOTAL-BCDT201106021.htm DENG M J, LONG A H. Water resources issue among the Central Asian countries around the Aral Sea: Conflict and cooperation[J]. Journal of Glaciology and Geocryology, 2011, 33(6): 1376-1390 https://www.cnki.com.cn/Article/CJFDTOTAL-BCDT201106021.htm |
| [12] | 姚海娇, 周宏飞. 中亚五国咸海流域水资源策略的博弈分析[J]. 干旱区地理, 2013, 36(4): 764-771 https://www.cnki.com.cn/Article/CJFDTOTAL-GHDL201304036.htm YAO H J, ZHOU H F. Game analysis of water resources strategy among the Central Asia Countries around the Aral Sea Basin[J]. Arid Land Geography, 2013, 36(4): 764-771 https://www.cnki.com.cn/Article/CJFDTOTAL-GHDL201304036.htm |
| [13] | LI Z, FANG G H, CHENG Y N, et al. Agricultural water demands in Central Asia under 1.5℃ and 2.0℃ global warming[J]. Agricultural Water Management, 2020, 231: 106020 |
| [14] | 张雪妮, 吕光辉, 秦璐, 等. 土库曼斯坦农牧业水足迹研究[J]. 水资源与水工程学报, 2014, 25(3): 38-42 https://www.cnki.com.cn/Article/CJFDTOTAL-XBSZ201403008.htm ZHANG X N, Lü G H, QIN L, et al. Research on agriculture and husbandry water footprint in Turkmenistan[J]. Journal of Water Resources and Water Engineering, 2014, 25(3): 38-42 https://www.cnki.com.cn/Article/CJFDTOTAL-XBSZ201403008.htm |
| [15] | DE BEURS K M, HENEBRY G M, OWSLEY B C, et al. Using multiple remote sensing perspectives to identify and attribute land surface dynamics in Central Asia 2001-2013[J]. Remote Sensing of Environment, 2015, 170: 48-61 doi: 10.1016/j.rse.2015.08.018 |
| [16] | 阮宏威, 于静洁. 1992—2015年中亚五国土地覆盖与蒸散发变化[J]. 地理学报, 2019, 74(7): 1292-1304 https://www.cnki.com.cn/Article/CJFDTOTAL-DLXB201907003.htm RUAN H W, YU J J. Changes in land cover and evapotranspiration in the five Central Asian countries from 1992 to 2015[J]. Acta Geographica Sinica, 2019, 74(7): 1292-1304 https://www.cnki.com.cn/Article/CJFDTOTAL-DLXB201907003.htm |
| [17] | LI Z, CHEN Y N, LI W H, et al. Potential impacts of climate change on vegetation dynamics in Central Asia[J]. Journal of Geophysical Research Atmospheres, 2015, 120(24): 12345-12356 doi: 10.1002/2015JD023618 |
| [18] | 姚俊强, 杨青, 毛炜峄, 等. 气候变化和人类活动对中亚地区水文环境的影响评估[J]. 冰川冻土, 2016, 38(1): 222-230 https://www.cnki.com.cn/Article/CJFDTOTAL-BCDT201601025.htm YAO J Q, YANG Q, MAO W Y, et al. Evaluation of the impacts of climate change and human activities on the hydrological environment in Central Asia[J]. Journal of Glaciology and Geocryology, 2016, 38(1): 222-230 https://www.cnki.com.cn/Article/CJFDTOTAL-BCDT201601025.htm |
| [19] | ZHANG Y, ZHANG J H, TIAN Q, et al. Virtual water trade of agricultural products: A new perspective to explore the Belt and Road[J]. Science of the Total Environment, 2018, 622/623: 988-996 doi: 10.1016/j.scitotenv.2017.11.351 |
| [20] | SOLIGNO I, MALIK A, LENZEN M. Socioeconomic drivers of global blue water use[J]. Water Resources Research, 2019, 55(7): 5650-5664 doi: 10.1029/2018wr024216 |
| [21] | QIAN Y Y, TIAN X, GENG Y, et al. Driving factors of agricultural virtual water trade between China and the Belt and Road countries[J]. Environmental Science & Technology, 2019, 53(10): 5877-5886 http://en.cnki.com.cn/Article_en/CJFDTotal-GHDL201906025.htm |
| [22] | TUNINETTI M, TAMEA S, LAIO F, et al. A fast track approach to deal with the temporal dimension of crop water footprint[J]. Environmental Research Letters, 2017, 12(7): 074010 http://adsabs.harvard.edu/abs/2017ERL....12g4010T |
| [23] | MEKONNEN M M, HOEKSTRA A Y. The green, blue and grey water footprint of crops and derived crop products[J]. Hydrology of Earth System Sciences, 2011, 15(5): 1577-1600 http://www.cabdirect.org/abstracts/20113210761.html |
| [24] | 阿布都米吉提·阿布力克木, 葛拥晓, 王亚俊, 等. 咸海的过去、现在与未来[J]. 干旱区研究, 2019, 36(1): 7-18 https://www.cnki.com.cn/Article/CJFDTOTAL-GHQJ201901003.htm ABLEKIM A, GE Y X, WANG Y J, et al. The past, present and feature of the Aral Sea[J]. Arid Zone Research, 2019, 36(1): 7-18 https://www.cnki.com.cn/Article/CJFDTOTAL-GHQJ201901003.htm |
| [25] | 张小瑜. 乌兹别克斯坦水资源问题探析[D]. 乌鲁木齐: 新疆师范大学, 2013 ZHANG X Y. Analysis of the water resources issues in Uzbekistan[D]. Urumqi: Xinjiang Normal University, 2013 |
| [26] | 杨雪雯, 王宁练, 陈安安, 等. 中亚干旱区咸海面积变化与人类活动及气候变化的关联研究[J]. 冰川冻土, 2020, 42(2): 681-692 https://www.cnki.com.cn/Article/CJFDTOTAL-BCDT202002038.htm YANG X W, WANG N L, CHEN A A, et al. The relationship between area variation of the Aral Sea in the arid Central Asia and human activities and climate change[J]. Journal of Glaciology and Geocryology, 2020, 42(2): 681-692 https://www.cnki.com.cn/Article/CJFDTOTAL-BCDT202002038.htm |
