张宇飞1,
杨祎博1,
于淼2,,
1.沈阳农业大学土地与环境学院 沈阳 110866
2.沈阳农业大学理学院 沈阳 110866
基金项目: 辽宁省自然科学基金项目01064219009
详细信息
作者简介:边振兴, 研究方向为农地利用与保护、农业景观生态学。E-mail:zhx-bian@syau.edu.cn
通讯作者:于淼, 研究方向为数理统计与景观生态学。E-mail:yumiao77@163.com
中图分类号:P901计量
文章访问数:356
HTML全文浏览量:7
PDF下载量:235
被引次数:0
出版历程
收稿日期:2020-01-09
录用日期:2020-03-19
刊出日期:2020-10-01
Effects of agricultural landscape pattern on qualitative food web structure of corn pest-predatory natural enemies
BIAN Zhenxing1,,ZHANG Yufei1,
YANG Yibo1,
YU Miao2,,
1. College of Land and Environment, Shenyang Agricultural University, Shenyang 110866, China
2. College of Science, Shenyang Agricultural University, Shenyang 110866, China
Funds: the Natural Science Foundation of Liaoning Province01064219009
More Information
Corresponding author:YU Miao, E-mail:yumiao77@163.com
摘要
HTML全文
图
参考文献
相关文章
施引文献
资源附件
访问统计
摘要
摘要:农业过度集约化带来的农业景观均质化已成为农田生物多样性降低的主要原因之一。为研究农业景观格局对害虫-捕食性天敌定性食物网结构的影响,本文选择辽宁省昌图县为研究区,选取8个典型田块为样区,在分析定性食物网结构的基础上,采用回归分析和最优模型确定食物网参数与景观指数之间的关系。结果表明:1)互作丰度(IR)与各景观指数无显著相关性。2)连接密度(LD)与蔓延度指数(CONTAG,x1)、聚集度指数(AI,x2)呈显著正相关(P < 0.05),最优模型为:LD=-64.621+0.780x1+0.739x2。农业景观中非耕作斑块越聚集,玉米害虫-捕食性天敌定性食物网结构越复杂。3)连接性(C)与CONTAG(x1)、香农多样性指数(SHDI,x3)呈显著正相关(P < 0.05),而与香农均匀度指数(SHEI,x4)呈显著负相关(P < 0.05),最优模型为:C=-178.500+1.831x1-106.808x4。景观类型越多样,且同类斑块连接度越好,害虫与捕食性天敌的相互作用越频繁,也越有利于复杂食物网结构的维持。4)普遍性(G)与景观形状指数(LSI,x5)、斑块结合指数(COHESION,X7)、AI(x2)呈显著正相关(P < 0.05),而与斑块密度(PD,x6)呈显著负相关(P < 0.05),最优模型为:G=-2 994.798+26.891x2+27.090x5-0.491x6+2.851x7。非耕作斑块破碎化程度越低,天敌的搜寻行为和聚集行为越强,越有利于食物网结构的稳定。5)易损性(V)与SHEI(x4)呈显著正相关,而与CONTAG(x1)呈显著负相关(P < 0.05),最优模型为:V=8.411+5.351x4。斑块类型在景观中分布越均匀,害虫多样性越高,群落结构也越复杂。总体而言,农业景观异质性越强越有利于玉米害虫-捕食性天敌定性食物网的构建和抗干扰性的增强。而利用田间数据构建食物网矩阵的方法可以成为研究如何增强农业景观异质性的有力工具。
关键词:农业景观格局/
景观异质性/
土壤节肢动物/
捕食性天敌/
害虫/
定性食物网
Abstract:The homogenization of agricultural landscape caused by excessive agricultural intensification has been one of the main reasons for the reduction of farmland biodiversity. Research on the impact of the agricultural landscape pattern on the qualitative food web structure of pest-predatory natural enemies was conducted in Changtu County, Liaoning Province, where eight typical fields were sampled. Regression analysis and optimal model determined the relationship between food web parameters and landscape indexes. The results showed an insignificant correlation between food web interaction richness (IR) and landscape indexes. However, a significant positive multiple correlations between food web linkage density (LD) and contagion index (CONTAG, x1) and aggregation index (AI, x2) were observed. The corresponding optimal model was: LD=-64.621+0.780x1+0.739x2. The complexity of the qualitative food web structure of the corn pest-predatory natural enemies was dependent on the degree of concentration of the non-cultivated patches in the agricultural landscape. Furthermore, food web connectance (C) was significantly positively correlated with CONTAG, (x1) and Shannon diversity index (SHDI, x3), but was significantly negatively correlated with Shannon evenness index (SHEI, x4). The corresponding optimal model was: C=-178.500+1.831x1-106.808x4; the more diverse the landscape types, the better the connectivity of the same patches; the more frequent the interaction between pests and predatory natural enemies, the more beneficial it is to maintain the complex food web structure. Food web generality (G) was significantly positively correlated with landscape shape index (LSI, x5), cohesion index (COHESION, x7), and AI (x2); however, it was significantly negatively correlated with patch density (PD, x6). The corresponding optimal model was: G=-2 994.798+26.891x2+27.090x5-0.491x6+2.851x7; the lower the degree of non-cultivated patch fragmentation, the stronger the search and aggregation behavior of natural enemies, which is beneficial and increases the stability of the food web structure. Food web vulnerability (V) was significantly positively correlated with the SHEI (x4), but was significantly negatively correlated with CONTAG (x1). The corresponding optimal model was: V=8.411+5.351x4; the more evenly distributed patch types in the landscape, the higher the pest diversity and the increased complexity of the community structure. In general, the construction of the qualitative food web of corn pest-predatory natural enemies and the enhancement of anti-interference largely depends on the strength of the heterogeneity of the agricultural landscape. The use of field data in the construction of a food web matrix is a method that can be a powerful resource for studying ways to enhance the heterogeneity of agricultural landscapes.
Key words:Agricultural landscape pattern/
Landscape homogenization/
Soil arthropods/
Predatory natural enemy/
Pest/
Qualitative food web
HTML全文

图1研究区土地利用类型和样区分布
Figure1.Distribution of land use types and sampling areas in the study area
 下载: 全尺寸图片幻灯片
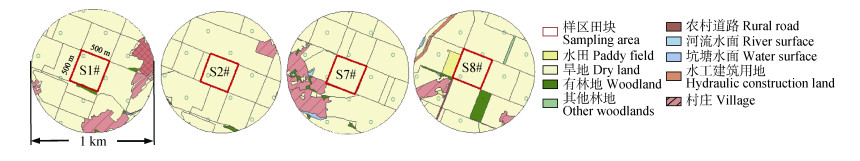
图2典型采样区田块的土地利用现状图
Figure2.Present land use map of field of the typical sampling areas
下载: 全尺寸图片幻灯片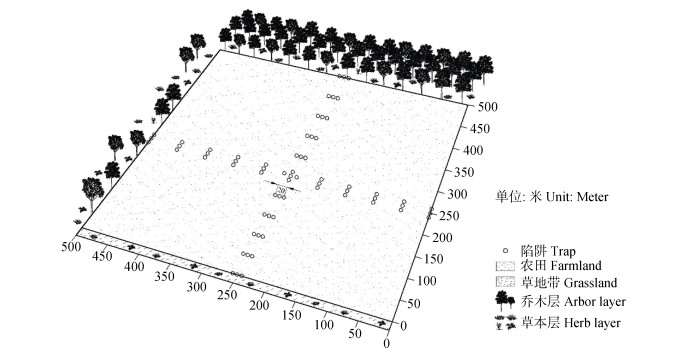
图3样区内土壤动物样点布设示意图
Figure3.Map of sample points for soil arthropod in the sampling area
下载: 全尺寸图片幻灯片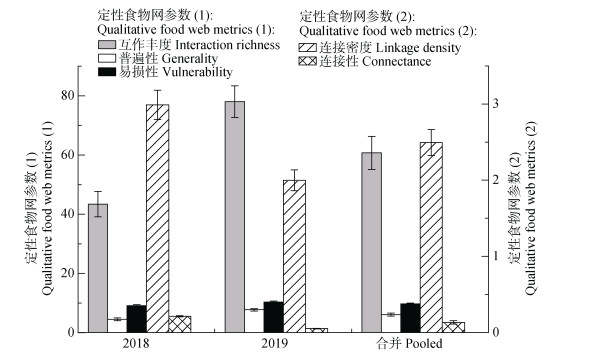
图42018年和2019年玉米田害虫-捕食性天敌定性食物网参数值
图中数据为平均值±标准误差, 数据来源于8个样区内1 056个陷阱布设点, 其中2018年和2019年各528个。合并代表两年数据的总平均值。
Figure4.Qualitative metrics of pest-predatory natural enemies in the tested maize fields across 2018 and 2019
The data was mean±standard error, which was came from a total of 1 056 study sites whereas 528 each in 2018 and 2019. Pooled represents the total average of the two-year data.
下载: 全尺寸图片幻灯片表1研究区8个样区田块的景观格局指数
Table1.Landscape pattern parameters of 8 fields of the sampling areas in the study area
| 田块序号 Number of sampling area | LPI | ED | PD | CONTAG | AI | LSI | COHESION | SHDI | SHEI |
| 1 | 87.049 | 32.044 | 5.728 | 83.773 | 98.617 | 2.545 | 99.545 | 0.496 | 0.277 |
| 2 | 97.416 | 6.682 | 2.228 | 93.146 | 99.700 | 1.423 | 99.860 | 0.131 | 0.119 |
| 3 | 90.145 | 28.639 | 3.819 | 89.326 | 98.692 | 2.394 | 99.544 | 0.272 | 0.169 |
| 4 | 94.135 | 21.448 | 4.137 | 86.745 | 98.990 | 2.076 | 99.665 | 0.238 | 0.216 |
| 5 | 83.630 | 38.537 | 8.274 | 86.746 | 98.377 | 2.832 | 99.113 | 0.480 | 0.218 |
| 6 | 83.748 | 38.951 | 7.956 | 81.197 | 98.333 | 2.851 | 99.368 | 0.569 | 0.318 |
| 7 | 84.815 | 35.736 | 8.592 | 84.616 | 98.426 | 2.709 | 99.424 | 0.507 | 0.260 |
| 8 | 81.874 | 47.034 | 10.820 | 83.375 | 97.999 | 3.209 | 99.250 | 0.606 | 0.276 |
| LPI:最大斑块指数; ED:边界密度; PD:斑块密度; CONTAG:蔓延度指数; AI:聚集度指数; LSI:景观形状指数; COHESION:斑块结合指数; SHDI:香农多样性指数; SHEI:香农均匀度指数。LPI: largest patch index; ED: edge density; PD: patch density; CONTAG: contagion index; AI: aggregation index; LSI: landscape shape index; COHESION: cohesion index; SHDI: Shannon’s diversity index; SHEI: Shannon’s evenness index. | |||||||||
下载: 导出CSV表2定性食物网参数计算公式及意义
Table2.Calculation formula and significance of qualitative food web parameters
| 食物网参数 Food web parameters | 计算公式 Calculation formula | 指数意义 Meaning of metrics |
| 互作丰度?Interaction richness | L | 反映食物网中发生天敌-害虫相互作用的频繁程度?Reflect the frequency of natural enemy-pest interactions in the food web |
| 连接密度?Linkage density | L/S | 反映捕食作用范围的广泛程度?Reflect the breadth of predation range |
| 连接性?Connectance | L/S2 | 反映食物网结构复杂程度?Reflect the complexity of food web structure |
| 普遍性?Generality | L/Senemy | 反映天敌多样性?Reflect the diversity of natural enemies |
| 易损性?Vulnerability | L/Sprey | 反映害虫多样性?Reflect the diversity of pest |
| L代表食物网中实际发生的捕食关系数量; S代表食物网中总物种数; Senemy代表捕食性天敌物种数; Sprey代表害虫的物种数。L represents the number of actual predation relationships in the food web; S represents the total number of species in the food web; Senemy represents the number of predatory natural enemies; Sprey represents the number of species of pests. | ||
下载: 导出CSV表3调查玉米田土壤节肢动物类型及数量统计表
Table3.Types and quantities of arthropods in the tested maize fields
| 土壤节肢动物类型?Soil arthropod type | 数量 Number | 优势度 Dominance | |||
| 昆虫纲 Insecta | 直翅目 Orthoptera | 蟋蟀科?Gryllidae | 黄脸油葫芦?Teleogryllus emma | 12 109 | +++ |
| 棺头蟋?Doenitzi stein | 550 | ++ | |||
| 蝗科?Acrididae | 笨蝗?Haplotropis brunneriana Saussure | 4 | + | ||
| 中华蚱蜢?Acrida cinerea | 14 | + | |||
| 大垫尖翅蝗 Epacromius coerulipes | 48 | + | |||
| 宽翅曲背蝗?Pararcyptera microptera meridionalis | 6 | + | |||
| 短额附蝗?Atractomorpha sinensis | 18 | + | |||
| 短星翅蝗?Calliptamus abbreviatus | 25 | + | |||
| 棉蝗?Chondracris rosea | 1 | + | |||
| 辽宁金色蝗?Chrysacris | 3 | + | |||
| 鞘翅目 Coleoptera | 步甲科?Carabidae | 中华婪步甲?Harpalus sinicus | 2 608 | ++ | |
| 附边青步甲?Chlaenius prostenus | 658 | ++ | |||
| 麻青步甲?Chlaenius junceus | 4 846 | +++ | |||
| 蠋步甲?Dolichus halensis | 529 | ++ | |||
| 大星步甲?Calosoma maximoviczi | 1 522 | ++ | |||
| 毛婪步甲?Harpalus griseus | 195 | + | |||
| 中华金星步甲?Calosoma chinense | 513 | ++ | |||
| 赤褐婪步甲?Harpalus rubefactu | 1 115 | ++ | |||
| 虎甲科?Cicindelidae | 细虎甲?Cicindelagracilis | 15 | + | ||
| 斜斑虎甲?Cicindela germanica | 4 | + | |||
| 埋葬甲科 Staphylinoidea | 日负葬甲?Nicrophorus japonicuw | 18 | + | ||
| 双斑葬甲?Ptomascopus plagiatus | 1 | + | |||
| 叶甲科Chrysomeloidea | 双斑长跗萤叶甲?Monolepta hieroglyphica | 14 | + | ||
| 刺松隐翅虫 Staphylinidae(Pinophilus punctatissimus) | 21 | + | |||
| 粪金龟科?Geotrupidae | 戴锤角粪金龟?Bolbotrypes davidis | 30 | + | ||
| 昆虫纲 Insecta | 鞘翅目 Coleoptera | 金龟科?Scarab | 婪嗡蜣螂?Onthophagus lenzi | 130 | + |
| 花金龟科?Cetoniidae | 白星花金龟?Protaetia brevitarsis | 5 | + | ||
| 鳃金龟科?Melolonthidae | 额臀大黑鳃金龟?Holotrichia convespyga | 5 | + | ||
| 华北大黑鳃金龟?Holotrichia oblita | 2 | + | |||
| 蜉金龟科?Aphodiidae | 黑蜉金龟?Aphodius breviusculus | 2 | + | ||
| 瓢虫科?Coccinellidae | 异色瓢虫?Harmonia axyridis | 23 | + | ||
| 龟纹瓢虫?Propylaea japonica | 1 | + | |||
| 黄斑盘瓢虫?Lemnia saucia | 3 | + | |||
| 拟步甲科?Tenebrionindae | 沙潜?Opatrum subaratum | 1 797 | ++ | ||
| 鞘翅目幼虫?Coleoptera | 4 | + | |||
| 半翅目 Hemiptera | 长蝽科?Lygaeidae | 角红长蝽?Lygaeus hanseni | 1 | + | |
| 红蝽科?Pyrrhocoridae | 地红蝽?Pyrrhocoris tibialis | 125 | + | ||
| 革翅目 Dermaptera | 蠼螋科?Labiduridae | 蠼螋?Titanolabis colossea | 3 | + | |
| 鳞翅目 Lepidoptera | 螟蛾科?Pyralidae 鳞翅目幼虫?Lepidoptera | 亚洲玉米螟?Ostrinia furnacalis | 3 | + | |
| 14 | + | ||||
| 膜翅目 Hymenoptera | 叶蜂科?Tenthredinidae | 叶蜂?Tenthredinidae | 2 | + | |
| 蚁科?Formicidae | 5 089 | +++ | |||
| 蛛形纲 Arachnida | 蜘蛛目 Araneae | 幽灵蛛科?Pholcidae | 2 863 | ++ | |
| 皿蛛科?Linyphiidae | 73 | + | |||
| 漏斗蛛科?Agelenidae | 320 | + | |||
| 狼蛛科?Lycosidae | 68 | + | |||
| 转蛛科?Trochanteriidae | 234 | + | |||
| 栉足蛛科?Ctenidae | 1 | + | |||
| 近管蛛科?Anyphaenidae | 1 | + | |||
| 逸蛛科?Zoropsidae | 3 | + | |||
| 狼栉蛛科?Zoridae | 19 | + | |||
| 弱斑蛛科?Ischnothyreus | 27 | + | |||
| 软甲纲 Malacostraca | 等足目 Isopoda | 潮虫科?Onsicidae | 鼠妇 Armadillidium vulgare | 20 | + |
| 总计?Sum | 35 705 | ||||
| +++表示个体数占总捕获量的10%以上, ++表示个体数占总捕获量的1%~10%, +表示个体数占总捕获量的1%以下。“+++”, “++” and “+” indicate that the number of individuals accounts for more than 10%, 1%-10%, and less than 1% of the total capture, respectively. | |||||
下载: 导出CSV表42018年和2019年不同景观格局指数对玉米田定性食物网参数影响的单变量回归分析结果
Table4.Effects of landscape pattern parameters on qualitative food web parameters from univariate regression analysis of the tested maize fields in 2018 and 2019
| 景观格局指数 Landscape pattern parameter | 食物网参数 Food web parameter | P (2018) | P (2019) | 效应 Effect |
| 斑块密度 Patch density | 互作丰度?Interaction richness | 0.336 | 0.232 | - |
| 连接密度?Linkage density | 0.329 | 0.176 | - | |
| 连接性?Connectance | 0.139 | 0.051 | - | |
| 普遍性?Generality | 0.045* | 0.039* | - | |
| 易损性?Vulnerability | 0.155 | 0.108 | + | |
| 最大斑块指数 Largest patch index | 互作丰度?Interaction richness | 0.325 | 0.261 | + |
| 连接密度?Linkage density | 0.321 | 0.211 | + | |
| 连接性?Connectance | 0.160 | 0.103 | + | |
| 普遍性?Generality | 0.097 | 0.064 | + | |
| 易损性?Vulnerability | 0.223 | 0.157 | - | |
| 景观形状指数 Landscape shape index | 互作丰度?Interaction richness | 0.362 | 0.195 | - |
| 连接密度?Linkage density | 0.373 | 0.152 | - | |
| 连接性?Connectance | 0.238 | 0.089 | - | |
| 普遍性?Generality | 0.048* | 0.045* | + | |
| 易损性?Vulnerability | 0.270 | 0.212 | + | |
| 蔓延度指数 Contagion index | 互作丰度?Interaction richness | 0.045* | 0.466 | - |
| 连接密度?Linkage density | 0.002** | 0.049* | + | |
| 连接性?Connectance | 0.047* | 0.043* | + | |
| 普遍性?Generality | 0.268 | 0.192 | + | |
| 易损性?Vulnerability | 0.038* | 0.042* | - | |
| 斑块结合指数 Cohesion index | 互作丰度?Interaction richness | 0.472 | 0.145 | + |
| 连接密度?Linkage density | 0.435 | 0.120 | + | |
| 连接性?Connectance | 0.177 | 0.115 | + | |
| 普遍性?Generality | 0.049* | 0.041* | + | |
| 易损性?Vulnerability | 0.121 | 0.288 | + | |
| 香农多样性指数 Shannon’s diversity index | 互作丰度?Interaction richness | 0.114 | 0.435 | - |
| 连接密度?Linkage density | 0.125 | 0.357 | - | |
| 连接性?Connectance | 0.030* | 0.042* | + | |
| 普遍性?Generality | 0.182 | 0.122 | - | |
| 易损性?Vulnerability | 0.345 | 0.061 | + | |
| 香农均匀度指数 Shannon’s evenness index | 互作丰度?Interaction richness | 0.097 | 0.409 | + |
| 连接密度?Linkage density | 0.054 | 0.048* | - | |
| 连接性?Connectance | 0.001** | 0.048* | - | |
| 普遍性?Generality | 0.317 | 0.223 | - | |
| 易损性?Vulnerability | 0.029* | 0.028* | + | |
| 边界密度 Edge density | 互作丰度?Interaction richness | 0.362 | 0.195 | - |
| 连接密度?Linkage density | 0.373 | 0.152 | - | |
| 连接性?Connectance | 0.238 | 0.089 | - | |
| 普遍性?Generality | 0.071 | 0.045* | - | |
| 易损性?Vulnerability | 0.270 | 0.212 | + | |
| 聚集度指数 Aggregation index | 互作丰度?Interaction richness | 0.391 | 0.167 | + |
| 连接密度?Linkage density | 0.041* | 0.046* | + | |
| 连接性?Connectance | 0.297 | 0.079 | + | |
| 普遍性?Generality | 0.038* | 0.036* | + | |
| 易损性?Vulnerability | 0.030* | 0.234 | - | |
| “*”和“**”表示该景观指数对相应的食物网参数有显著(P < 0.05)和极显著(P < 0.01)影响。“+”和“-”分别代表景观正负效应。“*” and “**” indicate significant effect at P < 0.05 and P < 0.01, “+” and “-” indicate positive and negative effects of landscape land use type, respectively. | ||||
下载: 导出CSV表5景观格局指数与定性食物网参数关系的多元回归分析及基于AICc准则的最优模型筛选结果
Table5.Multivariate regression analysis and the best model selection to evaluate landscape effects on qualitative food web metrics in maize fields
| 响应变量 Response variables | 模型方程 Model | 残差平方和 Sp2 | 样本量 Sample size n | 阶数 Ki | 校正的AIC值 AICc | 调整R2 Adjusted R2 |
| 连接密度(LD) Linkage density | LD=b0+b1x1+b2x2 | 0.407 | 8 | 4 | 2.808 | 0.443 |
| LD=b0+b1x1 | 0.728 | 8 | 3 | 5.460 | 0.004 | |
| LD=b0+b2x2 | 0.598 | 8 | 3 | 3.887 | 0.182 | |
| 连接性(C) Connectance | C=b0+b1x1+b3x3+b4x4 | 2.206 | 8 | 5 | 18.329 | 0.531 |
| C=b0+b1x1+b3x3 | 4.555 | 8 | 4 | 22.130 | 0.032 | |
| C=b0+b1x1+b4x4 | 2.474 | 8 | 4 | 17.247 | 0.475 | |
| C=b0+b3x3+b4x4 | 4.328 | 8 | 4 | 21.721 | 0.081 | |
| C=b0+b1x1 | 4.688 | 8 | 3 | 20.360 | 0.004 | |
| C=b0+b3x3 | 4.625 | 8 | 3 | 20.252 | 0.017 | |
| C=b0+b4x4 | 4.707 | 8 | 3 | 20.392 | 0.019 | |
| 普遍性(G) Generality | G=b0+b2x2+b5x5+b6x6+b7x7 | 0.918 | 8 | 6 | 13.316 | 0.914 |
| G=b0+b2x2+b5x5+b6x6 | 1.358 | 8 | 5 | 14.448 | 0.873 | |
| G=b0+b2x2+b5x5+b7x7 | 2.480 | 8 | 5 | 19.266 | 0.769 | |
| G=b0+b2x2+b6x6+b7x7 | 5.097 | 8 | 5 | 25.029 | 0.524 | |
| G=b0+b5x5+b6x6+b7x7 | 5.702 | 8 | 5 | 25.927 | 0.468 | |
| G=b0+b2x2+b5x5 | 2.863 | 8 | 4 | 18.415 | 0.733 | |
| G=b0+b2x2+b6x6 | 5.260 | 8 | 4 | 23.281 | 0.509 | |
| G=b0+b2x2+b7x7 | 5.116 | 8 | 4 | 23.059 | 0.523 | |
| G=b0+b5x5+b6x6 | 5.783 | 8 | 4 | 24.039 | 0.460 | |
| G=b0+b5x5+b7x7 | 5.767 | 8 | 4 | 24.017 | 0.462 | |
| G=b0+b6x6+b7x7 | 6.199 | 8 | 4 | 24.595 | 0.422 | |
| G=b0+b2x2 | 5.260 | 8 | 3 | 21.281 | 0.509 | |
| G=b0+b5x5 | 5.824 | 8 | 3 | 22.096 | 0.457 | |
| G=b0+b6x6 | 6.213 | 8 | 3 | 22.613 | 0.420 | |
| G=b0+b7x7 | 7.077 | 8 | 3 | 23.655 | 0.340 | |
| 易损性(V) Vulnerability | V=b0+b1x1+b4x4 | 2.913 | 8 | 4 | 18.553 | 0.334 |
| V=b0+b1x1 | 3.656 | 8 | 3 | 18.371 | 0.164 | |
| V=b0+b4x4 | 3.537 | 8 | 3 | 18.106 | 0.191 | |
| 表中粗体行代表最优模型(AICc值最小)。模型中的x1-x7分别代表景观蔓延度指数(CONTAG)、聚集度指数(AI)、香农多样性指数(SHDI)、香农均匀度指数(SHEI)、景观形状指数(LSI)、斑块密度(PD)、斑块结合指数(COHESIOH)。Bold lines are the best models. x1-x7 in the model represent the landscape indexes of contagion index (CONTAG), aggregation index (AI), Shannon’s diversity index (SHDI), Shannon’s evenness index (SHEI), landscape shape index (LSI), patch density (PD), and cohesion index (COHESIOH). | ||||||
下载: 导出CSV参考文献
| [1] | 戈峰, 欧阳芳, 赵紫华.基于服务功能的昆虫生态调控理论[J].应用昆虫学报, 2014, 51(3):597-605 http://www.wanfangdata.com.cn/details/detail.do?_type=perio&id=kczs201403001 GE F, OUYANG F, ZHAO Z H. Ecological management of insects based on ecological services at a landscape scale[J]. Chinese Journal of Applied Entomology, 2014, 51(3):597-605 http://www.wanfangdata.com.cn/details/detail.do?_type=perio&id=kczs201403001 |
| [2] | 宇振荣, 谷卫彬, 胡敦孝.江汉平原农业景观格局及生物多样性研究——以两个村为例[J].资源科学, 2000, 22(2):19-23 http://www.wanfangdata.com.cn/details/detail.do?_type=perio&id=zykx200002004 YU Z R, GU W B, HU D X. On landscape pattern and biodiversity in rural areas of Jianghan Plain-Taking two villages as a case study[J]. Resources Science, 2000, 22(2):19-23 http://www.wanfangdata.com.cn/details/detail.do?_type=perio&id=zykx200002004 |
| [3] | 张鑫.农田景观格局对地表步甲和蜘蛛多样性影响研究[D].北京: 中国农业大学, 2017 http://cdmd.cnki.com.cn/Article/CDMD-10019-1017164655.htm ZHANG X. The effects of agriculture landscape pattern on the diversity of ground carabid and spider[D]. Beijing: China Agricultural University, 2017 http://cdmd.cnki.com.cn/Article/CDMD-10019-1017164655.htm |
| [4] | 张永生.农田景观格局对蚜虫及天敌瓢虫种群的生态学效应[D].长沙: 湖南农业大学, 2018 http://cdmd.cnki.com.cn/Article/CDMD-10537-1019876866.htm ZHANG Y S. Ecological effects of agricultural landscape patterns on aphids and ladybeetles[D]. Changsha: Hunan Agricultural University, 2018 http://cdmd.cnki.com.cn/Article/CDMD-10537-1019876866.htm |
| [5] | 张永生, 欧阳芳, 门兴元, 等.区域农田景观格局对麦蚜种群数量的影响[J].生态学报, 2018, 38(23):8652-8659 http://www.wanfangdata.com.cn/details/detail.do?_type=perio&id=stxb201823039 ZHANG Y S, OUYANG F, MEN X Y, et al. Effects of regional agricultural landscape patterns on populations of wheat aphids[J]. Acta Ecologica Sinica, 2018, 38(23):8652-8659 http://www.wanfangdata.com.cn/details/detail.do?_type=perio&id=stxb201823039 |
| [6] | KNAPP M, ?EZá? M. Even the smallest non-crop habitat islands could be beneficial:Distribution of carabid beetles and spiders in agricultural landscape[J]. PLoS One, 2015, 10(4):e0123052 doi: 10.1371/journal.pone.0123052 |
| [7] | GABRIEL D, TSCHARNTKE T. Insect pollinated plants benefit from organic farming[J]. Agriculture, Ecosystems & Environment, 2007, 118(1/4):43-48 http://www.sciencedirect.com/science/article/pii/S0167880906001484 |
| [8] | GABRIEL D, THIES C, TSCHARNTKE T. Local diversity of arable weeds increases with landscape complexity[J]. Perspectives in Plant Ecology, Evolution and Systematics, 2005, 7(2):85-93 doi: 10.1016/j.ppees.2005.04.001 |
| [9] | MCCANN K S. The diversity-stability debate[J]. Nature, 2000, 405(6783):228-233 doi: 10.1038/35012234 |
| [10] | MCCANN K S, ROONEY N. The more food webs change, the more they stay the same[J]. Philosophical Transactions of the Royal Society B:Biological Sciences, 2009, 364(1524):1789-1801 doi: 10.1098/rstb.2008.0273 |
| [11] | 曾颖达.农田景观组成对小麦、棉花捕食性天敌-害虫定性食物网结构的影响[D].北京: 中国农业科学院, 2018 http://cdmd.cnki.com.cn/Article/CDMD-82101-1018160603.htm ZENG Y D. Effects of landscape compositions on predator-prey qualitative food web in wheat and cotton fields[D]. Beijing: Chinese Academy of Agricultural Sciences, 2018 http://cdmd.cnki.com.cn/Article/CDMD-82101-1018160603.htm |
| [12] | 江婷, 付道猛, 张万娜, 等.农田景观格局对害虫天敌生态控害功能的调控作用[J].应用生态学报, 2019, 30(7):2511-2520 http://www.wanfangdata.com.cn/details/detail.do?_type=perio&id=yystxb201907040 JIANG T, FU D M, ZHANG W N, et al. Regulating effect of agricultural landscape pattern on ecological pest control by natural enemies[J]. Chinese Journal of Applied Ecology, 2019, 30(7):2511-2520 http://www.wanfangdata.com.cn/details/detail.do?_type=perio&id=yystxb201907040 |
| [13] | 张晴晴, 卢增斌, 李丽莉, 等.区域性农田景观格局对棉蚜种群数量的生态学效应[J].生态学报, 2018, 38(4):1366-1374 http://www.wanfangdata.com.cn/details/detail.do?_type=perio&id=stxb201804022 ZHANG Q Q, LU Z B, LI L L, et al. Ecological effects of farmland landscape patterns on the populations of cotton aphids, Aphis gossypii Glover, in North China[J]. Acta Ecologica Sinica, 2018, 38(4):1366-1374 http://www.wanfangdata.com.cn/details/detail.do?_type=perio&id=stxb201804022 |
| [14] | 范敏, 彭羽, 王庆慧, 等.景观格局与植物多样性的关系及其空间尺度效应——以浑善达克沙地为例[J].生态学报, 2018, 38(7):2450-2461 http://www.wanfangdata.com.cn/details/detail.do?_type=perio&id=stxb201807022 FAN M, PENG Y, WANG Q H, et al. Correlations between landscape pattern and plant diversity at multiple spatial scales:A case study of Hunshandak Sandland[J]. Acta Ecologica Sinica, 2018, 38(7):2450-2461 http://www.wanfangdata.com.cn/details/detail.do?_type=perio&id=stxb201807022 |
| [15] | AVIRON S, BUREL F, BAUDRY J, et al. Carabid assemblages in agricultural landscapes:Impacts of habitat features, landscape context at different spatial scales and farming intensity[J]. Agriculture, Ecosystems & Environment, 2005, 108(3):205-217 http://europepmc.org/abstract/AGR/IND43716560 |
| [16] | CLOUGH Y, BARKMANN J, JUHRBANDT J, et al. Combining high biodiversity with high yields in tropical agroforests[J]. Proceedings of the National Academy of Sciences of the United States of America, 2011, 108(20):8311-8316 doi: 10.1073/pnas.1016799108 |
| [17] | SCHMIDT M H, THIES C, NENTWIG W, et al. Contrasting responses of arable spiders to the landscape matrix at different spatial scales[J]. Journal of Biogeography, 2008, 35(1):157-166 http://www.wanfangdata.com.cn/details/detail.do?_type=perio&id=865ef611f74046c422ef6e6763618d2b |
| [18] | TSCHARNTKE T, KLEIN A M, KRUESS A, et al. Landscape perspectives on agricultural intensification and biodiversity-ecosystem service management[J]. Ecology Letters, 2005, 8(8):857-874 doi: 10.1111/j.1461-0248.2005.00782.x |
| [19] | 尹文英, 胡圣豪, 沈韫芬, 等.中国土壤动物检索图鉴[M].北京:科学出版社, 1998 YIN W Y, HU S H, SHEN Y F, et al. Pictorical Keys to Soil Animals of China[M]. Beijing:Science Press, 1998 |
| [20] | 张治良, 赵颖, 丁秀云.沈阳昆虫原色图鉴[M].沈阳:辽宁民族出版社, 2009 ZHANG Z L, ZHAO Y, DING X Y. A Color Atlas of the Shenyang Insect[M]. Shenyang:Liaoning Nationality Publishing House, 2009 |
| [21] | TYLIANAKIS J M, TSCHARNTKE T, LEWIS O T. Habitat modification alters the structure of tropical host-parasitoid food webs[J]. Nature, 2007, 445(7124):202-205 doi: 10.1038/nature05429 |
| [22] | BANA?EK-RICHTER C, CATTIN M L, BERSIER L F. Sampling effects and the robustness of quantitative and qualitative food-web descriptors[J]. Journal of Theoretical Biology, 2004, 226(1):23-32 http://www.wanfangdata.com.cn/details/detail.do?_type=perio&id=bda84004e7a70f8097d924cbed17fe0c |
| [23] | GAGIC V, TSCHARNTKE T, DORMANN C F, et al. Food web structure and biocontrol in a four-trophic level system across a landscape complexity gradient[J]. Proceedings of the Royal Society B:Biological Sciences, 2011, 278(1720):2946-2953 doi: 10.1098/rspb.2010.2645 |
| [24] | CURTSDOTTER A, BANKS H T, BANKS J E, et al. Ecosystem function in predator-prey food webs-Confronting dynamic models with empirical data[J]. Journal of Animal Ecology, 2019, 88(2):196-210 doi: 10.1111/1365-2656.12949/abstract |
| [25] | DASSOU A G, TIXIER P. Response of pest control by generalist predators to local-scale plant diversity:A meta-analysis[J]. Ecology and Evolution, 2016, 6(4):1143-1153 doi: 10.1002/ece3.1917 |
| [26] | MARTINSON H M, FAGAN W F. Trophic disruption:A meta-analysis of how habitat fragmentation affects resource consumption in terrestrial arthropod systems[J]. Ecology Letters, 2014, 17(9):1178-1189 doi: 10.1111/ele.12305 |
| [27] | KOH I, HOLLAND J D. Grassland plantings and landscape natural areas both influence insect natural enemies[J]. Agriculture, Ecosystems & Environment, 2015, 199:190-199 http://www.wanfangdata.com.cn/details/detail.do?_type=perio&id=7bb4a0518d9ae297ff07093ef3eb93f1 |
| [28] | 赵紫华, 关晓庆, 贺达汉.农业景观结构对麦蚜寄生蜂群落组成的影响[J].应用昆虫学报, 2012, 49(1):220-228 http://www.wanfangdata.com.cn/details/detail.do?_type=perio&id=kczs201201030 ZHAO Z H, GUAN X Q, HE D H. Community composition of parasitoids and hyperparasitoids of wheat aphids in different agricultural landscapes[J]. Chinese Journal of Applied Entomology, 2012, 49(1):220-228 http://www.wanfangdata.com.cn/details/detail.do?_type=perio&id=kczs201201030 |
| [29] | 边振兴, 龚玲春, 果晓玉, 等.农业景观组成对玉米螟天敌数量的影响[J].中国生态农业学报(中英文), 2019, 27(1):30-41 http://www.ecoagri.ac.cn/zgstny/ch/reader/view_abstract.aspx?file_no=2019-0104&flag=1 BIAN Z X, GONG L C, GUO X Y, et al. Effect of agricultural landscape composition on natural enemy population of corn borer[J]. Chinese Journal of Eco-Agriculture, 2019, 27(1):30-41 http://www.ecoagri.ac.cn/zgstny/ch/reader/view_abstract.aspx?file_no=2019-0104&flag=1 |
| [30] | 尤民生, 刘雨芳, 侯有明.农田生物多样性与害虫综合治理[J].生态学报, 2004, 24(1):117-122 http://www.wanfangdata.com.cn/details/detail.do?_type=perio&id=stxb200401018 YOU M S, LIU Y F, HOU Y M. Biodiversity and integrated pest management in agroecosystems[J]. Acta Ecologica Sinica, 2004, 24(1):117-122 http://www.wanfangdata.com.cn/details/detail.do?_type=perio&id=stxb200401018 |
| [31] | 徐磊.农田景观格局对玉米田天敌与蚜虫发生的调控作用[D].北京: 中国农业科学院, 2017 http://cdmd.cnki.com.cn/Article/CDMD-82101-1017255232.htm XU L. Effects of landscape pattern on enemy occurrence and aphid biocontrol in corn fields[D]. Beijing: Chinese Academy of Agricultural Sciences, 2017 http://cdmd.cnki.com.cn/Article/CDMD-82101-1017255232.htm |
| [32] | 卢增斌, 欧阳芳, 张永生, 等.华北平原地区景观格局对麦田害螨种群数量的影响[J].生态学报, 2016, 36(14):4447-4455 http://www.wanfangdata.com.cn/details/detail.do?_type=perio&id=stxb201614025 LU Z B, OUYANG F, ZHANG Y S, et al. Impacts of landscape patterns on populations of the wheat mites, Petrobia latens (Müller) and Penthaleus major (Duges), in the North China Plain[J]. Acta Ecologica Sinica, 2016, 36(14):4447-4455 http://www.wanfangdata.com.cn/details/detail.do?_type=perio&id=stxb201614025 |
| [33] | 李子晗.黄河下游典型农区不同尺度景观异质性对中小型土壤动物群落的影响[D].郑州: 河南大学, 2016 http://cdmd.cnki.com.cn/Article/CDMD-10475-1016207384.htm LI Z H. Effects of multi-scale landscape heterogeneity on soil meso-and microfaunal communities in typical regions of the lower reaches of the Yellow River[D]. Zhengzhou: Henan University, 2016 http://cdmd.cnki.com.cn/Article/CDMD-10475-1016207384.htm |
