王会肖,,
董宇轩
北京师范大学水科学研究院/城市水循环及海绵城市技术北京市重点实验室 北京 100875
基金项目: 国家自然科学基金项目41371043
国家自然科学基金项目51779009
详细信息
作者简介:赵茹欣, 研究方向为水文水资源及气候变化。E-mail:zhaorx324@163.com
通讯作者:王会肖, 主要研究方向为农业水文水资源。E-mail:huixiaowang@bnu.edu.cn
中图分类号:S162.5+3计量
文章访问数:517
HTML全文浏览量:10
PDF下载量:658
被引次数:0
出版历程
收稿日期:2019-10-25
录用日期:2020-02-01
刊出日期:2020-04-01
Impact of climate change on grain yield and its trend across Guanzhong region
ZHAO Ruxin,WANG Huixiao,,
DONG Yuxuan
College of Water Sciences, Beijing Normal University/Beijing Key Laboratory of Urban Hydrological Cycle and Sponge City Technology, Beijing 100875, China
Funds: the National Natural Science Foundation of China41371043
the National Natural Science Foundation of China51779009
More Information
Corresponding author:WANG Huixiao, E-mail:huixiaowang@bnu.edu.cn
摘要
HTML全文
图
参考文献
相关文章
施引文献
资源附件
访问统计
摘要
摘要:以增温为主的气候变化对粮食产量具有显著影响。本文利用关中地区1983—2016年的站点气象要素、粮食产量统计数据和跨部门影响模型比较计划(Intersectoral Impact Model Intercomparison Project,ISIMIP)中4个全球气候模式2021—2050年降水、气温输出结果,采用突变分析、趋势分析和敏感性分析等方法,从粮食单产、气候产量和气候生产潜力等方面系统分析了我国主要粮食产地之一的陕西关中粮食产量对气候变化的响应特征。结果表明:1)1983—2016年,关中地区年平均气温呈显著上升趋势,升温速率为0.05℃·a-1(P < 0.01),其中,最高气温的上升起主要作用;年降水量则以-1 mm·a-1的速率呈下降趋势,但不显著。2)关中地区多年平均粮食单产为3 599 kg·hm-2,且逐年波动上升,速率为57.17 kg·hm-2·a-1(P < 0.001)。关中多地的气候产量与气温呈正相关,气温的升高一定程度上促进了关中气候产量的增加,但并不显著(平均增加率为0.85 kg·hm-2·a-1)。渭河关中地区多年以来的气候生产潜力为7 000~12 000 kg·hm-2,受气温波动的影响,1995年后的平均气候生产潜力高于1995年之前,是整个研究时段气候生产潜力呈现增加趋势的主要时期。3)未来30年里(2021—2050年),关中地区在RCP2.6情景下的平均气候生产潜力略高于RCP6.0情景,但前者的生产潜力呈逐年下降趋势,后者则表现出逐年上升趋势。关中地区的作物对气候资源的利用空间还很大,且气候变化对关中粮食产量具有促进作用,但此正向作用并不是持续不变的。
关键词:气候变化/
粮食产量/
气候生产潜力/
全球气候模式/
关中地区
Abstract:Climate change dominated by warming has a significant impact on grain yield. From an examination of grain yield, climatic yield and climate potential productivity (CPP), this paper systematically analyzed the response of grain yield to climate change in Guanzhong, Shaanxi, one of China's main food-producing areas. Datasets were climate variables at 8 meteorological stations, grain yield statistics from Guanzhong region during 1983-2016, and the precipitation and temperature simulation results from 4 global climate models of the Intersectoral Impact Model Intercomparison Project for 2021-2050. Mutation analysis, trend analysis, and sensitivity analysis were all used in the study. The results showed that the annual average temperature of Guanzhong region was increasing significantly at the rate of 0.05 ℃·a-1, and a significant increase in the maximum temperature was contributing most to this trend. Meanwhile, annual average precipitation showed a decreasing trend at the rate of -1 mm·a-1 but was not significant. During 1983-2016, the average annual grain yield of Guanzhong region was 3 599 kg·hm-2. Although showing fluctuations, it increased at the rate of 57.17 kg·hm-2·a-1 (P < 0.001). There was a positive correlation between the climatic yield and temperature in many parts of Guanzhong. The increase in temperature had promoted an increase in climatic yield in Guanzhong to a certain extent, but not significantly (the increase was 0.85 kg·hm-2·a-1 and P>0.05). The CPP of Guanzhong region ranged between 7 000-12 000 kg·hm-2 over 34 years. Due to the fluctuations in temperature, the average CPP after 1995 was higher than that before 1995, which meant that the change in CPP after 1995 was the main driving source of the increasing trend of CPP during the whole study period. During 2021-2050, the average CPP of Guanzhong region under RCP 2.6 scenario will be higher than that of RCP 6.0. However, the CPP decreases under the RCP 2.6 scenario but increases under the RCP 6.0 scenario. There is a plenty room for promotion of climate resources used by crops in Guanzhong region, and climate change has had a positive effect on the grain yield in Guanzhong, but this effect will not persist.
Key words:Climate change/
Grain yield/
Climate potential productivity/
Global climate model/
Guanzhong region
HTML全文
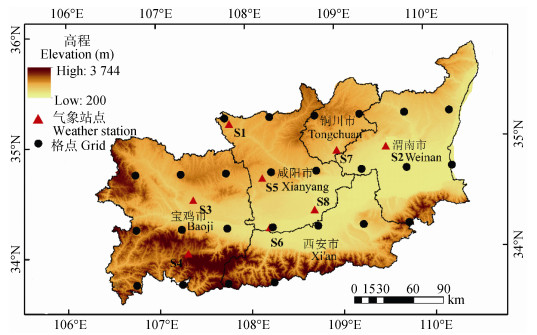
图1关中地区及气象站点和格点地理位置
Figure1.Location of Guanzhong region, weather stations and grids
 下载: 全尺寸图片幻灯片
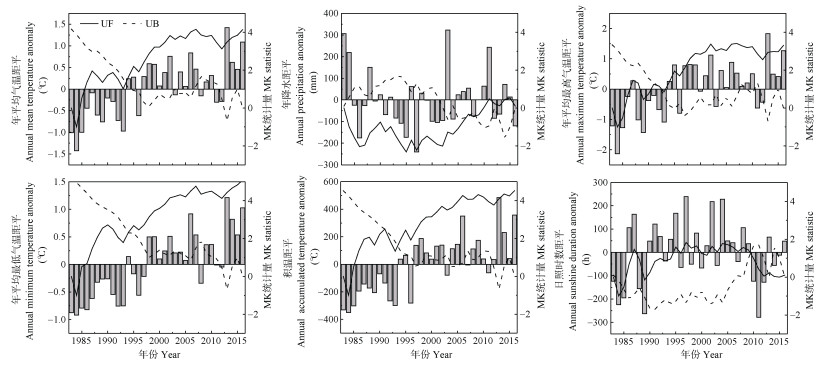
图21983—2016年关中地区气候要素随时间变化特征
Figure2.Changes of climate variables of Guanzhong region from 1983 to 2016
下载: 全尺寸图片幻灯片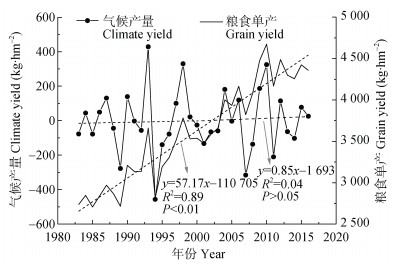
图31983—2016年关中地区粮食单产及气候产量随时间变化曲线
Figure3.Variation curves of grain yield and climate yield in Guanzhong region from 1983 to 2016
下载: 全尺寸图片幻灯片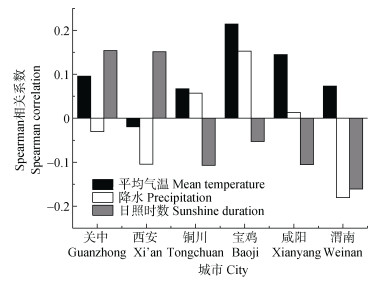
图4关中地区各市气候要素与气候产量的相关性
Figure4.Correlation between climate variables and climate yield in each city of Guanzhong region
下载: 全尺寸图片幻灯片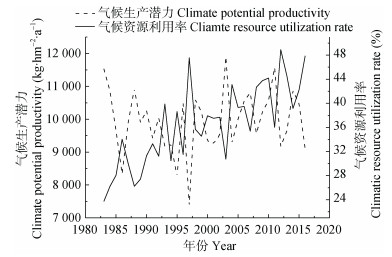
图51983—2016年关中气候生产潜力及气候资源利用率的变化
Figure5.Changes of climate potential productivity and climate resource utilization rate in Guanzhong region from 1983 to 2016
下载: 全尺寸图片幻灯片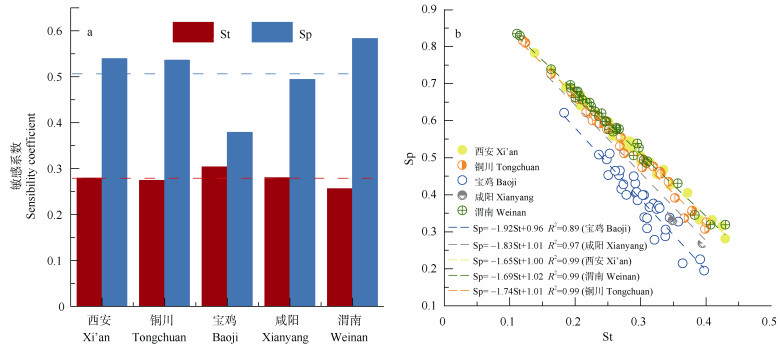
图6关中地区各市气候生产潜力对气温和降雨的敏感性及其相互关系
St:对气温的敏感系数; Sp:对降雨的敏感系数。
Figure6.Sensitivity of climate potential productivity to temperature and precipitation and their correlation in each city of Guanzhong region
St: sensitivity coefficient to temperature; Sp: sensitivity coefficient to precipitation.
下载: 全尺寸图片幻灯片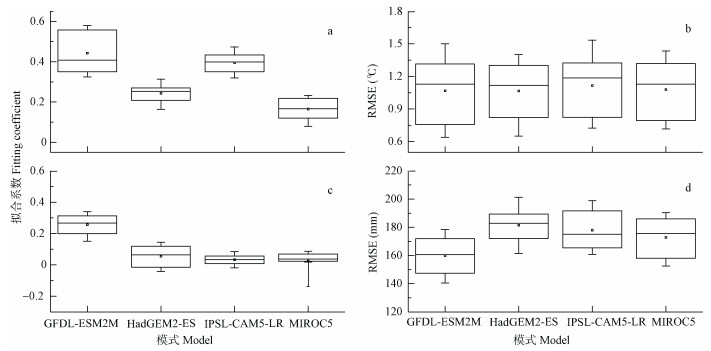
图7关中地区气温(a, b)和降水(c, d)的不同气候模式历史模拟序列与观测数据的比较
图a和图c为一元线性回归拟合系数。
Figure7.Comparison between historical simulation results by different climate models and observed data of temperature (a, b) and precipitation (c, d) in Guanzhong region
Figure a and c show fitting coefficients of linear equations.
下载: 全尺寸图片幻灯片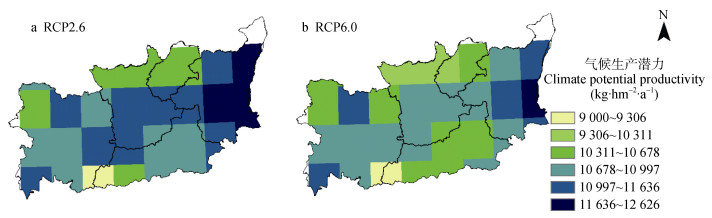
图8RCP2.6和RCP6.0情景下关中地区未来气候生产潜力的空间分布
Figure8.Spatial distribution of future climate potential productivity in Guanzhong region under RCP2.6 and RCP6.0 scenarios
下载: 全尺寸图片幻灯片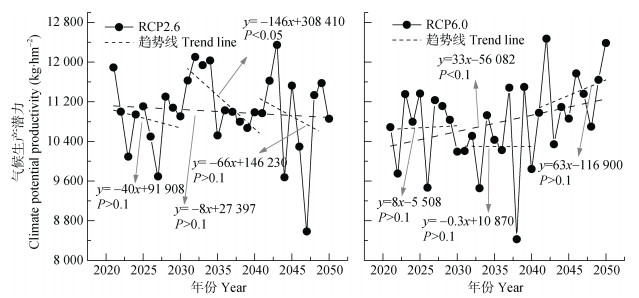
图9RCP2.6和RCP6.0情景下关中地区未来气候生产潜力的时间变化
Figure9.Time variation of future climate potential productivity in Guanzhong region under RCP2.6 and RCP6.0 scenarios
下载: 全尺寸图片幻灯片表1关中地区气象站点信息
Table1.Information of weather stations of Guanzhong region
| 序号 No. | 站台号 Station number | 站名 Station name | 纬度 Latitude (°N) | 经度 Longitude (°E) | 高程 Elevation (m) |
| S1 | 53929 | 长武Changwu | 35.20 | 107.80 | 1 206.5 |
| S2 | 53948 | 蒲城Pucheng | 34.95 | 109.58 | 499.2 |
| S3 | 57025 | 凤翔Fengxiang | 34.52 | 107.38 | 781.1 |
| S4 | 57028 | 太白Taibai | 34.03 | 107.32 | 1 543.6 |
| S5 | 57030 | 永寿Yongshou | 34.70 | 108.15 | 994.6 |
| S6 | 57034 | 武功Wugong | 34.25 | 108.22 | 447.8 |
| S7 | 57037 | 耀县Yaoxian | 34.93 | 108.98 | 710.0 |
| S8 | 57048 | 秦都Qindu | 34.40 | 108.72 | 472.8 |
下载: 导出CSV表24个全球气候模式的相关信息统计表
Table2.Descriptions of the 4 global circulation models used in this study
| 模式名称 Model name | 机构缩写 Institute acronyms | 机构全称 Institute full name |
| GFDL-ESM2M | NOAA GFDL | 美国国家海洋与大气管理局和美国地球物理流体动力学实验室 National Oceanic and Atmospheric Administration, U.S. Department of Commerce; U.S. Geophysical Fluid Dynamics Laboratory |
| HadGEM2-ES | MOHC (additional realizations by INPE) | 英国气象局哈德利中心和西班牙国家气象局 Met Office Hadley Centre and Instituto Nacional de Pesquisas Espaciais |
| IPSL-CAM5-LR | IPSL | 法国皮埃尔西蒙拉普拉斯研究所 Institute Pierre-Simon Laplace |
| MIROC5 | MIROC | 日本海洋与地球科学技术厅、大气和海洋研究所(东京大学)和国家环境研究所 Japan Agency for Marine-Earth Science and Technology, Atmosphere and Ocean Research Institute (University of Tokyo), and National Institute for Environmental Studies |
下载: 导出CSV表31983—2016年关中地区各气象要素的变化趋势及显著性
Table3.Trends and significance of climate variables of Guanzhong region from 1983 to 2016
| 平均气温 Mean temperature (℃?a–1) | 降水 Precipitation (mm?a–1) | 最高气温 Maximum temperature (℃?a–1) | 最低气温 Minimum temperature (℃?a–1) | 日照时数 Sunshine duration (h?a–1) | 积温(≥10 ℃) Accumulated temperature (≥10 ℃) (℃?a–1) | |
| 趋势Trend | 0.046** | –1.011 | 0.055** | 0.048** | 1.14 | 16.00** |
| **表示通过P < 0.01显著性检验。** represents significance at P < 0.01 | ||||||
下载: 导出CSV表41983—2016年关中地区各市气候要素变化特征
Table4.Spatial characteristics of climate variables in each city of Guanzhong region from 1983 to 2016
| 城市City | 平均气温Mean temperature | 降水Precipitation | 日照时数Sunshine duration | ||||||||||||
| 平均值 Mean (℃) | 趋势 Trend (℃?a–1) | 突变年份 Abrupt year | 平均值 Mean (mm) | 趋势 Trend (mm?a–1) | 突变年份 Abrupt year | 平均值 Mean (h) | 趋势 Trend (h?a–1) | 突变年份 Abrupt year | |||||||
| 西安Xi’an | 13.57 | 0.03** | 1992 | 589.65 | -0.58 | 2005 | 1 744.94 | -1.32 | 1997 | ||||||
| 铜川Tongchuan | 12.83 | 0.04** | 1993 | 537.68 | -1.11 | 2006 | 2 203.12 | 0.68 | |||||||
| 宝鸡Baoji | 10.47 | 0.05** | 1995 | 626.61 | -0.42 | 2003 | 1 925.53 | 1.07 | 1999 | ||||||
| 咸阳Xianyang | 11.94 | 0.04** | 1994 | 563.57 | -0.59 | 2009 | 2 011.74 | 4.00 | 1990 | ||||||
| 渭南Weinan | 14.02 | 0.07** | 1995 | 511.58 | -2.35 | 2 199.82 | 1.27 | ||||||||
| **表示通过P < 0.01显著性检验。** represents significance at P < 0.01 | |||||||||||||||
下载: 导出CSV表51983—2016年关中地区各市的作物产量变化趋势
Table5.Trend of grain yield in each city of Guanzhong region from 1983 to 2016
| 城市City | 粮食单产Grain yield | 气候产量Climate yield | ||||
| 均值 Mean (kg?hm–2) | 趋势 Trend (kg?hm–2?a–1) | 均值 Mean (kg?hm–2) | 趋势 Trend (kg?hm–2?a–1) | |||
| 西安Xi’an | 4 217 | 63.15*** | 7.32 | 1.67 | ||
| 铜川Tongchuan | 2 961 | 69.21*** | 321.97 | 8.98* | ||
| 宝鸡Baoji | 3 505 | 65.84*** | -13.98 | 1.60 | ||
| 咸阳Xianyang | 3 949 | 65.82*** | 428.88 | 9.51* | ||
| 渭南Weinan | 3 372 | 53.99*** | 166.62 | 5.81 | ||
| *和***分别表示趋势在P < 0.05和P < 0.001水平显著。* and *** represent significant trends at P < 0.05 and P < 0.001 levels, respectively. | ||||||
下载: 导出CSV表61983—2016年关中地区各市气候生产潜力在不同时间段的变化趋势及显著性
Table6.Trend and significance of climate potential productivity in each city of Guanzhong region at different periods from 1983 to 2016
| 城市 City | 1983—1995 | 1996—2016 | 1983—2016 | |||||
| 均值 Mean (kg·hm-2) | 趋势 Trend (kg·hm-2·a-1) | 均值 Mean (kg·hm-2) | 趋势 Trend (kg·hm-2·a-1) | 均值 Mean (kg·hm-2) | 趋势 Trend (kg·hm-2·a-1) | |||
| 关中Guanzhong | 9 809 | -143.38* | 10 025 | 30.42 | 9 942 | 8.16 | ||
| 西安Xi’an | 10 036 | -199.87* | 10 231 | 53.21 | 10 156 | 9.55 | ||
| 铜川Tongchuan | 9 769 | -156.28 | 9 956 | 8.45 | 9 884 | 1.11 | ||
| 宝鸡Baoji | 9 932 | -68.68 | 10 140 | 30.11 | 10 060 | 11.94 | ||
| 咸阳Xianyang | 9 753 | -173.33* | 10 019 | 39.68 | 9 917 | 10.78 | ||
| 渭南Weinan | 9 830 | -160.07 | 9 887 | 15.97 | 9 865 | -2.80 | ||
| *表示趋势在P < 0.05水平显著。* represents significant trend at P < 0.05 level. | ||||||||
下载: 导出CSV参考文献
| [1] | DAI A G. Increasing drought under global warming in observations and models[J]. Nature Climate Change, 2013, 3:52-58 http://www.wanfangdata.com.cn/details/detail.do?_type=perio&id=e0d1e2f229d15bc242dff70ca5c4844e |
| [2] | GAY C, ESTRADA F, CONDE C, et al. Potential impacts of climate change on agriculture:A case of study of coffee production in Veracruz, Mexico[J]. Climatic Change, 2006, 79(3/4):259-288 http://cn.bing.com/academic/profile?id=0a88a0ddb62e9eb5699204150e1ee942&encoded=0&v=paper_preview&mkt=zh-cn |
| [3] | 周广胜.气候变化对中国农业生产影响研究展望[J].气象与环境科学, 2015, 38(1):80-94 http://d.old.wanfangdata.com.cn/Periodical/hnqx201501012 ZHOU G S. Research prospect on impact of climate change on agricultural production in China[J]. Meteorological and Environmental Sciences, 2015, 38(1):80-94 http://d.old.wanfangdata.com.cn/Periodical/hnqx201501012 |
| [4] | 郑亚楠, 张凤荣, 谢臻, 等.中国粮食生产时空演变规律与耕地可持续利用研究[J].世界地理研究, 2019, 28(6):120-131 http://d.old.wanfangdata.com.cn/Periodical/sjdlyj201906013 ZHENG Y N, ZHANG F R, XIE Z, et al. Research on spatial-temporal evolution of grain production and sustainable use of cultivated land in China[J]. World Regional Studies, 2019, 28(6):120-131 http://d.old.wanfangdata.com.cn/Periodical/sjdlyj201906013 |
| [5] | 刘立涛, 刘晓洁, 伦飞, 等.全球气候变化下的中国粮食安全问题研究[J].自然资源学报, 2018, 33(6):927-939 http://d.old.wanfangdata.com.cn/Periodical/zrzyxb201806002 LIU L T, LIU X J, LUN F, et al. Research on China's food security under global climate change background[J]. Journal of Natural Resources, 2018, 33(6):927-939 http://d.old.wanfangdata.com.cn/Periodical/zrzyxb201806002 |
| [6] | HAKIM M A, HOSSAIN A, DA SILVA J A T, et al. Protein and starch content of 20 wheat (Triticum aestivum L.) genotypes exposed to high temperature under late sowing conditions[J]. Journal of Scientific Research, 2012, 4(2):477-489 |
| [7] | HOSSAIN A, LOZOVSKAYA M V, ZVOLINSKY V P, et al. Effect of soil and climatic conditions on phenology of spring wheat varieties in the northern Bangladesh[J]. Natural Science:Journal Fund Applied Science, 2012, 2(39):78-86 |
| [8] | 米娜, 张玉书, 蔡福, 等.干旱胁迫对玉米物候及产量组成的影响及模拟研究[J].中国生态农业学报(中英文), 2019, 27(12):1779-1788 http://www.ecoagri.ac.cn/zgstny/ch/reader/view_abstract.aspx?file_no=2019-1201&flag=1 MI N, ZHANG Y S, CAI F, et al. Effect of drought stress on maize phenology and yield components and its simulation[J]. Chinese Journal of Eco-Agriculture, 2019, 27(12):1779-1788 http://www.ecoagri.ac.cn/zgstny/ch/reader/view_abstract.aspx?file_no=2019-1201&flag=1 |
| [9] | 张荣荣, 宁晓菊, 秦耀辰, 等. 1980年以来河南省主要粮食作物产量对气候变化的敏感性分析[J].资源科学, 2018, 40(1):137-149 http://d.old.wanfangdata.com.cn/Periodical/zykx201801013 ZHANG R R, NING X J, QIN Y C, et al. Analysis of sensitivity of main grain crops yield to climate change since 1980 in Henan Province[J]. Resources Science, 2018, 40(1):137-149 http://d.old.wanfangdata.com.cn/Periodical/zykx201801013 |
| [10] | 张雪琪, 满苏尔·沙比提, 马国飞.叶尔羌河平原绿洲气候变化对粮食生产的影响[J].干旱区研究, 2018, 35(3):705-712 http://d.old.wanfangdata.com.cn/Periodical/ghqyj201803025 ZHANG X Q, MANSUR SHABITI, MA G F. Effects of climate change on grain production in plain oasis in the Yarkant River basin[J]. Arid Zone Research, 2018, 35(3):705-712 http://d.old.wanfangdata.com.cn/Periodical/ghqyj201803025 |
| [11] | 李彩侠, 李俏, 孙天一, 等.气候变化对黑龙江省主要农作物产量的影响[J].自然灾害学报, 2014, 23(6):200-208 http://www.wanfangdata.com.cn/details/detail.do?_type=perio&id=zrzhxb201406025 LI C X, LI Q, SUN T Y, et al. Effect of climate change on major crops yield in Heilongjiang Province[J]. Journal of Natural Disasters, 2014, 23(6):200-208 http://www.wanfangdata.com.cn/details/detail.do?_type=perio&id=zrzhxb201406025 |
| [12] | 刘春琼, 刘萍, 吴生虎, 等.基于DCCA方法分析气候变化对四川省粮食产量的影响[J].中国农业气象, 2016, 37(1):43-50 http://d.old.wanfangdata.com.cn/Periodical/zgnyqx201601006 LIU C Q, LIU P, WU S H, et al. Impacts of climate change on grain output in Sichuan Based on the Detrended Cross-Correlation Analysis method[J]. Chinese Journal of Agrometeorology, 2016, 37(1):43-50 http://d.old.wanfangdata.com.cn/Periodical/zgnyqx201601006 |
| [13] | 刘忠, 黄峰, 李保国.基于经验模态分解的中国粮食单产波动特征及影响因素[J].农业工程学报, 2015, 31(2):7-13 http://d.old.wanfangdata.com.cn/Periodical/nygcxb201502002 LIU Z, HUANG F, LI B G. Analysis on characteristics and influential factors of grain yield fluctuation in China based on empirical mode decomposition[J]. Transactions of the Chinese Society of Agricultural Engineering, 2015, 31(2):7-13 http://d.old.wanfangdata.com.cn/Periodical/nygcxb201502002 |
| [14] | 王亚飞, 廖顺宝.气候变化对粮食产量影响的研究方法综述[J].中国农业资源与区划, 2018, 39(12):54-63 http://d.old.wanfangdata.com.cn/Periodical/zgnyzyyqh201812009 WANG Y F, LIAO S B. Impacts of climate change on grain yield:A review of research methods[J]. Chinese Journal of Agricultural Resources and Regional Planning, 2018, 39(12):54-63 http://d.old.wanfangdata.com.cn/Periodical/zgnyzyyqh201812009 |
| [15] | 尹朝静, 李谷成, 葛静芳.粮食安全:气候变化与粮食生产率增长——基于HP滤波和序列DEA方法的实证分析[J].资源科学, 2016, 38(4):665-675 http://d.old.wanfangdata.com.cn/Periodical/dyyjykf201506026 YIN C J, LI G C, GE J F. Food security, climate change and grain productivity growth based on HP filter and sequential DEA methods[J]. Resources Science, 2016, 38(4):665-675 http://d.old.wanfangdata.com.cn/Periodical/dyyjykf201506026 |
| [16] | 赵俊芳, 孔祥娜, 姜月清, 等.基于高时空分辨率的气候变化对全球主要农区气候生产潜力的影响评估[J].生态环境学报, 2019, 28(1):1-6 http://d.old.wanfangdata.com.cn/Periodical/tryhj201901001 ZHAO J F, KONG X N, JIANG Y Q, et al. Impact assessment of climate change on climatic potential productivity in global major agricultural regions based on high spatial and temporal resolution data[J]. Ecology and Environmental Sciences, 2019, 28(1):1-6 http://d.old.wanfangdata.com.cn/Periodical/tryhj201901001 |
| [17] | 刘新, 刘林春, 尤莉, 等.内蒙古地区气候生产潜力变化及其敏感性分析[J].中国农业气象, 2018, 39(8):531-537 http://d.old.wanfangdata.com.cn/Periodical/zgnyqx201808005 LIU X, LIU L C, YOU L, et al. Characteristics and sensitivity analysis of climate production potential in Inner Mongolia[J]. Chinese Journal of Agrometeorology, 2018, 39(8):531-537 http://d.old.wanfangdata.com.cn/Periodical/zgnyqx201808005 |
| [18] | 董思, 任志远, 张翀, 等.陕西省气候变化及其气候生产潜力的时空变化[J].中国农业大学学报, 2016, 21(8):142-149 http://d.old.wanfangdata.com.cn/Periodical/zgnydxxb201608019 DONG S, REN Z Y, ZHANG C, et al. Spatial-temporal changing characteristics of climate and its potential productivity in Shaanxi Province[J]. Journal of China Agricultural University, 2016, 21(8):142-149 http://d.old.wanfangdata.com.cn/Periodical/zgnydxxb201608019 |
| [19] | 卢燕宇, 孙维, 唐为安, 等.气候变化背景下安徽省冬小麦气候生产潜力和胁迫风险研究[J].中国生态农业学报(中英文), 2020, 28(1):17-30 http://www.ecoagri.ac.cn/zgstny/ch/reader/view_abstract.aspx?file_no=2020-0103&flag=1 LU Y Y, SUN W, TANG W A, et al. Climatic potential productivity and stress risk of winter wheat under the background of climate change in Anhui Province[J]. Chinese Journal of Eco-Agriculture, 2020, 28(1):17-30 http://www.ecoagri.ac.cn/zgstny/ch/reader/view_abstract.aspx?file_no=2020-0103&flag=1 |
| [20] | FRIELER K, LANGE S, PIONTEK F, et al. Assessing the impacts of 1.5℃ global warming-Simulation protocol of the Inter-Sectoral Impact Model Intercomparison Project (ISIMIP2b)[J]. Geoscientific Model Development, 2017, 10(12):4321-4345 |
| [21] | 王书霞, 张利平, 李意, 等.气候变化情景下澜沧江流域极端洪水事件研究[J].气候变化研究进展, 2019, 15(1):23-32 http://d.old.wanfangdata.com.cn/Periodical/qhbhyjjz201901003 WANG S X, ZHANG L P, LI Y, et al. Extreme flood in the Lancang River Basin under climate change[J]. Climate Change Research, 2019, 15(1):23-32 http://d.old.wanfangdata.com.cn/Periodical/qhbhyjjz201901003 |
| [22] | 杨春艳, 沈渭寿, 李海东. 1985-2010年西藏粮食产量对气候和耕地变化的响应[J].农业工程学报, 2015, 31(17):261-269 http://d.old.wanfangdata.com.cn/Periodical/nygcxb201517035 YANG C Y, SHEN W S, LI H D. Response of grain yield in Tibet to climate and cultivated land change during 1985-2010[J]. Transactions of the Chinese Society of Agricultural Engineering, 2015, 31(17):261-269 http://d.old.wanfangdata.com.cn/Periodical/nygcxb201517035 |
| [23] | LI C, WANG R H. Recent changes of precipitation in Gansu, Northwest China:An index-based analysis[J]. Theoretical and Applied Climatology, 2017, 129:397-412 http://d.old.wanfangdata.com.cn/Periodical/dqhjxb201802006 |
| [24] | CHEN J, LI Q L, NIU J, et al. Regional climate change and local urbanization effects on weather variables in Southeast China[J]. Stochastic Environmental Research and Risk Assessment, 2011, 25(4):555-565 http://www.wanfangdata.com.cn/details/detail.do?_type=perio&id=1b6a5be627173b1b7a14468c0221a715 |
| [25] | JIANG S Z, LIANG C, CUI N B, et al. Impacts of climatic variables on reference evapotranspiration during growing season in Southwest China[J]. Agricultural Water Management, 2019, 216:365-378 http://www.wanfangdata.com.cn/details/detail.do?_type=perio&id=c5f66a2351ed25f0332e683047de6687 |
| [26] | 董晴晴, 王会肖. 60年来渭河关中地区气温与降水变化及其原因[J].南水北调与水利科技, 2016, 14(6):33-38 http://d.old.wanfangdata.com.cn/Periodical/nsbdyslkj201606006 DONG Q Q, WANG H X. Variation and reason analysis of temperature and precipitation of Weihe River in Guanzhong area in the last 60 years[J]. South-to-North Water Transfers and Water Science & Technology, 2016, 14(6):33-38 http://d.old.wanfangdata.com.cn/Periodical/nsbdyslkj201606006 |
| [27] | 刘政鸿.陕西省近50年来降水量时空变化特征分析[J].水土保持研究, 2015, 22(2):107-112 http://d.old.wanfangdata.com.cn/Periodical/stbcyj201502021 LIU Z H. Analysis of spatiotemporal variation characteristics of precipitation in the past five decades in Shaanxi Province[J]. Research of Soil and Water Conservation, 2015, 22(2):107-112 http://d.old.wanfangdata.com.cn/Periodical/stbcyj201502021 |
| [28] | 宁向玲, 董婕, 延军平.陕西省近60a气温时空变化特征[J].干旱气象, 2011, 29(4):455-460 http://d.old.wanfangdata.com.cn/Periodical/ghqx201104010 NING X L, DONG J, YAN J P. Spatial and temporal variation of air temperature in recent 60 years in Shaanxi Province[J]. Journal of Arid Meteorology, 2011, 29(4):455-460 http://d.old.wanfangdata.com.cn/Periodical/ghqx201104010 |
| [29] | 赵彦茜, 肖登攀, 柏会子, 等.中国作物物候对气候变化的响应与适应研究进展[J].地理科学进展, 2019, 38:224-235 http://d.old.wanfangdata.com.cn/Periodical/dlkxjz201902006 ZHAO Y X, XIAO D P, BAI H Z, et al. Research progress on the response and adaptation of crop phenology to climate change in China[J]. Progress in Geography, 2019, 38(2):224-235 http://d.old.wanfangdata.com.cn/Periodical/dlkxjz201902006 |
| [30] | SCHLENKER W, ROBERTS M J. Nonlinear temperature effects indicate severe damages to U.S. crop yields under climate change[J]. Proceedings of the National Academy of Sciences of the United States of America, 2009, 106(37):15594-15598 http://www.wanfangdata.com.cn/details/detail.do?_type=perio&id=PubMed000002284091 |
| [31] | 韩智博, 张宝庆, 田杰, 等.基于CCSM4气候模式的未来气候变化对黑河绿洲玉米产量影响预测[J].灌溉排水学报, 2018, 37(10):108-115 http://www.wanfangdata.com.cn/details/detail.do?_type=perio&id=ggps201810017 HAN Z B, ZHANG B Q, TIAN J, et al. Yield of the maize in Heihe oasis under climate change in northwest China predicted based on the CCSM4 climate model[J]. Journal of Irrigation and Drainage, 2018, 37(10):108-115 http://www.wanfangdata.com.cn/details/detail.do?_type=perio&id=ggps201810017 |
| [32] | 张延, 任小川, 赵英, 等.未来气候变化对关中地区冬小麦耗水和产量的影响模拟[J].干旱地区农业研究, 2016, 34(1):220-228 http://d.old.wanfangdata.com.cn/Periodical/ghdqnyyj201601034 ZHANG Y, REN X C, ZHAO Y, et al. Impact and simulation of climate change on water consumption and yield of winter-wheat in Guanzhong Region[J]. Agricultural Research in the Arid Areas, 2016, 34(1):220-228 http://d.old.wanfangdata.com.cn/Periodical/ghdqnyyj201601034 |
| [33] | 谢立勇, 李悦, 徐玉秀, 等.气候变化对农业生产与粮食安全影响的新认知[J].气候变化研究进展, 2014, 10(4):235-239 http://d.old.wanfangdata.com.cn/Periodical/qhbhyjjz201404001 XIE L Y, LI Y, XU Y X, et al. Updated understanding on the impacts of climate change on food production and food security[J]. Progressus Inquisitiones de Mutatione Climatis, 2014, 10(4):235-239 http://d.old.wanfangdata.com.cn/Periodical/qhbhyjjz201404001 |
| [34] | IPCC. Climate change 2014: Impacts, Adaptation, and Vulnerability[M/OL]. Cambridge: Cambridge University Press, 2014[2014-04-01]. http://www.oalib.com/references/19903666 |
| [35] | 李晓东, 胡爱军, 祁栋林, 等.近53年青海省气候变化与粮食产量及气候生产潜力特征[J].草业科学, 2015, 32(7):1061-1068 http://d.old.wanfangdata.com.cn/Periodical/caoyekx201507005 LI X D, HU A J, QI D L, et al. Characteristics of climate change, grain yield and climate productivity potential during last 53 years in Qinghai Province[J]. Pratacultural Science, 2015, 32(7):1061-1068 http://d.old.wanfangdata.com.cn/Periodical/caoyekx201507005 |
