刘苏峡1, 2,,,
莫兴国1, 2,
陈学娟1, 2
1.中国科学院地理科学与资源研究所陆地水循环及地表过程重点实验室 北京 100101
2.中国科学院大学资源与环境学院/中丹学院 北京 100049
基金项目: 国家重点研发计划课题2016YPC0401402
国家自然科学基金项目41471026
详细信息
作者简介:龙学智, 主要从事水文水资源研究。E-mail:longxz.15s@igsnrr.ac.cn
通讯作者:刘苏峡, 主要从事水文水资源研究。E-mail:liusx@igsnrr.ac.cn
中图分类号:K903计量
文章访问数:528
HTML全文浏览量:1
PDF下载量:300
被引次数:0
出版历程
收稿日期:2019-05-06
录用日期:2019-08-26
刊出日期:2019-12-01
Analysis of water use efficiency and driving factors in the Beijing-Tianjin-Hebei Province Plain using the Copula method
LONG Xuezhi1, 2,,LIU Suxia1, 2,,,
MO Xingguo1, 2,
CHEN Xuejuan1, 2
1. Key Laboratory of Water Cycle and Related Land Surface Processes, Institute of Geographic Sciences and Natural Resources Research, Chinese Academy of Sciences, Beijing 100101, China
2. School of Natural Resources and Environment/Sino-Danish College, University of Chinese Academy of Sciences, Beijing 100049, China
Funds: the National Key Research and Development Plan of China2016YPC0401402
the National Natural Science Foundation of China41471026
More Information
Corresponding author:LIU Suxia, E-mail:liusx@igsnrr.ac.cn
摘要
HTML全文
图
参考文献
相关文章
施引文献
资源附件
访问统计
摘要
摘要:农业是京津冀地区最主要的用水部门,提高农业用水效率有助于缓解京津冀水资源压力,实现可持续发展。基于VIP模型模拟的1980-2013年京津冀平原作物水分利用效率(WUE)、作物净初级生产力(NPP)、作物实际蒸散发(ETa),结合同期年平均气温(Tmean)、年降水量(Pre)和年日照时数(Sun),应用Copula函数理论分别建立WUE与NPP、ETa、Tmean、Pre、Sun的5组联合概率分布函数,计算各驱动因子在低、中、高取值条件下WUE大于任一特定取值的可能性(定义为WUE条件概率),探索WUE的驱动关系。结果表明:1)驱动因子NPP、ETa、Sun取值越大,WUE大于任一特定取值的可能性越大;而驱动因子Tmean和Pre取值越小,WUE大于任一特定取值的可能性越大。2)若以各驱动因子分别在高、低取值条件下的WUE条件概率的差值来反映WUE对各驱动因子大小的敏感程度,WUE对NPP的大小最为敏感,而后依次是Sun、ETa、Pre、Tmean。3)对比不同驱动因子相同取值条件下的WUE条件概率,较低的NPP会明显抑制WUE的大小,提高NPP对WUE的提升有明显的保障作用。综上所述,作物WUE同时受光合作用和蒸腾作用两个生理过程控制,较难确定光合和蒸腾对WUE的驱动关系;WUE与驱动因子的联合概率分布和条件概率分析指出,在京津冀平原可以采用在控制耗水的条件下提高NPP的策略,该策略可能比在控制产量的条件下减少耗水的策略更有效。
Abstract:Agricultural irrigation accounts for>65% of water use in the Beijing-Tianjin-Hebei Province Plain. Improving the agricultural water use efficiency will help relieve the pressure on the water resources found in the Beijing-Tianjin-Hebei Plain and promote sustainable development. Based on water use efficiency (WUE), net primary productivity (NPP), and actual evapotranspiration (ETa) from 1980 to 2013 simulated by the VIP model, combined with the annual mean air temperature (Tmean), annual precipitation (Pre), and annual sunshine duration (Sun), the Copula method was used to create five groups of joint probability distributions:WUE and NPP, ETa, Tmean, Pre, and Sun. Conditional probability was calculated based on the hypothesis that WUE was greater than any particular value under low, medium, and high value ranges of each driving factor. The findings showed that the greater the values of NPP, ETa, and Sun, the more likely was WUE to be greater than any particular value. However, the lower the values of Tmean and Pre, the more likely was WUE to be greater than any particular value. The sensitivity of WUE to variation in the value of each driving factor was reflected by the difference of the conditional probability of WUE under high and low value ranges, suggesting that WUE was most sensitive to the variation in the value of NPP followed by those of Sun, ETa, Pre, and Tmean. Comparison of the conditional probabilities of WUE under the same value conditions of NPP, ETa, Tmean, Pre, and Sun showed that a lower NPP clearly suppressed WUE and that improvement in NPP guaranteed a higher value of WUE. Crop WUE is controlled simultaneously by photosynthesis and transpiration, which makes it difficult to ascertain the driving mechanism underlying WUE. Based on the joint probability distribution determined using the Copula method and conditional probability analysis, we concluded that improving NPP when water consumption is controlled may be a more effective strategy than reducing water consumption when grain yield is controlled to adopt in the Beijing-Tianjin-Hebei Province Plain.
HTML全文
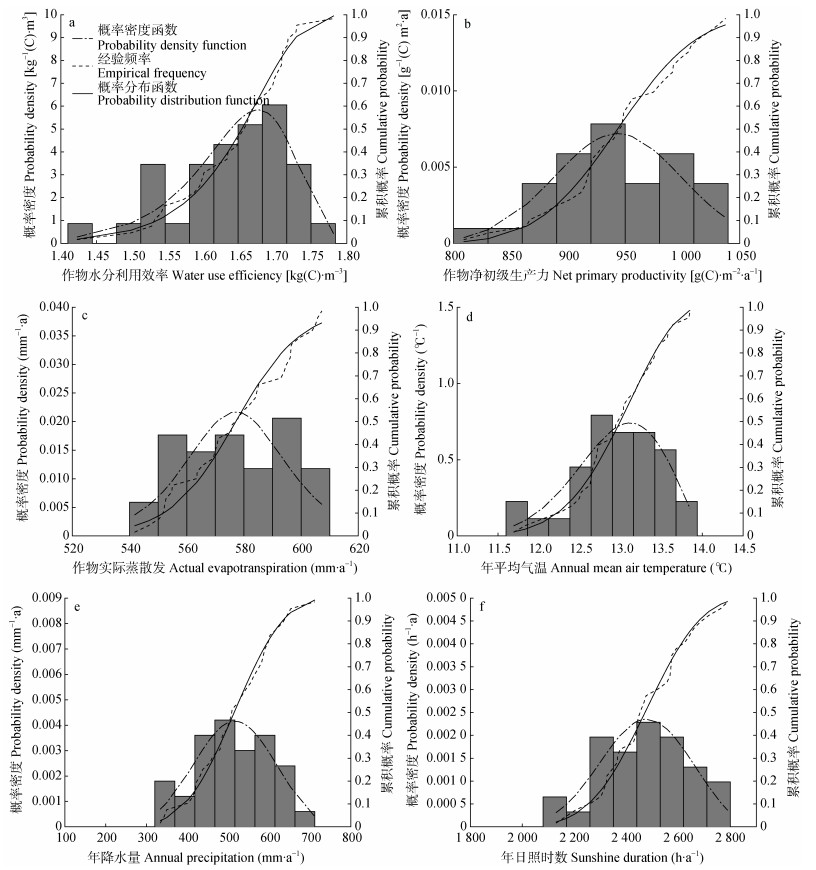
图11980—2013年研究区作物水分利用效率(a)、作物净初级生产力(b)、作物实际蒸散发(c)、年平均气温(d)、年降水量(e)和年日照时数(f)概率分布拟合情况
Figure1.The probability distribution fitting of water use efficiency (a), net primary productivity (b), actual evapotranspiration (c), annual mean air temperature (d), annual precipitation (e), and sunshine duration (f) of the Beijing-Tianjin-Hebei Plain from 1980 to 2013
 下载: 全尺寸图片幻灯片
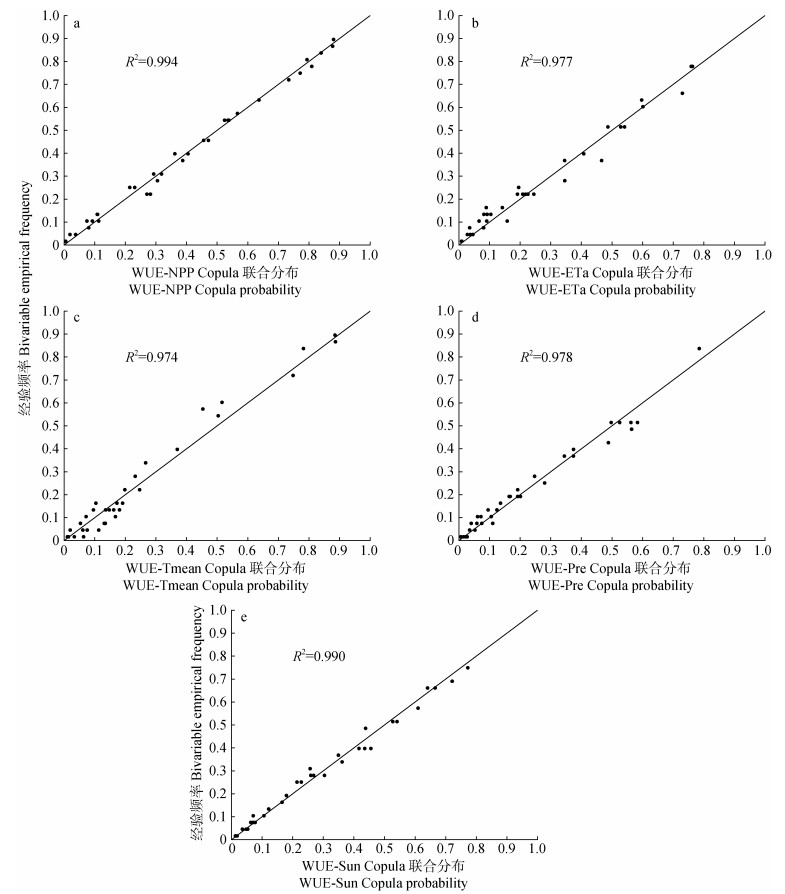
图21980—2013年研究区作物水分利用效率分别与作物净初级生产力(a)、作物实际蒸散发(b)、年平均气温(c)、年降水量(d)、年日照时数(e)的联合分布的拟合情况
WUE-NPP:作物水分利用效率和作物净初级生产力的联合分布; WUE-ETa:作物水分利用效率和作物实际蒸散发的联合分布; WUE-Tmean:作物水分利用效率和年平均气温的联合分布; WUE-Pre:作物水分利用效率和年降水量的联合分布; WUE-Sun:作物水分利用效率和年日照时数的联合分布。
Figure2.The Copula fitting of the joint probability distribution of water use efficiency and net primary productivity (a), water use efficiency and actual evapotranspiration (b), water use efficiency and annual mean air temperature (c), water use efficiency and annual precipitation (d), and water use efficiency and sunshine duration (e) of the Beijing-Tianjin-Hebei Plain from 1980 to 2013
WUE-NPP: the joint probability distribution of water use efficiency and net primary productivity. WUE-ETa: the joint probability distribution of water use efficiency and actual evapotranspiration. WUE-Tmean: the joint probability distribution of water use efficiency and annual mean air temperature. WUE-Pre: the joint probability distribution of water use efficiency and annual precipitation. WUE-Sun: the joint probability distribution of water use efficiency and sunshine duration.
下载: 全尺寸图片幻灯片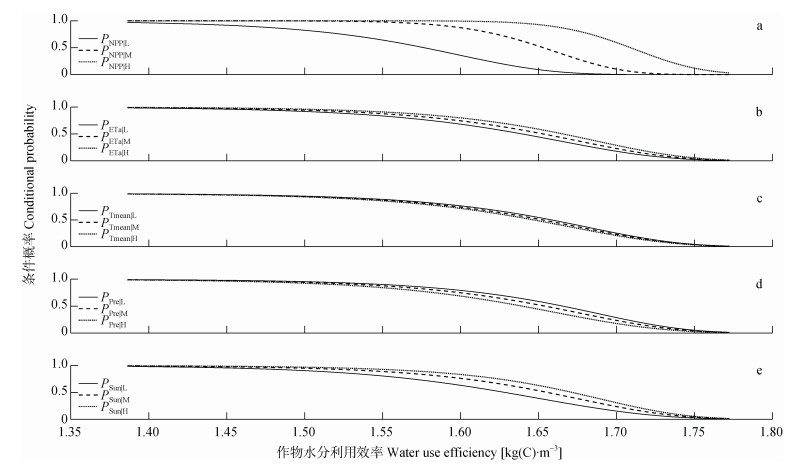
图3作物净初级生产力(NPP, a)、作物实际蒸散发(Eta, b)、年平均气温(Tmean, c)、年降水量(Pre, d)、年日照时数(Sun, e)在低(L)、中(M)、高(H)取值条件下的作物水分利用效率的条件概率分布
Figure3.The conditional probability distribution of water use efficiency under low (L), medium (M), and high (H) value conditions of net primary productivity (NPP, a), actual evapotranspiration (ETa, b), annual mean air temperature (Tmean, c), annual precipitation (Pre, d), and sunshine duration (Sun, e) respectively
PX|L, PX|M, and PX|H are the conditional probability distribution of water use efficiency under low (L), medium (M), and high (H) value conditions of net primary productivity, actual evapotranspiration, annual mean air temperature, annual precipitation, and sunshine duration.
下载: 全尺寸图片幻灯片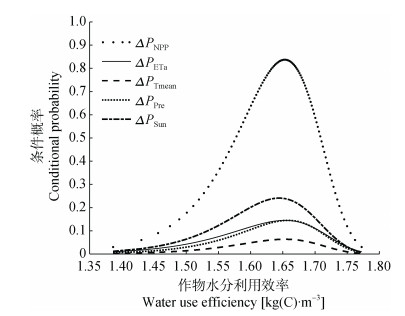
图4研究区作物水分利用效率对相关变量大小的敏感程度
$\Delta {P_{{\rm{NPP}}}}$、$\Delta {P_{{\rm{ETa}}}}$、$\Delta {P_{{\rm{Tmean}}}}$、$\Delta {P_{{\rm{Pre}}}}$、$\Delta {P_{{\rm{Sun}}}}$分别代表当作物净初级生产力(NPP)、实际蒸散发(ETa)、年平均气温(Tmean)、年降水量(Pre)、年日照时数(Sun)分别在高(H)、低(L)取值条件下作物水分利用效率条件概率差值。
Figure4.The sensitivity of water use efficiency to the value of driving factors
$\Delta {P_{{\rm{NPP}}}}$, $\Delta {P_{{\rm{ETa}}}}$, $\Delta {P_{{\rm{Tmean}}}}$, $\Delta {P_{{\rm{Pre}}}}$, $\Delta {P_{{\rm{Sun}}}}$ stands for the absolute difference of the conditional probability of water use efficiency when net primary productivity, actual evapotranspiration, annual mean air temperature, annual precipitation, and sunshine duration under high and low value condition.
下载: 全尺寸图片幻灯片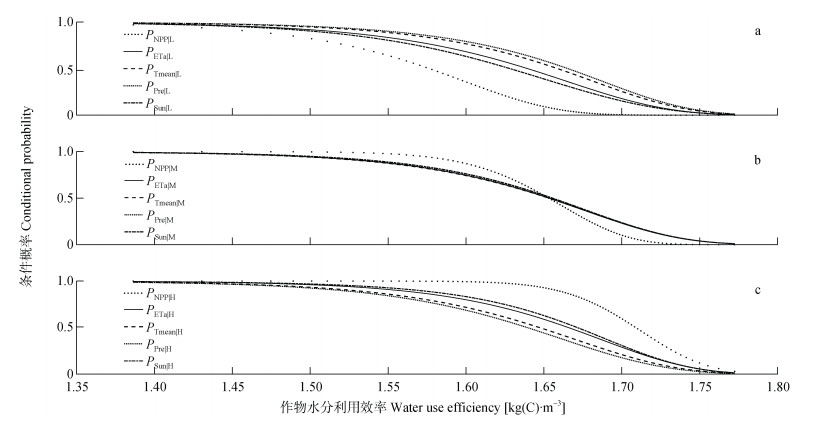
图5研究区作物水分利用效率受作物净初级生产力(NPP)、作物实际蒸散发(ETa)、年平均气温(Tmean)、年降水量(Pre)和年日照时数(Sun)在低(a)、中(b)、高(c)取值的影响对比
Figure5.The comparison of water use efficiency influenced by driving factors with low (a), medium (b), and high (c) value conditions of net primary productivity (NPP), actual evapotranspiration (ETa), annual mean air temperature (Tmean), annual precipitation (Pre), and sunshine duration (Sun)
下载: 全尺寸图片幻灯片表1Copula函数形式及参数取值范围
Table1.The Copula functions and the range of parameters
| 函数名称 Function | 数学表达式 Formular | 参数取值范围 Range of parameter |
| Gaussian | $ \int_{ - \infty }^{{\phi ^{ - 1}}{{(u)}^\phi }^{ - 1\;(v)}} {\int\limits_{ - \infty } {\frac{1}{{2{\rm{ \mathsf{ π} }}\sqrt {{\rm{1}} - {\theta ^{\rm{2}}}} }}\exp \left[ {\frac{{2\theta xy - {x^2} - {y^2}}}{{2(1 - {\theta ^2})}}} \right]dxdy} } $ | $ \theta \in [ - 1, 1]$ |
| Frank | $ - \frac{1}{\theta }{\rm{1n}}\left\{ {1 + \frac{{[\exp ( - \theta u) - 1][\exp ( - \theta v) - 1]}}{{\exp ( - \theta ) - 1}}} \right\}$ | $ \theta \in R\backslash 0$ |
| Ali-Mikhail-Haq (AMH) | $ \frac{{uv}}{{1 - \theta (1 - u)(1 - v)}}$ | $ \theta \in [ - 1, 1)$ |
| Farlie-Gumbel-Morgenstern (FGM) | $ uv[1 + \theta (1 - u)(1 - v)]$ | $ \theta \in [ - 1, 1]$ |
| Cubic | $ uv[1 + \theta (u - 1)(v - 1)(2u - 1)(2v - 1)]$ | $ \theta \in [ - 1, 2]$ |
| u和v分别为随机变量X和Y边缘分布函数, 分别表示随机变量X≤x的概率和随机变量Y≤y的概率。θ为Copula函数的参数。u and v is the probability distribution function of random variable X and Y, respectively, which is the probability when X is not large than observed x and Y is not large than observed y respectively. θ is the parameter of Copula function. | ||
下载: 导出CSV表21980—2013年研究区作物水分利用效率及相关变量的边缘分布假设检验结果
Table2.The hypothesis tests of marginal distributions of water use efficiency, net primary productivity, actual evapotranspiration, annual mean air temperature, sunshine duration, and annual precipitation of the Beijing-Tianjin-Hebei Plain from 1980 to 2013
| 变量名称 Variable | 正态分布 Normal distribution | Gamma分布 Gamma distribution | GEV分布 GEV distribution | EV分布 EV distribution | Logistic分布 Logistic distribution | |||||||||
| Dn | RMSE | Dn | RMSE | Dn | RMSE | Dn | RMSE | Dn | RMSE | |||||
| 作物水分利用效率 Water use efficiency | 0.105*** | 0.052 | 0.111*** | 0.055 | 0.073*** | 0.033 | 0.058*** | 0.027 | 0.086*** | 0.046 | ||||
| 作物净初级生产力 Net primary productivity | 0.058*** | 0.031 | 0.065*** | 0.032 | 0.086*** | 0.036 | 0.105*** | 0.045 | 0.062*** | 0.031 | ||||
| 作物实际蒸散发 Actual evapotranspiration | 0.110*** | 0.044 | 0.110*** | 0.044 | 0.087*** | 0.047 | 0.094*** | 0.050 | 0.107*** | 0.043 | ||||
| 年平均气温 Annual mean air temperature | 0.056*** | 0.028 | 0.056*** | 0.029 | 0.079*** | 0.025 | 0.095*** | 0.034 | 0.081*** | 0.028 | ||||
| 年日照时数 Sunshine duration | 0.073*** | 0.030 | 0.078*** | 0.030 | 0.064*** | 0.030 | 0.112*** | 0.046 | 0.083*** | 0.033 | ||||
| 年降水量 Annual precipitation | 0.051*** | 0.024 | 0.060*** | 0.030 | 0.042*** | 0.021 | 0.082*** | 0.033 | 0.057*** | 0.031 | ||||
| ${D_{34, 0.01}} = 0.272\;8;\;{D_{34, 0.05}} = 0.227\;5;\;{D_{34, 0.01}} = 0.204\;8$。***分别表示在1%显著性水平下通过K-S检验。针对每个变量, 5个备选边缘分布函数的拟合结果中RMSE最小的用加粗表示, 表明拟合结果最优, 相应的边缘分布函数用于描述变量的概率分布情况。“***” means passing K-S test at significance level of 1%. The smallest RMSE among 5 candidate marginal distribution functions is bolded, standing for the best fitting of the probability distribution of every random variable. | ||||||||||||||
下载: 导出CSV表31980—2013年研究区作物水分利用效率及相关变量的边缘分布函数
Table3.The marginal distribution functions of water use efficiency and other relevant variables of the Beijing-Tianjin-Hebei Plain
| 变量名称 Variable | 概率密度函数 Probability density function | 参数估计值 Parameter |
| 作物水分利用效率 Water use efficiency | $f(x) = {\sigma ^{ - 1}}\exp \left( {\frac{{x - \mu }}{\sigma }} \right)\exp \left[ { - \exp \left( {\frac{{x - \mu }}{\sigma }} \right)} \right]$ | μ=1.68, σ=0.063 |
| 作物净初级生产力 Net primary productivity | $f(x) = \frac{1}{{\sigma \sqrt {2{\rm{ \mathsf{ π} }}} }}\exp \left[ {\frac{{ - {{(x - \mu )}^2}}}{{2{\sigma ^2}}}} \right]$ | μ=943.34, σ=55.45 |
| 作物实际蒸散发 Actual evapotranspiration | $f(x) = \frac{{\exp \left( {\frac{{x - \mu }}{\sigma }} \right)}}{{\sigma {{\left[ {1 + \exp \left( {\frac{{x - \mu }}{\sigma }} \right)} \right]}^2}}}$ | μ=577.15, σ=11.53 |
| 年平均气温 Annual mean air temperature | $f(x) = \frac{1}{\sigma }\exp \left[ { - {{\left( {1 + k\frac{{x - \mu }}{\sigma }} \right)}^{\frac{{ - 1}}{k}}}} \right]{\left[ {1 + k\frac{{x - \mu }}{\sigma }} \right]^{ - 1\; - \;\frac{1}{k}}}$ | k=-0.47, σ=0.57, μ=12.81 |
| 年日照时数 Sunshine duration | $f(x) = \frac{1}{\sigma }\exp \left[ { - {{\left( {1 + k\frac{{x - \mu }}{\sigma }} \right)}^{\frac{{ - 1}}{k}}}} \right]{\left[ {1 + k\frac{{x - \mu }}{\sigma }} \right]^{ - 1\; - \;\frac{1}{k}}}$ | k=-0.34, σ=166.58, μ=2414.43 |
| 年降水量 Annual precipitation | $f(x) = \frac{1}{\sigma }\exp \left[ { - {{\left( {1 + k\frac{{x - \mu }}{\sigma }} \right)}^{\frac{{ - 1}}{k}}}} \right]{\left[ {1 + k\frac{{x - \mu }}{\sigma }} \right]^{ - 1\; - \;\frac{1}{k}}}$ | k=-0.32, σ=92.76, μ=481.95 |
下载: 导出CSV表41980—2013年研究区作物水分利用效率与各相关变量联合分布的Copula函数K-S检验及参数估计值
Table4.The K-S test and estimated parameters of each Copula function for the joint probability distribution of water use efficiency and other relevant variables of the Beijing-Tianjin-Hebei Plain from 1980 to 2013
| 联合分布 Joint probability distribution | Gaussian | Frank | AMH | FGM | Cubic | |||||||||
| Dn | θ | Dn | θ | Dn | θ | Dn | θ | Dn | θ | |||||
| WUE-NPP | 0.060*** | 0.85 | 0.065*** | 9.06 | 0.093*** | 1.00 | 0.121*** | 1.00 | 0.173*** | 2.00 | ||||
| WUE-ETa | 0.098*** | 0.16 | 0.097*** | 0.88 | 0.098*** | 0.44 | 0.098*** | 0.45 | 0.082*** | -1.00 | ||||
| WUE-Tmean | 0.123*** | -0.04 | 0.124*** | -0.36 | 0.123*** | -0.16 | 0.125*** | -0.19 | 0.120*** | -1.00 | ||||
| WUE-Pre | 0.082*** | -0.14 | 0.083*** | -0.75 | 0.079*** | -0.48 | 0.082*** | -0.39 | 0.085*** | -1.00 | ||||
| WUE-Sun | 0.056*** | 0.23 | 0.058*** | 1.30 | 0.058*** | 0.60 | 0.058*** | 0.66 | 0.067*** | -0.47 | ||||
| ${D_{34, 0.01}} = 0.272\;8;\;{D_{34, 0.05}} = 0.227\;5;\;{D_{34, 0.01}} = 0.204\;8$。***表示在1%的显著性水平下通过K-S检验。WUE-NPP:作物水分利用效率和作物净初级生产力的联合分布; WUE-ETa:作物水分利用效率和作物实际蒸散发的联合分布; WUE-Tmean:作物水分利用效率和年平均气温的联合分布; WUE-Pre:作物水分利用效率和年降水量的联合分布; WUE-Sun:作物水分利用效率和年日照时数的联合分布。“***” means passing K-S test at significance level of 1%. WUE-NPP: the joint probability distribution of water use efficiency and net primary productivity. WUE-ETa: the joint probability distribution of water use efficiency and actual evapotranspiration. WUE-Tmean: the joint probability distribution of water use efficiency and annual mean air temperature. WUE-Pre: the joint probability distribution of water use efficiency and annual precipitation. WUE-Sun: the joint probability distribution of water use efficiency and sunshine duration. | ||||||||||||||
下载: 导出CSV表51980—2013年研究区作物水分利用效率与各相关变量联合分布的Copula函数RMSE和AIC值
Table5.The RMSE and AIC values of each Copula function for the joint probability distribution function of water use efficiency and other relevant variables of the Beijing-Tianjin-Hebei Plain from 1980 to 2013
| 联合分布 Joint probability distribution | Gaussian | Frank | AMH | FGM | Cubic | |||||||||
| RMSE | AIC | RMSE | AIC | RMSE | AIC | RMSE | AIC | RMSE | AIC | |||||
| WUE-NPP | 0.023 | -255.06 | 0.024 | -250.48 | 0.050 | -201.88 | 0.065 | -184.12 | 0.094 | -159.08 | ||||
| WUE-ETa | 0.036 | -222.92 | 0.037 | -222.18 | 0.037 | -222.84 | 0.037 | -222.37 | 0.038 | -220.31 | ||||
| WUE-Tmean | 0.046 | -208.07 | 0.045 | -208.41 | 0.045 | -208.30 | 0.045 | -208.44 | 0.045 | -209.55 | ||||
| WUE-Pre | 0.032 | -232.02 | 0.032 | -231.95 | 0.031 | -232.82 | 0.032 | -232.15 | 0.033 | -230.09 | ||||
| WUE-Sun | 0.025 | -248.38 | 0.025 | -248.19 | 0.024 | -251.00 | 0.025 | -248.65 | 0.032 | -232.31 | ||||
| WUE-NPP:作物水分利用效率和作物净初级生产力的联合分布; WUE-ETa:作物水分利用效率和作物实际蒸散发的联合分布; WUE-Tmean:作物水分利用效率和年平均气温的联合分布; WUE-Pre:作物水分利用效率和年降水量的联合分布; WUE-Sun:作物水分利用效率和年日照时数的联合分布。针对每组联合分布, 5个备选Copula函数的拟合结果中最小的RMSE和AIC加粗, 表明拟合结果最优, 相应的Copula函数用于描述作物水分利用效率和各相关变量的联合分布情况。WUE-NPP: the joint probability distribution of water use efficiency and net primary productivity. WUE-ETa: the joint probability distribution of water use efficiency and actual evapotranspiration. WUE-Tmean: the joint probability distribution of water use efficiency and annual mean air temperature. WUE-Pre: the joint probability distribution of water use efficiency and annual precipitation. WUE-Sun: the joint probability distribution of water use efficiency and sunshine duration. The smallest RMSE and AIC among 5 candidate Copula functions was bolded, standing for the best fitting of the joint probability distribution of water use efficiency and other relevant variables. | ||||||||||||||
下载: 导出CSV表6研究区作物水分利用效率的相关变量的取值条件
Table6.The value conditions of driving factors for water use efficiency of crops in the Beijing-Tianjin-Hebei Plain
| 变量 Variable | 取值范围Value condition | ||
| 低Low (L) ($X \le {x_{a = 0.33}} $) | 中Medium (M) ($ {x_{a = 0.33}} < X \le {x_{a = 0.67}}$) | 高High (H) ($ {x_{a = 0.67}} < X$) | |
| 作物净初级生产力Net primary productivity (NPP) [g(C)·m-2·a-1] | NPP≤918.95 | 918.95 < NPP≤967.73 | 967.73 < NPP |
| 作物实际蒸散发Actual evapotranspiration (ETa) (mm·a-1) | ETa≤568.99 | 568.99 < ETa≤585.31 | 585.31 < ETa |
| 年平均气温Annual mean air temperature (Tmean) (℃) | Tmean≤12.75 | 12.75 < Tmean≤13.23 | 13.23 < Tmean |
| 年降水量Annual precipitation (Pre) (mm·a-1) | Pre≤472.12 | 472.12 < Pre≤556.31 | 556.31 < Pre |
| 年日照时数Sunshine duration (Sun) (h·a-1) | Sun≤2 396.94 | 2 396.94 < Sun≤2 545.67 | 2 545.67 < Sun |
下载: 导出CSV参考文献
| [1] | 鲍超, 贺东梅.京津冀城市群水资源开发利用的时空特征与政策启示[J].地理科学进展, 2017, 36(1): 58-67 http://d.old.wanfangdata.com.cn/Periodical/dlkxjz201701006 BAO C, HE D M. Spatiotemporal characteristics of water resources exploitation and policy implications in the Beijing-Tianjin-Hebei Urban Agglomeration[J]. Progress in Geography, 2017, 36(1): 58-67 http://d.old.wanfangdata.com.cn/Periodical/dlkxjz201701006 |
| [2] | 杜朝阳, 于静洁.京津冀地区适水发展问题与战略对策[J].南水北调与水利科技, 2018, 16(4): 17-25 http://www.wanfangdata.com.cn/details/detail.do?_type=perio&id=nsbdyslkj201804003 DU C Y, YU J J. Issues on the sustainable development of Beijing-Tianjin-Hebei Region based on the limited water resources[J]. South-to-North Water Transfers and Water Science & Technology, 2018, 16(4): 17-25 http://www.wanfangdata.com.cn/details/detail.do?_type=perio&id=nsbdyslkj201804003 |
| [3] | ZHANG X L, REN L, WAN L. Assessing the trade-off between shallow groundwater conservation and crop production under limited exploitation in a well-irrigated plain of the Haihe River basin using the SWAT model[J]. Journal of Hydrology, 2018, 567: 253-266 doi: 10.1016/j.jhydrol.2018.09.041 |
| [4] | 王学, 李秀彬, 辛良杰.河北平原冬小麦播种面积收缩及由此节省的水资源量估算[J].地理学报, 2013, 68(5): 694-707 http://d.old.wanfangdata.com.cn/Periodical/dlxb201305010 WANG X, LI X B, XIN L J. Impact of the shrinking winter wheat sowing area on agricultural water consumption in the Hebei Plain[J]. Acta Geographica Sinica, 2013, 68(5): 694-707 http://d.old.wanfangdata.com.cn/Periodical/dlxb201305010 |
| [5] | 尚松浩, 蒋磊, 杨雨亭.基于遥感的农业用水效率评价方法研究进展[J].农业机械学报, 2015, 46(10): 81-92 doi: 10.6041/j.issn.1000-1298.2015.10.013 SHANG S H, JIANG L, YANG Y T. Review of remote sensing-based assessment method for irrigation and crop water use efficiency[J]. Transactions of the Chinese Society for Agricultural Machinery, 2015, 46(10): 81-92 doi: 10.6041/j.issn.1000-1298.2015.10.013 |
| [6] | 冯保清.我国不同尺度灌溉用水效率评价与管理研究[D].北京: 中国水利水电科学研究院, 2013 FENG B Q. Study on the evaluation and management of irrigation water use efficiency for different scales in countrywide[D]. Beijing: China Institute of Water Resources & Hydropower Research, 2013 |
| [7] | MO X G, LIU S X, LIN Z H, et al. Regional crop yield, water consumption and water use efficiency and their responses to climate change in the North China Plain[J]. Agriculture, Ecosystems & Environment, 2009, 134(1/2): 67-78 doi: 10.1016-j.agee.2009.05.017/ |
| [8] | GUO R P, LIN Z H, MO X G, et al. Responses of crop yield and water use efficiency to climate change in the North China Plain[J]. Agricultural Water Management, 2010, 97(8): 1185-1194 doi: 10.1016/j.agwat.2009.07.006 |
| [9] | MO X, LIU S, HU S, et al. Sensitivity of terrestrial water and carbon fluxes to climate variability in semi-humid basins of Haihe River, China[J]. Ecological Modelling, 2017, 353: 117-128 doi: 10.1016/j.ecolmodel.2016.09.003 |
| [10] | SUN S B, SONG Z L, WU X C, et al. Spatio-temporal variations in water use efficiency and its drivers in China over the last three decades[J]. Ecological Indicators, 2018, 94: 292-304 doi: 10.1016/j.ecolind.2018.07.003 |
| [11] | 赵姜, 孟鹤, 龚晶.京津冀地区农业全要素用水效率及影响因素分析[J].中国农业大学学报, 2017, 22(3): 76-84 http://d.old.wanfangdata.com.cn/Periodical/zgnydxxb201703010 ZHAO J, MENG H, GONG J. Measurement of total factor agricultural water efficiency and analysis of influential factors in Jing-Jin-Ji area[J]. Journal of China Agricultural University, 2017, 22(3): 76-84 http://d.old.wanfangdata.com.cn/Periodical/zgnydxxb201703010 |
| [12] | 陈洪斌.我国省际农业用水效率测评与空间溢出效应研究[J].干旱区资源与环境, 2017, 31(2): 85-90 http://d.old.wanfangdata.com.cn/Periodical/ghqzyyhj201702015 CHEN H B. Provincial agricultural water use efficiency evaluation and spatial spillover effect in China[J]. Journal of Arid Land Resources and Environment, 2017, 31(2): 85-90 http://d.old.wanfangdata.com.cn/Periodical/ghqzyyhj201702015 |
| [13] | 桑燕芳, 王中根, 刘昌明.水文时间序列分析方法研究进展[J].地理科学进展, 2013, 32(1): 20-30 http://d.old.wanfangdata.com.cn/Periodical/dlkxjz201301002 SANG Y F, WANG Z G, LIU C M. Research progress on the time series analysis methods in hydrology[J]. Progress in Geography, 2013, 32(1): 20-30 http://d.old.wanfangdata.com.cn/Periodical/dlkxjz201301002 |
| [14] | 郭生练, 闫宝伟, 肖义, 等. Copula函数在多变量水文分析计算中的应用及研究进展[J].水文, 2008, 28(3): 1-7 http://d.old.wanfangdata.com.cn/Periodical/sw200803001 GUO S L, YAN B W, XIAO Y, et al. Multivariate hydrological analysis and estimation[J]. Journal of China Hydrology, 2008, 28(3): 1-7 http://d.old.wanfangdata.com.cn/Periodical/sw200803001 |
| [15] | 熊立华, 郭生练, 肖义, 等. Copula联结函数在多变量水文频率分析中的应用[J].武汉大学学报:工学版, 2005, 38(6): 16-19 http://d.old.wanfangdata.com.cn/Periodical/whsldldxxb200506004 XIONG L H, GUO S L, XIAO Y, et al. Application of copulas to multivariate hydrological frequency analysis[J]. Engineering Journal of Wuhan University, 2005, 38(6): 16-19 http://d.old.wanfangdata.com.cn/Periodical/whsldldxxb200506004 |
| [16] | SALVADORI G, DE MICHELE C. Multivariate multiparameter extreme value models and return periods: A copula approach[J]. Water Resources Research, 2010, 46(10): 219-233 http://d.old.wanfangdata.com.cn/NSTLQK/NSTL_QKJJ0223985774/ |
| [17] | HAO Z C, HAO F H, SINGH V P, et al. Quantitative risk assessment of the effects of drought on extreme temperature in eastern China[J]. Journal of Geophysical Research: Atmospheres, 2017, 122(17): 9050-9059 doi: 10.1002/2017JD027030 |
| [18] | MADADGAR S, AGHAKOUCHAK A, FARAHMAND A, et al. Probabilistic estimates of drought impacts on agricultural production[J]. Geophysical Research Letters, 2017, 44(15): 7799-7807 doi: 10.1002/2017GL073606 |
| [19] | 李浩鑫, 邵东国, 尹希, 等.基于主成分分析和Copula函数的灌溉用水效率评价方法[J].农业工程学报, 2015, 31(11): 96-102 doi: 10.11975/j.issn.1002-6819.2015.11.014 LI H X, SHAO D G, YIN X, et al. Evaluation method for irrigation-water use efficiency based on principle component analysis and Copula function[J]. Transactions of the CSEA, 2015, 31(11): 96-102 doi: 10.11975/j.issn.1002-6819.2015.11.014 |
| [20] | ZHAO Y, ZHANG J P, XIAO W H. Study on the joint probability distribution of irrigation water volume and irrigation water efficiency[J]. Water Science & Technology: Water Supply, 2015, 15(4): 802-809 http://www.wanfangdata.com.cn/details/detail.do?_type=perio&id=22ea935be65c1de684ff7804652ac3e5 |
| [21] | MO X G, CHEN X J, HU S, et al. Attributing regional trends of evapotranspiration and gross primary productivity with remote sensing: a case study in the North China Plain[J]. Hydrology and Earth System Sciences, 2017, 21(1): 295-310 doi: 10.5194/hess-21-295-2017 |
| [22] | SADEGH M, RAGNO E, AGHAKOUCHAK A. Multivariate copula analysis toolbox (MvCAT): describing dependence and underlying uncertainty using a Bayesian framework[J]. Water Resources Research, 2017, 53(6): 5166-5183 doi: 10.1002/2016WR020242 |
| [23] | ZHANG L, SINGH V P. Bivariate flood frequency analysis using the copula method[J]. Journal of Hydrologic Engineering, 2006, 11(2): 150-164 doi: 10.1061/(ASCE)1084-0699(2006)11:2(150) |
| [24] | MO X G, LIU S X, MENF D J, et al. Exploring the interannual and spatial variations of ET and GPP with climate by a physical model and remote sensing data in a large basin of Northeast China[J]. International Journal of Climatology, 2014, 34(6): 1945-1963 doi: 10.1002/joc.3813 |
| [25] | GILBERT M E, HERNANDEZ M I. How should crop water-use efficiency be analyzed? A warning about spurious correlations[J]. Field Crops Research, 2019, 235: 59-67 doi: 10.1016/j.fcr.2019.02.017 |
| [26] | 姜寒冰, 张玉翠, 任晓东, 等.作物水分利用效率研究方法及尺度传递研究进展[J].中国生态农业学报, 2019, 27(1): 50-59 http://www.ecoagri.ac.cn/zgstny/ch/reader/view_abstract.aspx?file_no=2019-0106&flag=1 JIANG H B, ZHANG Y C, REN X D, et al. A review of progress in research and scaling-up methods of crop water use efficiency[J]. Chinese Journal of Eco-Agriculture, 2019, 27(1): 50-59 http://www.ecoagri.ac.cn/zgstny/ch/reader/view_abstract.aspx?file_no=2019-0106&flag=1 |
