张润芝,
李淑敏,,
许宁,
牟尧,
张春怡
东北农业大学资源与环境学院 哈尔滨 150030
基金项目: 国家重点研发计划项目2016YFD030020204
详细信息
作者简介:王雪蓉, 主要研究方向为植物营养学。E-mail:1647141854@qq.com
通讯作者:李淑敏, 主要研究方向为作物营养与施肥。E-mail:lishumin113@126.com
中图分类号:S344.2计量
文章访问数:544
HTML全文浏览量:1
PDF下载量:353
被引次数:0
出版历程
收稿日期:2019-01-23
录用日期:2019-05-08
刊出日期:2019-09-01
Simulation of dry matter accumulation and nitrogen absorption in a maize/soybean intercropping system supplied with different nitrogen levels
WANG Xuerong,ZHANG Runzhi,
LI Shumin,,
XU Ning,
MU Yao,
ZHANG Chunyi
College of Resources and Environmental Sciences, Northeast Agricultural University, Harbin 150030, China
Funds: the National Key Research and Development Project of China2016YFD030020204
More Information
Corresponding author:LI Shumin, E-mail: lishumin113@126.com
摘要
HTML全文
图
参考文献
相关文章
施引文献
资源附件
访问统计
摘要
摘要:玉米/大豆间作具有一定的养分利用优势,但是不同供氮水平对玉米/大豆间作体系干物质累积和氮素吸收的调控作用不同。本试验采用田间裂区设计,运用Logistic模型分析,模拟了4个氮水平下玉米/大豆间作作物干物质积累和氮素吸收的动态变化。结果表明,玉米、大豆干物质累积和氮素吸收动态符合Logistic模型,相关系数R2均在0.9以上。在N0(不施氮肥)、N1(180 kg·hm-2)、N2(240 kg·hm-2)和N3(300 kg·hm-2)供氮水平时,间作玉米最大生长速率(Imax-B)分别比单作提高34.2%、46.7%、25.9%和25.1%,而相应的供氮水平下,大豆的Imax-B分别降低27.7%、30.3%、16.5%和23.7%,但整个间作系统的Imax-B平均增加32.1%;玉米和大豆干物质的其他模拟参数与Imax-B规律一致。氮素吸收动态与干物质积累表现出同步的变化特点,在N1水平下,单位面积间作玉米的氮素最大吸收量(K-N)、最大吸收速率(Imax-N)和瞬时吸收速率(r-N)比相应单作分别提高18.4%、48.9%和25.8%,而间作大豆的K-N、Imax-N和r-N值比单作处理分别降低15.9%、29.9%和16.69%,整个间作系统氮素分别提高0.4%、13.7%和7.8%;施氮水平对大豆r-N无显著性影响。间作显著地提高了氮素当量比(LERN>1),其中N0水平下LERN值最高,随着施氮量的增加,LERN有下降趋势。在本试验条件下,N2供氮水平下玉米/大豆间作体系干物质积累量和氮素吸收量最高,间作优势最明显。
关键词:玉米/大豆间作/
干物质累积/
氮素吸收量/
间作优势/
Logistic模型
Abstract:Maize/soybean intercropping has yield advantages to an extent. However, different nitrogen supply levels have different effects on dry matter accumulation and nitrogen uptake in the maize/soybean intercropping system. A field experiment with a split design and logistic model were used to simulate dynamic changes in dry matter accumulation and nitrogen uptake in a maize/soybean intercropping system supplied with four nitrogen levels. Simulation results showed that dry matter accumulation and nitrogen uptake dynamics in maize and soybean were consistent with the logistic model, with correlation coefficients (R2) higher than 0.9 at the four nitrogen levels. The maximum growth rate (Imax-B) of intercropped maize compared with monoculture increased by 34.2%, 46.7%, 25.9% and 25.1% when the nitrogen supply levels were N0 (without N supply), N1 (180 kg·hm-2), N2 (240 kg·hm-2), and N3 (300 kg·hm-2), respectively. The Imax-B of the soybean decreased by 27.7%, 30.3%, 16.5%, and 23.7%, respectively. However, the average Imax-B in the intercropping system was increased by32.1%. The other dry matter simulation parameters of maize and soybean were consistent with the Imax-B. Additionally, nitrogen uptake dynamics showed synchronous changes with dry matter accumulation. Under N1 treatment, the maximum nitrogen uptake (K-N), maximum uptake rate (Imax-N), and instantaneous uptake rate (r-N) of intercropped maize was 18.4%, 48.9%, and 25.8% higher than that of the monoculture, while the K-N, Imax-N, and r-N of the intercropped soybean was 15.9%, 29.9%, and 16.69% lower than that of the monoculture, respectively. The simulation parameters of K-N, Imax-N, and r-N in the intercropping system were 0.4%, 13.7%, and 7.8% higher than those of monoculture, respectively. Nitrogen supply had no significant effect on r-N of soybean. A significant advantage of nitrogen in the intercropping system was observed with nitrogen land equivalent ration (LERN)>1, and the LERN value under N0 treatment was the highest. With the increase in nitrogen application, the LERN exhibited a downward trend. In the present experiment, the highest dry matter accumulation and nitrogen uptake were observed under N2 treatment, which had obvious advantages for intercropping.
Key words:Maize/soybean intercropping/
Dry matter accumulation/
Nitrogen uptake/
Intercropping advantage/
Logistic model
HTML全文
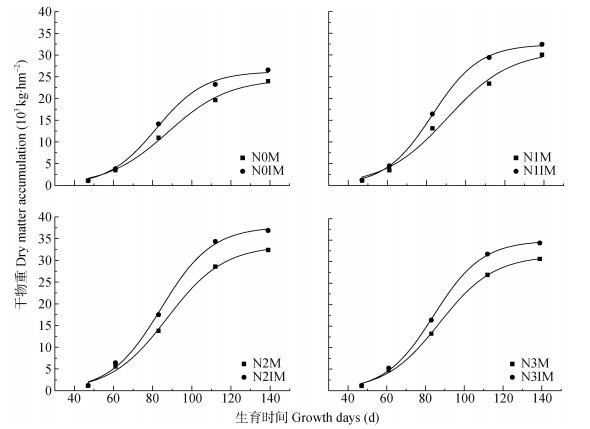
图1不同供氮水平下单作玉米和与大豆间作的玉米的干物质积累动态
M和IM分别代表单作玉米和与大豆间作的玉米; N0、N1、N2和N3代表施氮量分别为0 kg·hm-2、180 kg·hm-2、240 kg·hm-2、320 kg·hm-2。
Figure1.Dynamics of dry matter accumulation of maize monocultured and intercropped with soybean at different N levels
M and IM represent monocultured maize and intercropped maize. N0, N1, N2 and N3 respectively represent N supply levels of 0 kg·hm-2, 180 kg·hm-2, 240 kg·hm-2 and 320 kg·hm-2.
 下载: 全尺寸图片幻灯片
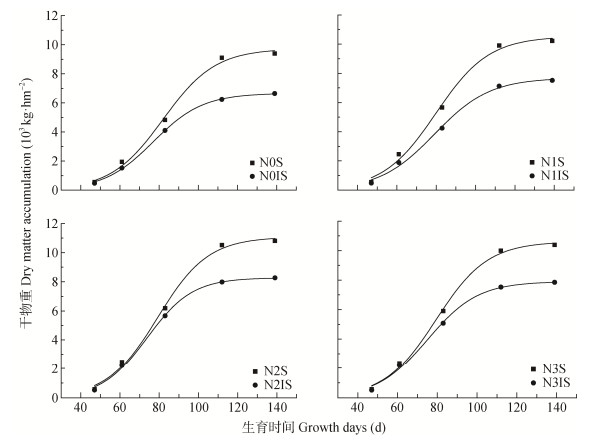
图2不同供氮水平下单作大豆和与玉米间作的大豆的干物质积累动态
S和IS分别代表单作大豆和与玉米间作的大豆; N0、N1、N2和N3代表施氮量分别为0 kg·hm-2、40 kg·hm-2、80 kg·hm-2、120 kg·hm-2。
Figure2.Dynamics of dry matter accumulation of soybean monocultured and intercropped with maize at different N levels
M and IM represent monocultured soybean and intercropped soybean. N0, N1, N2 and N3 represent N levels of 0 kg·hm-2, 40 kg·hm-2, 80 kg·hm-2 and 120 kg·hm-2, respectively.
下载: 全尺寸图片幻灯片表1不同供氮水平下单作玉米和与大豆间作的玉米的干物质累积的Logistic函数参数
Table1.Dry matter accumulation parameters estimated by Logistic function of maize monocultured and intercropped with soybean at different N levels
| 处理 Treatment | 最大干物质积累量(K-B) Maximum dry matter accumulation (×10 3 kg·hm-2) | 达到最大生长速率需要的时间(tmax-B) Time to maximum dry matter accumulation (d) | 瞬时生长速率(r-B) Instantaneous dry matter accumulation rate (g·hm-2·d-1) | 最大瞬时生长率(Imax-B) Maximum instantaneous dry matter accumulation rate (kg·hm-2·d-1) |
| N0M | 24.5±0.3dB | 87.8±0.7cA | 64.6±2.0bB | 395.1±7.5dB |
| N0IM | 26.2±0.1dA | 81.9±0.1cB | 80.9±0.5bA | 530.1±4.0dA |
| N1M | 31.3±0.3cB | 90.8±0.6aA | 58.8±1.3bB | 460.6±6.3cB |
| N1IM | 32.5±0.2cA | 83.0±0.2aB | 83.3±2.0bA | 675.6±3.1cA |
| N2M | 33.4±0.2aB | 87.4±0.6bA | 69.1±1.1bB | 577.9±5.9aB |
| N2IM | 37.7±0.4aA | 84.2±0.4bB | 77.1±0.5bA | 727.7±3.2aA |
| N3M | 31.5±0.3bB | 87.2±0.6bA | 71.2±3.2aB | 559.7±5.0bB |
| N3IM | 34.9±0.4bA | 84.2±0.2bB | 80.2±0.5aA | 699.6±3.2bA |
| 氮水平N level (N) | ** | ** | ** | ** |
| 间作方式Planting pattern (P) | ** | ** | ** | ** |
| 氮水平x间作方式N x P | ** | ** | ** | ** |
| 不同大写字母表示在同一供氮水平不同种植模式间差异显著(P < 0.05), 不同小写字母表示同一种植模式不同供氮水平间差异显著(P < 0.05)。**表示在P < 0.01水平差异显著。M和IM分别代表单作玉米和与大豆间作的玉米; N0、N1、N2和N3代表施氮量分别为0 kg·hm-2、180 kg·hm-2、240 kg·hm-2、320 kg·hm-2。Different capital letters mean significant differences between monoculture and intercropping at 0.05 level at the same N level. Different lowercase letters mean significant differences among different N levels at 0.05 level in the same planting pattern. ** shows significant differences at 0.01 level. M and IM represent monocultured maize and intercropped maize. N0, N1, N2 and N3 respectively represent N levels of 0 kg·hm-2, 180 kg·hm-2, 240 kg·hm-2 and 320 kg·hm-2. | ||||
下载: 导出CSV表2不同供氮水平下单作大豆和与玉米间作的大豆干物质累积Logistic函数参数
Table2.Dry matter accumulation parameters of soybean estimated by Logistic function of soybean monocultured and intercropped with maize at different N levels
| 处理 Treatment | 最大干物质积累量(K-B) Maximum dry matter accumulation (×103 kg·hm-2) | 达到最大生长速率需要的时间(tmax-B) Time to maximum dry matter accumulation (d) | 瞬时生长速率(r-B) Instantaneous dry matter accumulation rate (g·hm-2·d-1) | 最大瞬时生长率(Imax-B) Maximum instantaneous dry matter accumulation rate (kg·hm-2·d-1) |
| N0S | 9.7±0.1cA | 82.0±1.0aA | 75.1±3.0abA | 182.7±6.3cA |
| N0IS | 6.7±0.2cB | 77.0±1.3aB | 79.4±0.8abA | 132.1±4.2cB |
| N1S | 10.5±0.1bA | 79.8±1.0aA | 74.7±5.5bA | 196.5±4.6bcA |
| N1IS | 7.7±0.1bB | 79.2±0.2aB | 71.3±3.3bA | 137.1±5.0bcB |
| N2S | 11.1±0.1aA | 79.1±1.0bA | 78.6±3.8aA | 217.6±4.3aA |
| N2IS | 8.3±0.2aB | 73.8±1.0bB | 87.7±2.6aA | 181.6±3.1aB |
| N3S | 10.6±0.2bA | 79.4±0.9bA | 77.1±3.4abA | 204.6±5.2bA |
| N3IS | 7.9±0.2bB | 75.1±0.5bB | 78.9±3.1abA | 156.1±3.9bB |
| 氮水平N level (N) | ** | ** | ns | ** |
| 间作方式Planting pattern (P) | ** | ** | ns | ** |
| 氮水平x间作方式N x P | ns | ** | ns | ns |
| 不同大写字母表示在同一供氮水平不同种植模式间差异显著(P < 0.05), 不同小写字母表示同一种植模式不同供氮水平间差异显著(P < 0.05)。ns和**分别表示差异不显著和在P < 0.01水平差异显著。S和IS分别代表单作大豆和与玉米间作的大豆; N0、N1、N2和N3代表施氮量分别为0 kg·hm-2、40 kg·hm-2、80 kg·hm-2、120 kg·hm-2。Different capital letters mean significant differences between monoculture and intercropping at 0.05 level at the same N level. Different lowercase letters mean significant differences among different N levels at 0.05 level in the same planting pattern. ns and ** mean not significant difference and significant differences at P < 0.01, respectively. S and IS represent monocultured soybean and intercropped soybean. N0, N1, N2 and N3 respectively represent N levels of 0 kg·hm-2, 40 kg·hm-2, 80 kg·hm-2 and 120 kg·hm-2. | ||||
下载: 导出CSV表3不同供氮水平下单作玉米和与大豆间作的玉米的氮素吸收Logistic函数参数
Table3.Parameters of N absorption Logistic functions of maize monocultured and intercropped with soybean at different N levels
| 处理 Treatment | Logistic方程 Logistic function | 氮素最大吸收量(K-N) Maximum nitrogen uptake (kg·hm-2) | 氮素达到最大吸收速率需要的时间(tmax-N) Time to maximum nitrogen absorption (d) | 氮素瞬时吸收速率(r-N) Instantaneous nitrogen absorption rate (g·hm-2·d-1) | 氮素最大瞬时吸收率(Imax-N) Maximum instantaneous nitrogen absorption rate (kg·hm-2·d-1) |
| N0M | ${Y_t} = 221.5/\left\{ {1 + \exp \left[ {86.9 \times \left( {74.9 - t} \right)} \right]} \right\}$ | 221.5±5.0dB | 74.9±1.5bA | 86.9±0.5aB | 4.8±0.6bB |
| N0IM | ${Y_t} = 260.3/\left\{ {1 + \exp \left[ {103.1 \times \left( {72.0 - t} \right)} \right]} \right\}$ | 260.3±0.9dA | 72.0±0.5bB | 103.1±2.4aA | 6.7±0.1bA |
| N1M | ${Y_t} = 290.9/\left\{ {1 + \exp \left[ {79.5 \times \left( {75.4 - t} \right)} \right]} \right\}$ | 290.9±6.7cB | 75.4±0.4babA | 79.5±0.6abB | 5.8±0.1aB |
| N1IM | \[{Y_t} = 344.3/\left\{ {1 + \exp \left[{100.1 \times \left({72.6 - t} \right)} \right]} \right\}\] | 344.3±5.9cA | 72.6±0.9abB | 100.1±3.2abA | 8.6±0.6aA |
| N2M | ${Y_t} = 344.2/\left\{ {1 + \exp \left[ {76.6 \times \left( {75.3 - t} \right)} \right]} \right\}$ | 343.2±2.6aB | 75.3±1.2aA | 76.6±1.8cB | 6.6±0.1aB |
| N2IM | \[{Y_t} = 421.6/\left\{ {1 + \exp \left[{77.5 \times \left({74.1 - t} \right)} \right]} \right\}\] | 421.6±2.6aA | 74.1±0.2aB | 77.5±2.5cA | 8.2±0.2aA |
| N3M | \[{Y_t} = 316.7/\left\{ {1 + \exp \left[{80.2 \times \left({76.2 - t} \right)} \right]} \right\}\] | 316.7±6.8bB | 76.2±0.5aA | 80.2±1.3bcB | 6.4±0.2aB |
| N3IM | \[{Y_t} = 373.9/\left\{ {1 + \exp \left[{86.7 \times \left({73.8 - t} \right)} \right]} \right\}\] | 373.9±5.7bA | 73.8±0.1aB | 86.7±1.7bcA | 8.1±0.2aA |
| 氮水平N level (N) | ** | * | ** | ** | |
| 间作方式P Planting pattern (P) | ** | ** | ** | ** | |
| 氮水平x间作方式 N x P | ** | ns | * | * | |
| 不同大写字母表示在同一供氮水平不同种植模式间差异显著(P < 0.05), 不同小写字母表示同一种植模式不同供氮水平间差异显著(P < 0.05)。ns和*、**分别表示差异不显著和在P < 0.05和P < 0.01水平差异显著。M和IM分别代表单作玉米和与大豆间作的玉米; N0、N1、N2和N3代表施氮量分别为0 kg·hm-2、180 kg·hm-2、240 kg·hm-2、300 kg·hm-2。Different capital letters mean significant differences between monoculture and intercropping at 0.05 level at the same N level. Different lowercase letters mean significant differences among different N levels at 0.05 level in the same planting pattern. ns, * and ** mean not significant difference, significant differences at P < 0.05 and P < 0.01, respectively. M and IM represent monocultured maize and intercropped maize. N0, N1, N2 and N3 respectively represent N levels of 0 kg·hm-2, 180 kg·hm-2, 240 kg·hm-2, 300 kg·hm-2. | |||||
下载: 导出CSV表4不同供氮水平下单作大豆和与玉米间作的大豆的氮素吸收Logistic函数参数
Table4.Parameters of N absorption Logstic functions of soybean monocropped and intercropped with maize at different N levels
| 处理 Treatment | Logistic方程 Logistic function | 氮素最大吸收量(K-N) Maximum nitrogen uptake (kg·hm-2) | 氮素达到最大吸收速率需要的时间(tmax-N) Time to maximum nitrogen absorption (d) | 氮素瞬时吸收速率(r-N) Instantaneous nitrogen absorption rate (g·hm-2·d-1) | 氮素最大瞬时吸收率(Imax-N) Maximum instantaneous nitrogen absorption rate (kg·hm-2·d-1) |
| N0S | ${Y_t} = 283.3/\left\{ {1 + \exp \left[ {63.5 \times \left( {92.3 - t} \right)} \right]} \right\}$ | 283.3±5.1bA | 92.3±2.2bA | 63.5±4.1aA | 4.5±0.2cA |
| N0IS | \[{Y_t} = 219.9/\left\{ {1 + \exp \left[{520.5 \times \left({95.0 - t} \right)} \right]} \right\}\] | 219.9±1.4bB | 95.0±2.4bA | 52.5±2.6aB | 2.9±0.2cB |
| N1S | ${Y_t} = 319.7/\left\{ {1 + \exp \left[ {58.5 \times \left( {91.6 - t} \right)} \right]} \right\}$ | 319.7±2.7aA | 91.6±0.7aA | 58.5±2.2bA | 4.7±0.2bA |
| N1IS | ${Y_t} = 268.8/\left\{ {1 + \exp \left[ {48.7 \times \left( {98.8 - t} \right)} \right]} \right\}$ | 268.8±5.4aB | 98.8±4.3aA | 48.7±3.7bB | 3.3±0.1bB |
| N2S | \[{Y_t} = 354.0/\left\{ {1 + \exp \left[{59.2 \times \left({91.0 - t} \right)} \right]} \right\}\] | 354.0±1.4aA | 91.0±0.4bA | 59.2±4.9abA | 5.2±0.4aA |
| N2IS | ${Y_t} = 270.8/\left\{ {1 + \exp \left[ {54.6 \times \left( {88.8 - t} \right)} \right]} \right\}$ | 270.8±4.3aB | 88.8±3.6bA | 54.6±3.2abB | 3.7±0.2aB |
| N3S | ${Y_t} = 344.2/\left\{ {1 + \exp \left[ {55.7 \times \left( {93.6 - t} \right)} \right]} \right\}$ | 344.2±1.1aA | 93.6±3.7abA | 55.7±5.2bA | 4.8±0.1bA |
| N3IS | \[{Y_t} = 249.8/\left\{ {1 + \exp \left[{53.2 \times \left({90.5 - t} \right)} \right]} \right\}\] | 249.8±3.3aB | 90.5±3.2abA | 53.2±5.6bB | 3.3±0.2bB |
| 氮水平N level (N) | ** | * | ns | ** | |
| 间作方式 Planting pattern (P) | ** | ns | * | ** | |
| 氮水平x间作方式 N x P | * | ** | ns | ns | |
| 不同大写字母表示在同一供氮水平不同种植模式间差异显著(P < 0.05), 不同小写字母表示同一种植模式不同供氮水平间差异显著(P < 0.05)。ns和*、**分别表示差异不显著和在P < 0.05和P < 0.01水平差异显著。S和IS分别代表单作大豆和与玉米间作的大豆; N0、N1、N2和N3代表施氮量分别为0 kg·hm-2、40 kg·hm-2、80 kg·hm-2、120 kg·hm-2。Different capital letters mean significant differences between monoculture and intercropping at 0.05 level at the same N level. Different lowercase letters mean significant differences among different N levels at 0.05 level in the same planting pattern. ns, * and ** mean not significant difference, significant differences at P < 0.05 and P < 0.01, respectively. S and IS represent monocultured soybean and intercropped soybean. N0, N1, N2 and N3 respectively represent N levels of 0 kg·hm-2, 40 kg·hm-2, 80 kg·hm-2 and 120 kg·hm-2. | |||||
下载: 导出CSV表5供氮水平对玉米/大豆间作体系相对单作的氮素吸收量以及利用效率变化的影响
Table5.Effects of N levels on changes of N uptake and utilization efficiency of maize/soybean intercropping system compared with the monoculturing systems
| 处理 Treatment | 氮素吸收量变化 Change of N uptake (%) | 经济产量氮素利用率 Change of N use efficiency of grain yield (%) | 生物学产量氮素利用效率 Change of N use efficiency of biomass (%) | 氮素当量比 N land equivalent ratio |
| N0 | 12.29 | 9.19 | -5.73 | 1.13 |
| N1 | 7.79 | 20.22 | 0.39 | 1.05 |
| N2 | 14.25 | 16.94 | 2.59 | 1.10 |
| N3 | 7.72 | 14.34 | 6.68 | 1.04 |
| N0、N1、N2和N3代表施氮量分别为0 kg·hm-2、110 kg·hm-2、160 kg·hm-2、210 kg·hm-2。N0, N1, N2 and N3 respectively represent N levels of 0 kg·hm-2, 110 kg·hm-2, 160 kg·hm-2 and 210 kg·hm-2. | ||||
下载: 导出CSV参考文献
| [1] | 徐长帅, 商伟, 冯雪梅, 等.玉米大豆间作田间配置经济效益研究[J].种子科技, 2015, 33(11): 44-46 doi: 10.3969/j.issn.1005-2690.2015.11.023 XU C S, SHANG W, FENG X M, et al. Study on economic benefits of intercropping in corn and soybean[J]. Seed Science & Technology, 2015, 33(11): 44-46 doi: 10.3969/j.issn.1005-2690.2015.11.023 |
| [2] | 王佳锐, 王科, 赵亚妮, 等.小麦施氮后效和种植方式对大豆产量及农艺性状的影响[J].草业学报, 2016, 25(7): 158-167 http://d.old.wanfangdata.com.cn/Periodical/caoyexb201607017 WANG J R, WANG K, ZHAO Y N, et al. Relationship between nitrogen after-effects and the yield and agronomic traits of monocropped and intercropped soybean[J]. Acta Prataculturae Sinica, 2016, 25(7): 158-167 http://d.old.wanfangdata.com.cn/Periodical/caoyexb201607017 |
| [3] | 李秋祝, 余常兵, 胡汉升, 等.不同竞争强度间作体系氮素利用和土壤剖面无机氮分布差异[J].植物营养与肥料学报, 2010, 16(4): 777-785 http://d.old.wanfangdata.com.cn/Periodical/zwyyyflxb201004001 LI Q Z, YU C B, HU H S, et al. Difference of nitrogen utilization and distribution of mineral nitrogen in soil profile by competitive abilities of intercropping systems[J]. Plant Nutrition and Fertilizer Science, 2010, 16(4): 777-785 http://d.old.wanfangdata.com.cn/Periodical/zwyyyflxb201004001 |
| [4] | 李志贤, 王建武, 杨文亭, 等.广东省甜玉米/大豆间作模式的效益分析[J].中国生态农业学报, 2010, 18(3): 627-631 http://www.ecoagri.ac.cn/zgstny/ch/reader/view_abstract.aspx?file_no=10331&flag=1 LI Z X, WANG J W, YANG W T, et al. Benefit of sweet corn/soybean intercropping in Guangdong Province[J]. Chinese Journal of Eco-Agriculture, 2010, 18(3): 627-631 http://www.ecoagri.ac.cn/zgstny/ch/reader/view_abstract.aspx?file_no=10331&flag=1 |
| [5] | 高翔, 吴满, 潘汝谦, 等.大豆/玉米间作模式及施肥水平对大豆霜霉病及大豆与玉米生长的影响[J].大豆科学, 2011, 30(6): 964-967 http://www.wanfangdata.com.cn/details/detail.do?_type=perio&id=ddkx201106016 GAO X, WU M, PAN R Q, et al. Effects of soybean/maize intercropping and fertilization on development of soybean downy mildew and growth of soybean and maize[J]. Soybean Science, 2011, 30(6): 964-967 http://www.wanfangdata.com.cn/details/detail.do?_type=perio&id=ddkx201106016 |
| [6] | 周贤玉, 唐艺玲, 王志国, 等.减量施氮与间作模式对甜玉米AMF侵染和大豆结瘤及作物氮磷吸收的影响[J].中国生态农业学报, 2017, 25(8): 1139-1146 http://www.ecoagri.ac.cn/zgstny/ch/reader/view_abstract.aspx?file_no=20170805&flag=1 ZHOU X Y, TANG Y L, WANG Z G, et al. Effects of reduced nitrogen application and intercropping on sweet corn AMF colonization, soybean nodulation and nitrogen and phosphorus absorption[J]. Chinese Journal of Eco-Agriculture, 2017, 25(8): 1139-1146 http://www.ecoagri.ac.cn/zgstny/ch/reader/view_abstract.aspx?file_no=20170805&flag=1 |
| [7] | 王晓维, 杨文亭, 缪建群, 等.玉米-大豆间作和施氮对玉米产量及农艺性状的影响[J].生态学报, 2014, 34(18): 5275-5282 http://d.old.wanfangdata.com.cn/Periodical/stxb201418017 WANG X W, YANG W T, MIAO J Q, et al. Effects of maize-soybean intercropping and nitrogen fertilizer on yield and agronomic traits of maize[J]. Acta Ecologica Sinica, 2014, 34(18): 5275-5282 http://d.old.wanfangdata.com.cn/Periodical/stxb201418017 |
| [8] | 高阳, 段爱旺, 刘祖贵, 等.单作和间作对玉米和大豆群体辐射利用率及产量的影响[J].中国生态农业学报, 2009, 17(1): 7-12 http://www.ecoagri.ac.cn/zgstny/ch/reader/view_abstract.aspx?file_no=2009102&flag=1 GAO Y, DUAN A W, LIU Z G, et al. Effect of monoculture and intercropping on radiation use efficiency and yield of maize and soybean[J]. Chinese Journal of Eco-Agriculture, 2009, 17(1): 7-12 http://www.ecoagri.ac.cn/zgstny/ch/reader/view_abstract.aspx?file_no=2009102&flag=1 |
| [9] | 唐劲驰, MBOREHA I A, 佘丽娜, 等.大豆根构型在玉米/大豆间作系统中的营养作用[J].中国农业科学, 2005, 38(6): 1196-1203 doi: 10.3321/j.issn:0578-1752.2005.06.019 TANG J C, MBOREHA I A, SHE L N, et al. Nutritional effects of soybean root architecture in a maize/soybean intercropping system[J]. Scientia Agricultura Sinica, 2005, 38(6): 1196-1203 doi: 10.3321/j.issn:0578-1752.2005.06.019 |
| [10] | 余常兵, 孙建好, 李隆.种间相互作用对作物生长及养分吸收的影响[J].植物营养与肥料学报, 2009, 15(1): 1-8 doi: 10.3321/j.issn:1008-505X.2009.01.001 YU C B, SUN J H, LI L. Effect of interspecific interaction on crop growth and nutrition accumulation[J]. Plant Nutrition and Fertilizer Science, 2009, 15(1): 1-8 doi: 10.3321/j.issn:1008-505X.2009.01.001 |
| [11] | 马心灵, 朱启林, 耿川雄, 等.不同氮水平下作物养分吸收与利用对玉米马铃薯间作产量优势的贡献[J].应用生态学报, 2017, 28(4): 1265-1273 http://d.old.wanfangdata.com.cn/Periodical/yystxb201704025 MA X L, ZHU Q L, GENG C X, et al. Contribution of nutrient uptake and utilization on yield advantage in maize and potato intercropping under different nitrogen application rates[J]. Chinese Journal of Applied Ecology, 2017, 28(4): 1265-1273 http://d.old.wanfangdata.com.cn/Periodical/yystxb201704025 |
| [12] | 肖春华, 李少昆, 刘景德, 等.不同种植方式下玉米干物质积累、养分吸收动态特点的研究[J].石河子大学学报:自然科学版, 2004, 22(5): 380-382 http://d.old.wanfangdata.com.cn/Periodical/shzdxxb200405004 XIAO C H, LI S K, LIU J D, et al. Studies on dynamics of dry matter and nutrient accumulation in maize under various planting methods[J]. Journal of Shihezi University: Natural Science, 2004, 22(5): 380-382 http://d.old.wanfangdata.com.cn/Periodical/shzdxxb200405004 |
| [13] | 何萍, 金继运, 林葆, 等.不同氮磷钾用量下春玉米生物产量及其组分动态与养分吸收模式研究[J].植物营养与肥料学报, 1998, 4(2): 123-130 doi: 10.3321/j.issn:1008-505X.1998.02.005 HE P, JIN J Y, LIN B, et al. Dynamics of biomass and its components and models of nutrients absorption by spring maize under different nitrogen, phosphorous and potassium application rates[J]. Plant Nutrition and Fertilizer Science, 1998, 4(2): 123-130 doi: 10.3321/j.issn:1008-505X.1998.02.005 |
| [14] | 柏文恋, 张梦瑶, 任家兵, 等.小麦/蚕豆间作作物生长曲线的模拟及种间互作分析[J].应用生态学报, 2018, 29(12): 4037-4046 http://www.wanfangdata.com.cn/details/detail.do?_type=perio&id=yystxb201812018 BAI W L, ZHANG M Y, REN J B, et al. Simulation of crop growth curve and analysis of interspecific interaction in wheat and faba bean intercropping system[J]. Chinese Journal of Applied Ecology, 2018, 29(12): 4037-4046 http://www.wanfangdata.com.cn/details/detail.do?_type=perio&id=yystxb201812018 |
| [15] | ZHANG W P, LIU G C, SUN J H, et al. Growth trajectories and interspecific competitive dynamics in wheat/maize and barley/maize intercropping[J]. Plant and Soil, 2015, 397(1/2): 227-238 http://www.wanfangdata.com.cn/details/detail.do?_type=perio&id=77af03a1c99333adcace30b9191ef4ff |
| [16] | FRANCIS C A. Multiple Cropping Systems[M]. New York: Macmillan, 1986 |
| [17] | Vandermeer J. The ecology of intercropping[J]. Trends in Ecology & Evolution, 1989, 4(10): 324-325 http://d.old.wanfangdata.com.cn/Periodical/ncsthj201805004 |
| [18] | 朱元刚, 高凤菊.不同间作模式对鲁西北地区玉米-大豆群体光合物质生产特征的影响[J].核农学报, 2016, 30(8): 1646-1655 http://d.old.wanfangdata.com.cn/Periodical/hnxb201608023 ZHU Y G, GAO F J. Effects of different maize and soybean intercropping patterns on population characteristics of photosynthetic and matter production in northwest Shandong region[J]. Journal of Nuclear Agricultural Sciences, 2016, 30(8): 1646-1655 http://d.old.wanfangdata.com.cn/Periodical/hnxb201608023 |
| [19] | DONG N, TANG M M, ZHANG W P, et al. Temporal differentiation of crop growth as one of the drivers of intercropping yield advantage[J]. Scientific Reports, 2018, 8(1): 3110 doi: 10.1038/s41598-018-21414-w |
| [20] | 党小燕, 刘建国, 帕尼古丽, 等.不同棉花间作模式中作物养分吸收和利用对间作优势的贡献[J].中国生态农业学报, 2012, 20(5): 513-519 http://www.ecoagri.ac.cn/zgstny/ch/reader/view_abstract.aspx?file_no=2012501&flag=1 DANG X Y, LIU J G, PANI G L, et al. Uptake and conversion efficiencies of NPK and corresponding contribution to yield advantage in cotton-based intercropping systems[J]. Chinese Journal of Eco-Agriculture, 2010, 20(5): 513-519 http://www.ecoagri.ac.cn/zgstny/ch/reader/view_abstract.aspx?file_no=2012501&flag=1 |
| [21] | 马骥, 马淑云, 程寅生, 等.玉米大豆间作效应分析[J].西北农业大学学报, 1994, 22(4): 80-84 doi: 10.3321/j.issn:1671-9387.1994.04.011 MA J, MA S Y, CHENG Y S, et al. An analysis of effect of intercropping of maize with soybean[J]. Acta University of Agriculture and Boreali-occidentalis, 1994, 22(4): 80-84 doi: 10.3321/j.issn:1671-9387.1994.04.011 |
| [22] | LOREAU M. Biodiversity and ecosystem functioning: Recent theoretical advances[J]. Oikos, 2000, 91(1): 3-17 doi: 10.1034/j.1600-0706.2000.910101.x |
| [23] | YU Y, STOMPH T J, MAKOWSKI D, et al. Temporal niche differentiation increases the land equivalent ratio of annual intercrops: A meta-analysis[J]. Field Crops Research, 2015, 184: 133-144 doi: 10.1016/j.fcr.2015.09.010 |
| [24] | 陈远学, 陈晓辉, 唐义琴, 等.不同氮用量下小麦/玉米/大豆周年体系的干物质积累和产量变化[J].草业学报, 2014, 23(1): 73-83 http://www.wanfangdata.com.cn/details/detail.do?_type=perio&id=caoyexb201401010 CHEN Y X, CHEN X H, TANG Y Q, et al. Effect of nitrogen fertilizer on dry matter accumulation and yield in wheat/maize/soybean intercropping systems[J]. Acta Prataculturae Sinica, 2014, 23(1): 73-83 http://www.wanfangdata.com.cn/details/detail.do?_type=perio&id=caoyexb201401010 |
| [25] | ZHANG L, VAN DER WERF W, BASTIAANS L, et al. Light interception and utilization in relay intercrops of wheat and cotton[J]. Field Crops Research, 2008, 107(1): 29-42 doi: 10.1016/j.fcr.2007.12.014 |
| [26] | BROKAW N, BUSING R T. Niche versus chance and tree diversity in forest gaps[J]. Trends in Ecology & Evolution, 2000, 15(5): 183-188 http://www.wanfangdata.com.cn/details/detail.do?_type=perio&id=f6e0f89f3693a37c0bf48cc5f86e6796 |
| [27] | ZHANG W P, LIU G C, SUN J H, et al. Temporal dynamics of nutrient uptake by neighbouring plant species: Evidence from intercropping[J]. Functional Ecology, 2017, 31(2): 469-479 doi: 10.1111/1365-2435.12732 |
| [28] | 宋海星, 李生秀.玉米生长量、养分吸收量及氮肥利用率的动态变化[J].中国农业科学, 2003, 36(1): 71-76 doi: 10.3321/j.issn:0578-1752.2003.01.013 SONG H X, LI S X. Dynamics of nutrient accumulation in maize plants under different water and N Supply conditions[J]. Scientia Agricultura Sinica, 2003, 36(1): 71-76 doi: 10.3321/j.issn:0578-1752.2003.01.013 |
| [29] | 赵胜利, 龙光强, 杨超, 等.施氮对玉米//马铃薯间作作物氮累积和分配的影响[J].云南农业大学学报:自然科学, 2016, 31(5): 886-894 http://www.cqvip.com/QK/94499X/201605/670088039.html ZHAO S L, LONG G Q, YANG C, et al. Effects of nitrogen application on nitrogen accumulation and distribution of crops in maize and potato intercropping[J]. Journal of Yunnan Agricultural University: Natural Science, 2016, 31(5): 886-894 http://www.cqvip.com/QK/94499X/201605/670088039.html |
| [30] | 李隆, 李晓林, 张福锁, 等.小麦大豆间作条件下作物养分吸收利用对间作优势的贡献[J].植物营养与肥料学报, 2000, 6(2): 140-146 doi: 10.3321/j.issn:1008-505X.2000.02.003 LI L, LI X L, ZHANG F S, et al. Uptake and utilization of nitrogen, phosphorus and potassium as related to yield advantage in wheat/soybean intercropping[J]. Plant Nutrition and Fertilizer Science, 2000, 6(2): 140-146 doi: 10.3321/j.issn:1008-505X.2000.02.003 |
