乔娟,
中国农业大学经济管理学院 北京 100083
基金项目: 国家社会科学基金项目18BGL169
生猪产业技术体系北京市创新团队项目BAIC02-2018
详细信息
作者简介:王欢, 主要研究方向为农业资源环境与农村经济。E-mail:wangh1127@163.com
通讯作者:乔娟, 主要研究方向为农业经济理论与政策。E-mail:qiaojuan@cau.edu.cn
中图分类号:F323;X24计量
文章访问数:850
HTML全文浏览量:1
PDF下载量:913
被引次数:0
出版历程
收稿日期:2018-09-09
录用日期:2018-12-09
刊出日期:2019-05-01
Decoupling and predictive analysis of greenhouse gas emission from animal husbandry in China
WANG Huan,QIAO Juan,
College of Economics & Management, China Agricultural University, Beijing 100083, China
Funds: the Philosophy and Social Science Foundation of China18BGL169
the Beijing Pig Industry Technology System Innovation Team ProjectBAIC02-2018
More Information
Corresponding author:E-mail: qiaojuan@cau.edu.cn
摘要
HTML全文
图
参考文献
相关文章
施引文献
资源附件
访问统计
摘要
摘要:面对日益严峻的温室气体排放形势,中国做出到2030年左右二氧化碳排放达到峰值的承诺,其中畜牧业成为重要减排领域,因此,研究中国畜牧业温室气体排放现状及趋势尤为必要。基于2000-2014年省级面板数据,在参考《省级温室气体排放清单指南》测算畜牧业温室气体排放量基础上,借助Tapio脱钩模型分析畜牧业温室气体排放与经济发展之间的关系,采用LMDI模型分解其影响因素,并构建不同情景对2020年畜牧业温室气体排放目标进行分析。研究结果表明:畜牧业温室气体排放量总体呈下降趋势,非奶牛减排明显,是下降主因,但其仍处于50%水平之上,排放量达18 180.54万t;羊、生猪、奶牛排放量增加,分别为7 072.56万t、6 202.69万t、4 359.97万t。畜牧业温室气体排放脱钩效应比较理想,全国以弱脱钩状态为主,但经历波动变化、相对平稳、持续上升3个发展阶段,脱钩状态不稳定。综合效应在国家层面呈倒“U”型特征,但在省份间差异明显;生产效率效应是国家和省份减排的最大贡献者,经济发展效应则是增排的最主要推动因素;综合效应差异主要来自产业结构效应和劳动力效应的不同。2020年畜牧业温室气体排放远超管控目标,预测区间端点值分别超过目标12.84%和34.71%,减排压力大。因此,应调整产业结构,适当进口畜产品;针对不同地区脱钩状态差别化治理,提高养殖效率;明确畜牧业减排目标,分解管控任务。
关键词:畜牧业/
温室气体排放/
脱钩模型/
LMDI模型/
情景预测
Abstract:With increasing greenhouse gas emission, China has committed to cap carbon dioxide emissions by 2030. As animal husbandry has become an important part of the emission reduction effort, it is necessary to analyze the current situation and trend in greenhouse gas emission due to animal husbandry in the country. Based on the 2000-2014 provincial panel data and the Guidelines on Provincial Greenhouse Gas Emission Inventories, we estimated greenhouse gas emission due to animal husbandry and then used the Tapio decoupling model to analyze the relationship between greenhouse gas emission and the economic development due to animal husbandry. Furthermore, LMDI model was used to decompose the driving factors, and the greenhouse gas emissions target of animal husbandry in 2020 under different scenarios were also analyzed. The results suggested that greenhouse gas emission from animal husbandry decreased from 377.852 4 million tons in 2000 to 358.157 6 million tons in 2014, representing a drop of 5.21%. Emission reduction from non-dairy cattle was significant. However, it was still above the 50% threshold — 181.805 4 million tons. Emissions from sheep, pigs and cattle were respectively 70.725 6 million tons, 62.026 9 million tons and 43.599 7 million tons, all of which still increased. The decoupling effect of greenhouse gas emission from animal husbandry was ideal. The whole country was under weak decoupling that underwent three stages of fluctuation — relative stability — increase. The decoupling condition for each province was good, among which 15 provinces had strong decoupling, 15 provinces had weak decoupling and 1 province had receding decoupling. The comprehensive effect tracked an inverted U-curve at the national level, which was quite different for the provinces. The efficiency of production was the main contributor to the national and provincial emission reductions, while the effect of economic development was the most important driving factor of emission. The difference in comprehensive effect mainly came from the difference in industrial structure and labor. In 2020, greenhouse gas emission from animal husbandry far exceeded planned target. The predicted range of greenhouse gas emission from animal husbandry was from 335.630 8 to 400.677 1 million tons. Then the predicted endpoint values were respectively 12.84% and 34.71% more than the target, which great increased the pressure of emission reduction. In this case, only the lowest decoupling elasticity and the fastest economic growth rate had the least greenhouse gas emission gap. Greenhouse gas emission reduction was an inevitable requirement for sustainable development in the world. Although the decoupling effect of greenhouse gas emission from animal husbandry in China was obvious under the effect of several factors, emission reduction was still an arduous task, requiring the formulation of practical measures to promote it. Therefore, this work suggested that China needed to adjust its industrial structure and import livestock products instead of promoting domestic production. There was the need to implement differential governance of decoupling in different regions and improving farming efficiency. Also, clear animal husbandry emission reduction objectives and task assignments to provinces were required.
Key words:Animal husbandry/
Greenhouse gas emission/
Decoupling model/
LMDI model/
Prediction
HTML全文
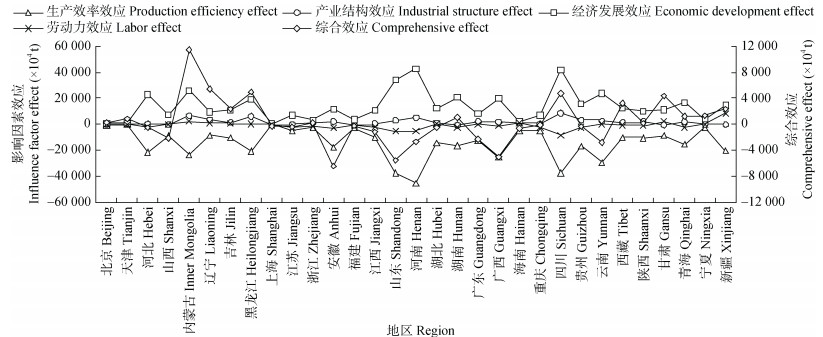
图12000—2014年各省区市畜牧业温室气体排放影响因素分解
Figure1.Decomposition of factors influencing greenhouse gas emission of animal husbandry in different regions of China during 2000-2014
 下载: 全尺寸图片幻灯片
表1畜牧业温室气体排放Tapio脱钩类型划分
Table1.Detailed classification of decoupling indicators of Tapio of greenhouse gas emission from animal husbandry
| 温室气体排放量变化量/温室气体排放量 ΔG/G | 畜牧业产值变化量/畜牧业产值 ΔH/H | 脱钩弹性(t) Decoupling elasticity | 脱钩状态 Decoupling state | 脱钩类型 Decoupling type |
| > 0 | > 0 | (1.2, +∞) | 扩张负脱钩Expansion negative decoupling | 负脱钩 Negative decoupling |
| > 0 | < 0 | (-∞, 0) | 强负脱钩Strong negative decoupling | |
| < 0 | < 0 | [0, 0.8) | 弱负脱钩Weak negative decoupling | |
| > 0 | > 0 | [0, 0.8) | 弱脱钩Weak decoupling | 脱钩 Decoupling |
| < 0 | > 0 | (-∞, 0) | 强脱钩Strong decoupling | |
| < 0 | < 0 | (1.2, +∞) | 衰退脱钩Recessive decoupling | |
| > 0 | > 0 | [0.8, 1.2] | 扩张连接Expansion connection | 连接 Connection |
| < 0 | < 0 | [0.8, 1.2] | 衰退连接Recession connection | |
| ??G: greenhouse gas emission; H: output value of animal husbandry. | ||||
下载: 导出CSV表2畜牧业温室气体排放量测量指标的统计性描述
Table2.Statistical descriptions of measurement indicators of greenhouse gas emission from animal husbandry in China
| 指标 Indicator | 均值 Mean | 中位数 Median | 标准差 Standard deviation | 最大值 Maximum value | 最小值 Minimum value |
| 生猪平均饲养量Average number of live pig (×104 head) | 31 207.33 | 31 827.25 | 3 127.92 | 36 251.85 | 25 975.87 |
| 奶牛平均饲养量Average number of dairy cow (×104 head) | 1 122.17 | 1 246.90 | 349.77 | 1 470.15 | 489.00 |
| 非奶牛平均饲养量Average number of other cow (×104 head) | 10 842.37 | 10 974.99 | 1 708.72 | 12 810.33 | 8 884.90 |
| 羊平均饲养量Average number of sheep (×104 head) | 30 933.95 | 29 429.40 | 3 249.83 | 37 081.45 | 28 161.80 |
| 家禽平均饲养量Average number of poultry (×104 head) | 151 467.20 | 153 335.90 | 20 481.96 | 181 982.90 | 121 879.20 |
| 兔平均饲养量Average number of rabbit (×104 head) | 11 568.35 | 11 946.96 | 2 386.01 | 14 866.53 | 7 444.44 |
| 马平均饲养量Average number of horse (×104 head) | 727.63 | 711.15 | 82.81 | 876.80 | 603.70 |
| 驴平均饲养量Average number of donkey (×104 head) | 737.69 | 710.00 | 108.82 | 922.80 | 592.95 |
| 骡平均饲养量Average number of mule (×104 head) | 333.82 | 322.00 | 77.08 | 453.20 | 227.70 |
| 畜牧业产值Animal husbandry output value (×104 ¥) | 9 650.98 | 9 460.57 | 1 860.90 | 12 787.77 | 7 165.85 |
| 农业总产值Gross agricultural output value (×104 ¥) | 33 815.03 | 33 147.87 | 6 520.20 | 44 805.71 | 25 107.66 |
| 农业从业劳动力Agricultural workers (×104 person) | 31 049.90 | 31 444.00 | 4 755.55 | 36 870.00 | 22 790.00 |
下载: 导出CSV表32000—2014年中国畜牧业温室气体排放情况1)
Table3.Greenhouse gas emission of Chinese animal husbandry during 2000-20141)
| 104t | |||||
| 年份Year | 生猪Pig | 奶牛Dairy cow | 非奶牛Other cow | 羊Sheep | 合计Total |
| 2000 | 4 444.47 | 1 450.21 | 24 971.31 | 6 919.24 | 37 785.24 |
| 2001 | 4 635.46 | 1 564.98 | 24 850.57 | 7 013.91 | 38 064.92 |
| 2002 | 4 782.91 | 1 859.32 | 24 870.54 | 7 326.44 | 38 839.22 |
| 2003 | 4 995.23 | 2 343.84 | 25 189.65 | 7 830.19 | 40 358.91 |
| 2004 | 5 214.63 | 2 967.31 | 25 468.71 | 8 424.18 | 42 074.83 |
| 2005 | 5 577.28 | 3 446.17 | 25 839.27 | 8 806.98 | 43 669.71 |
| 2006 | 5 741.95 | 3 824.59 | 25 745.56 | 8 837.62 | 44 149.73 |
| 2007 | 4 768.07 | 3 839.08 | 22 141.60 | 7 800.71 | 38 549.46 |
| 2008 | 5 148.46 | 3 646.52 | 18 874.99 | 6 750.67 | 34 420.65 |
| 2009 | 5 445.64 | 3 697.88 | 18 973.20 | 6 737.26 | 34 853.98 |
| 2010 | 5 626.89 | 3 975.02 | 18 835.71 | 6 737.59 | 35 175.21 |
| 2011 | 5 583.31 | 4 241.49 | 18 285.15 | 6 711.80 | 34 821.75 |
| 2012 | 5 888.71 | 4 351.07 | 17 924.93 | 6 761.39 | 34 926.10 |
| 2013 | 6 037.88 | 4 352.25 | 17 948.94 | 6 856.77 | 35 195.83 |
| 2014 | 6 202.69 | 4 359.97 | 18 180.54 | 7 072.56 | 35 815.76 |
| ??1)实证中未涉及马、骡、驴、兔、骆驼和家禽, 理由有3点:一是仅内蒙古、新疆、甘肃、青海、宁夏5个省区有骆驼且数量很少, 故予以剔除; 二是历年这些畜禽种类的温室气体排放之和仅占总排放量的3.5%左右, 去除不影响结论; 三是国家未出台这些种类生产相关规划, 缺乏后文分析所需数据。1) There are three reasons for the absence of horses, mules, donkeys, rabbits, camels and poultry in the empirical study. First, only five provinces and regions, which are Inner Mongolia, Xinjiang, Gansu, Qinghai and Ningxia, have a small number of camels, so they are eliminated. Second, the total greenhouse gas emission of these livestock and poultry species accounts for only about 3.5% of the total emissions over the years. Third, the state has not promulgated these kinds of production related planning, and lacks the data needed for subsequent analysis. | |||||
下载: 导出CSV表42000—2014年中国畜牧业温室气体排放量与畜牧业产值脱钩关系
Table4.Decoupling relationship between greenhouse gas emission and output value of Chinese animal husbandry during 2000-2014
| 年份 Year | 温室气体排放量变化量/温室气体排放量 ΔG/G | 畜牧业产值变化量/畜牧业产值 ΔH/H | 脱钩弹性(t) Decoupling elasticity | 脱钩状态 Decoupling state |
| 2000 | 0.020 | 0.024 | 0.838 | 扩张连接Expansion connection |
| 2001 | 0.007 | 0.028 | 0.264 | 弱脱钩Weak decoupling |
| 2002 | 0.020 | 0.029 | 0.701 | 弱脱钩Weak decoupling |
| 2003 | 0.039 | 0.025 | 1.565 | 扩张负脱钩Expansion negative decoupling |
| 2004 | 0.043 | 0.063 | 0.675 | 弱脱钩Weak decoupling |
| 2005 | 0.038 | 0.052 | 0.729 | 弱脱钩Weak decoupling |
| 2006 | 0.011 | 0.050 | 0.220 | 弱脱钩Weak decoupling |
| 2007 | -0.127 | 0.037 | -3.428 | 强脱钩Strong decoupling |
| 2008 | -0.107 | 0.054 | -1.983 | 强脱钩Strong decoupling |
| 2009 | 0.013 | 0.042 | 0.300 | 弱脱钩Weak decoupling |
| 2010 | 0.009 | 0.043 | 0.214 | 弱脱钩Weak decoupling |
| 2011 | -0.010 | 0.042 | -0.239 | 强脱钩Strong decoupling |
| 2012 | 0.003 | 0.045 | 0.067 | 弱脱钩Weak decoupling |
| 2013 | 0.008 | 0.040 | 0.193 | 弱脱钩Weak decoupling |
| 2014 | 0.018 | 0.042 | 0.419 | 弱脱钩Weak decoupling |
| ??G: greenhouse gas emission; H: output value of animal husbandry. | ||||
下载: 导出CSV表52000—2014年各省份畜牧业温室气体排放量与畜牧业产值脱钩关系
Table5.Decoupling relationship between greenhouse gas emission and output value of animal husbandry in different regions of China during 2000-2014
| 地区 Region | 脱钩弹性(t) Decoupling elasticity | 脱钩状态 Decoupling state |
| 北京Beijing | 0.011 | 弱脱钩Weak decoupling |
| 天津Tianjin | 0.577 | 弱脱钩Weak decoupling |
| 河北Hebei | -0.138 | 强脱钩Strong decoupling |
| 山西Shanxi | -0.198 | 强脱钩Strong decoupling |
| 内蒙古Inner Mongolia | 0.257 | 弱脱钩Weak decoupling |
| 辽宁Liaoning | 0.301 | 弱脱钩Weak decoupling |
| 吉林Jilin | 0.067 | 弱脱钩Weak decoupling |
| 黑龙江Heilongjiang | 0.124 | 弱脱钩Weak decoupling |
| 上海Shanghai | 3.469 | 衰退脱钩Recessive decoupling |
| 江苏Jiangsu | -0.158 | 强脱钩Strong decoupling |
| 浙江Zhejiang | -0.091 | 强脱钩Strong decoupling |
| 安徽Anhui | -0.440 | 强脱钩Strong decoupling |
| 福建Fujian | -0.069 | 强脱钩Strong decoupling |
| 江西Jiangxi | -0.005 | 强脱钩Strong decoupling |
| 山东Shandong | -0.195 | 强脱钩Strong decoupling |
| 河南Henan | -0.128 | 强脱钩Strong decoupling |
| 湖北Hubei | 0.028 | 弱脱钩Weak decoupling |
| 湖南Hunan | 0.037 | 弱脱钩Weak decoupling |
| 广东Guangdong | -0.224 | 强脱钩Strong decoupling |
| 广西Guangxi | -0.206 | 强脱钩Strong decoupling |
| 海南Hainan | -0.170 | 强脱钩Strong decoupling |
| 重庆Chongqing | 0.035 | 弱脱钩Weak decoupling |
| 四川Sichuan | 0.067 | 弱脱钩Weak decoupling |
| 贵州Guizhou | -0.085 | 强脱钩Strong decoupling |
| 云南Yunnan | -0.035 | 强脱钩Strong decoupling |
| 西藏Tibet | 0.115 | 弱脱钩Weak decoupling |
| 陕西Shaanxi | -0.061 | 强脱钩Strong decoupling |
| 甘肃Gansu | 0.272 | 弱脱钩Weak decoupling |
| 青海Qinghai | 0.050 | 弱脱钩Weak decoupling |
| 宁夏Ningxia | 0.292 | 弱脱钩Weak decoupling |
| 新疆Xinjiang | 0.069 | 弱脱钩Weak decoupling |
下载: 导出CSV表62000—2014年中国畜牧业温室气体排放影响因素分解
Table6.Decomposition of factors influencing greenhouse gas emission of Chinese animal husbandry during 2000—2014
| 104t | |||||
| 年份 Year | 生产效率效应 Production efficiency effect | 产业结构效应 Industrial structure effect | 经济发展效应 Economic development effect | 劳动力效应 Labor effect | 综合效应 Comprehensive effect |
| 2000 | -1 311.95 | 1 456.44 | 138.65 | 461.94 | 745.08 |
| 2001 | -3 828.80 | 2 392.82 | 2 415.86 | 44.58 | 1 023.69 |
| 2002 | -5 375.79 | 2 973.49 | 4 714.96 | -514.16 | 1 798.49 |
| 2003 | -8 663.19 | 4 578.53 | 8 762.17 | -1 358.66 | 3 318.84 |
| 2004 | -16 835.94 | 6 440.96 | 17 672.81 | -2 238.64 | 5 039.19 |
| 2005 | -19 257.23 | 6 740.77 | 22 251.03 | -3 100.38 | 6 634.19 |
| 2006 | -19 916.48 | 4 825.84 | 23 778.23 | -1 578.22 | 7 109.36 |
| 2007 | -30 037.95 | 5 465.24 | 30 680.04 | -4 598.32 | 1 509.00 |
| 2008 | -41 153.66 | 7 782.96 | 35 439.46 | -4 688.56 | -2 619.80 |
| 2009 | -38 957.00 | 4 396.22 | 37 480.85 | -5 106.47 | -2 186.40 |
| 2010 | -41 236.19 | 1 853.45 | 43 085.91 | -5 568.51 | -1 865.34 |
| 2011 | -49 045.90 | 3 769.02 | 47 549.58 | -4 491.40 | -2 218.70 |
| 2012 | -50 938.70 | 2 266.25 | 51 736.14 | -5 178.12 | -2 114.43 |
| 2013 | -52 473.56 | 969.96 | 55 572.67 | -5 913.68 | -1 844.61 |
| 2014 | -52 955.50 | -273.70 | 58 373.58 | -6 369.07 | -1 224.69 |
下载: 导出CSV表72015—2020年中国畜牧业经济增长速度和脱钩弹性预期值
Table7.Expected values of economic growth and decoupling elasticity of Chinese animal husbandry during 2015-2020
| 最大值Maximum value | 平均值Mean | 最小值Minimum value | |
| 经济增长速度Economic growth rate | 0.045 | 0.042 | 0.040 |
| 脱钩弹性(t) Decoupling elasticity | 0.419 | 0.131 | -0.239 |
下载: 导出CSV表82020年中国畜牧业温室气体排放量预测值和缺口
Table8.Predicted value and gap of greenhouse gas emission in Chinese animal husbandry in 2020
| 104t | |||||||||
| 温室气体排放量预测值 Predicted value of greenhouse gas emission | 温室气体排放量缺口 Greenhouse gas emission gap | ||||||||
| Vl | Vm | Vs | Vl | Vm | Vs | ||||
| tl | 40 067.71 | 39 811.10 | 39 575.45 | 10 323.36 | 10 066.75 | 9 831.10 | |||
| tm | 37 099.39 | 37 024.20 | 36 954.90 | 7 355.04 | 7 279.84 | 7 210.55 | |||
| ts | 33 563.08 | 33 689.94 | 33 807.39 | 3 818.73 | 3 945.59 | 4 063.04 | |||
| ??Vl、Vm、Vs分别代表畜牧业产值增长速度快、中等和慢, tl、tm、ts分别代表畜牧业温室气体排放与畜牧业产值增长脱钩弹性高、中等和低。Vl, Vm and Vs respectively represent fast, medium and slow growth rates of output value of animal husbandry; tl, tm and ts respectively represent high, medium and low decoupling elasticity between greenhouse emissions and output value growth of animal husbandry of China. | |||||||||
下载: 导出CSV参考文献
| [1] | PETERSEN S O, BLANCHARD M, CHADWICK D, et al. Manure management for greenhouse gas mitigation[J]. Animal, 2013, 7(S2):266-282 http://d.old.wanfangdata.com.cn/NSTLQK/NSTL_QKJJ0227028121/ |
| [2] | CARO D, DAVIS S J, BASTIANONI S, et al. Global and regional trends in greenhouse gas emissions from livestock[J]. Climatic Change, 2014, 126(1/2):203-216 http://www.wanfangdata.com.cn/details/detail.do?_type=perio&id=63a4fe560b699b61a8f19d062b43f072 |
| [3] | FAO. FAO Statistical Yearbook 2013 World Food and Agriculture[M]. Rome:Food and Agriculture Organization of the United Nations, 2013 |
| [4] | GERBER P J, STEINFELD H, HENDERSON B, et al. Tackling climate change through livestock: A global assessment of emissions and mitigation opportunities[R]. Rome: Food and Agriculture Organization of the United Nations, 2013 |
| [5] | 陈瑶, 尚杰.中国畜牧业脱钩分析及影响因素研究[J].中国人口·资源与环境, 2014, 24(3):101-107 doi: 10.3969/j.issn.1002-2104.2014.03.015 CHEN Y, SHANG J. Disconnect analysis and influence factors of animal husbandry in China[J]. China Population, Resources and Environment, 2014, 24(3):101-107 doi: 10.3969/j.issn.1002-2104.2014.03.015 |
| [6] | 董红敏, 林而达, 杨其长.中国反刍动物甲烷排放量的初步估算及减缓技术[J].农村生态环境, 1995, 11(3):4-7 http://www.wanfangdata.com.cn/details/detail.do?_type=perio&id=QK199500365156 DONG H M, LIN E D, YANG Q C. Methane emitted from ruminants in China and the mitigation technologies[J]. Rural Eco-Environment, 1995, 11(3):4-7 http://www.wanfangdata.com.cn/details/detail.do?_type=perio&id=QK199500365156 |
| [7] | ZHOU J B, JIANG M M, CHEN G Q. Estimation of methane and nitrous oxide emission from livestock and poultry in China during 1949-2003[J]. Energy Policy, 2007, 35(7):3759-3767 doi: 10.1016/j.enpol.2007.01.013 |
| [8] | 胡向东, 王济民.中国畜禽温室气体排放量估算[J].农业工程学报, 2010, 26(10):247-252 doi: 10.3969/j.issn.1002-6819.2010.10.042 HU X D, WANG J M. Estimation of livestock greenhouse gases discharge in China[J]. Transactions of the CSAE, 2010, 26(10):247-252 doi: 10.3969/j.issn.1002-6819.2010.10.042 |
| [9] | 闵继胜, 胡浩.中国农业生产温室气体排放量的测算[J].中国人口·资源与环境, 2012, 22(7):21-27 doi: 10.3969/j.issn.1002-2104.2012.07.004 MIN J S, HU H. Calculation of greenhouse gases emission from agricultural production in China[J]. China Population, Resources and Environment, 2012, 22(7):21-27 doi: 10.3969/j.issn.1002-2104.2012.07.004 |
| [10] | 陈苏, 胡浩.中国畜禽温室气体排放时空变化及影响因素研究[J].中国人口·资源与环境, 2016, 26(7):93-100 doi: 10.3969/j.issn.1002-2104.2016.07.012 CHEN S, HU H. Study on the spatial-temporal changes and influence factors of greenhouse gases emission from livestock and poultry in China[J]. China Population, Resources and Environment, 2016, 26(7):93-100 doi: 10.3969/j.issn.1002-2104.2016.07.012 |
| [11] | 易平, 方世明, 马春艳.地质公园旅游经济增长与生态环境压力脱钩评价——以嵩山世界地质公园为例[J].自然资源学报, 2014, 29(8):1282-1296 http://www.wanfangdata.com.cn/details/detail.do?_type=perio&id=zrzyxb201408002 YI P, FANG S M, MA C Y. Decoupling evaluation between tourism economic growth and eco-environmental pressure of Songshan Global Geopark[J]. Journal of Natural Resources, 2014, 29(8):1282-1296 http://www.wanfangdata.com.cn/details/detail.do?_type=perio&id=zrzyxb201408002 |
| [12] | 舒畅, 乔娟.我国养殖业生态足迹时空特征及脱钩效应研究——以生猪产业为例[J].生态经济, 2016, 32(1):148-151 doi: 10.3969/j.issn.1671-4407.2016.01.032 SHU C. QIAO J. Research on spatial-temporal characteristics and decoupling effect of the breeding ecological footprint in China:Taking pig breeding as an example[J]. Ecological Economy, 2016, 32(1):148-151 doi: 10.3969/j.issn.1671-4407.2016.01.032 |
| [13] | 潘丹, 孔凡斌.鄱阳湖生态经济区畜禽养殖污染与产业发展的关系——基于脱钩和LMDI模型的实证分析[J].江西社会科学, 2015, 35(6):49-55 http://www.wanfangdata.com.cn/details/detail.do?_type=perio&id=jxshkx201506008 PAN D, KONG F B. The relationship between livestock pollution and industrial development in Poyang Lake ecological economic zone:An empirical analysis based on decoupling and LMDI model[J]. Jiangxi Social Sciences, 2015, 35(6):49-55 http://www.wanfangdata.com.cn/details/detail.do?_type=perio&id=jxshkx201506008 |
| [14] | TIAN J X, YANG H L, XIANG P A, et al. Drivers of agricultural carbon emissions in Hunan Province, China[J]. Environmental Earth Sciences, 2016, 75(2):121 http://www.wanfangdata.com.cn/details/detail.do?_type=perio&id=5fb3174504be9eec5d953d839822c873 |
| [15] | 李忠民, 陈向涛, 姚宇.基于弹性脱钩的中国减排目标缺口分析[J].中国人口·资源与环境, 2011, 21(1):57-63 doi: 10.3969/j.issn.1002-2104.2011.01.011 LI Z M, CHEN X T, YAO Y. Gap of emission reduction targets:Analysis based on elastic decoupling of China[J]. China Population, Resources and Environment, 2011, 21(1):57-63 doi: 10.3969/j.issn.1002-2104.2011.01.011 |
| [16] | 肖丽群, 吴群.基于脱钩指数的2020年江苏省耕地保有量目标分析[J].资源科学, 2012, 34(3):442-448 http://d.old.wanfangdata.com.cn/Periodical/zykx201203007 XIAO L Q, WU Q. Target analysis of cultivated land protection area in Jiangsu Province in 2020 based on decoupling index[J]. Resources Science, 2012, 34(3):442-448 http://d.old.wanfangdata.com.cn/Periodical/zykx201203007 |
| [17] | 刘琼, 佴伶俐, 欧名豪, 等.基于脱钩情景的中国建设用地总量管控目标分析[J].南京农业大学学报:社会科学版, 2014, 14(2):80-85 http://www.wanfangdata.com.cn/details/detail.do?_type=perio&id=njnydxxb-shkxb201402012 LIU Q, NAI L L, OU M H, et al. Analysis on control objective of construction land in China based on decoupling scene[J]. Journal of Nanjing Agricultural University:Social Science Edition, 2014, 14(2):80-85 http://www.wanfangdata.com.cn/details/detail.do?_type=perio&id=njnydxxb-shkxb201402012 |
| [18] | TAPIO P. Towards a theory of decoupling:Degrees of decoupling in the EU and the case of road traffic in Finland between 1970 and 2001[J]. Transport Policy, 2005, 12(2):137-151 doi: 10.1016/j.tranpol.2005.01.001 |
| [19] | ANG B W. Decomposition analysis for policymaking in energy:Which is the preferred method?[J]. Energy Policy, 2004, 32(9):1131-1139 doi: 10.1016/S0301-4215(03)00076-4 |
