覃求
西安建筑科技大学管理学院 西安 710055
基金项目: 陕西省社会科学基金项目12Q023
陕西省教育厅专项科研计划项目13JK0223
详细信息
作者简介:张炜, 主要研究方向为资源环境管理和项目投资优化与决策。E-mail:352753390@qq.com
中图分类号:S271计量
文章访问数:746
HTML全文浏览量:5
PDF下载量:701
被引次数:0
出版历程
收稿日期:2018-05-08
录用日期:2018-09-20
刊出日期:2019-01-01
Decoupling analysis on water resources utilization of planting industry and economic development in Shaanxi Province from the perspective of water footprint
ZHANG Wei,,QIN Qiu
School of Management, Xi'an University of Architecture and Technology, Xi'an 710055, China
Funds: Shaanxi Provincial Social Science Fund12Q023
Shaanxi Provincial Department of Education Special Research Project13JK0223
More Information
Corresponding author:ZHANG Wei, E-mail: 352753390@qq.com
摘要
HTML全文
图
参考文献
相关文章
施引文献
资源附件
访问统计
摘要
摘要:陕西省位于"一带一路"关键地带,经济发展将处于加速转型的关键时期,期间农业水资源可利用量势必被进一步压缩,因此对陕西省各地市种植业水足迹进行量化并研究与其经济发展的协调关系,有利于明确各区域种植业生产的用水情况并为陕西省水资源管理提供参考。本研究运用水足迹理论,将灌溉水在输配水及田间灌溉过程中的损失纳入作物区域生产水足迹核算之中,通过核算2005-2016年陕西省种植业的水足迹值,定量分析了陕西省各作物耗水量的时空差异性,以及绿水足迹利用效率和各市水环境压力状况,并结合脱钩模型研究了种植业经济增长与水资源利用和水环境变化的脱钩关系。结果显示:1)各作物耗水量在研究期内差异较大,蔬菜和水果水足迹较低,分别为0.42 m3·kg-1和0.51 m3·kg-1,茶叶则高达30.29 m3·kg-1,但总体呈下降趋势;2)各地市种植业耗水量构成呈现较大差异性,关中地区粮食类作物占比为69.59%,陕北地区玉米和水果占75.16%,陕南地区则相对均衡,耗水量组成基本与水资源禀赋和作物水足迹大小相一致;3)全省绿水足迹利用效率相对较低,水环境压力指数呈现南部低,中部、北部高的特点,其中咸阳市水环境压力指数12年间平均高达4.75,是水环境压力最为严重地区;4)陕西省种植业经济增长与水资源利用和水环境压力强脱钩状态分别占比45.45%和27.27%。研究结果说明,陕西省各市种植结构相对合理,但绿水足迹利用效率和水环境压力上仍需改良,种植业经济增长与水资源利用的关系逐渐完成了由弱脱钩的初级协调到强脱钩的优质协调的转变,但仍面临着种植业经济增长与水环境压力增大的挑战。
关键词:陕西省/
水足迹/
Tapio脱钩模型/
种植业/
经济增长/
水环境压力/
作物耗水量/
水足迹利用效率
Abstract:Shaanxi Province is located in a key area of the "One Belt One Road" promoted by China. The availability of agricultural water resources is bound to be further scarce due to accelerated economic transformation as a result of the "One Belt One Road" project. To therefore quantify water footprint of the crop industry and to determine the co-ordination between planting and economic development are critical for further clarification of the water use in planting and setting up relevant reference basis for water resources management in Shaanxi Province. Thus this paper incorporated the loss of water during distribution and irrigation of crop water footprint. By accounting for the value of water footprint of the crop industry in Shaanxi Province for the period 2005-2016, we analyzed the spatial and temporal differences in water consumption by various crops in Shaanxi Province, the utilization efficiency of green water and the pressure of water environment. Combined with the Tapio model, the change in relationship between economic growth of crop farming, water resource utilization and water environment was determined. The results showed that:1) water consumption by various crops was significantly different during the study period. The water footprint of vegetables and fruits were respectively 0.42 m3·kg-1 and 0.51 m3·kg-1, while that of tea was as high as 30.29 m3·kg-1. However, there was an overall downward trend in water use. 2) The water consumption composition of planting industry in different areas was quite different, crop water consumption proportion in Guanzhong was 69.59%, grain and corn water consumption proportion in northern Shaanxi was 75.16% and that in southern Shaanxi was relative equilibrium among various corps. The water consumption composition was basically the same as water endowment and crop water footprint. 3) The use efficiency of green water footprint was relatively low. Also the pressure index of water environment was low in the south, high in the central and north. The average water environment pressure index for Xianyang was as high as 4.75 in 12 years, indicating serious water environment pressure. 4) The decoupling of economic growth of crop industry with water resource use and water environment pressure accounted respectively for 45.45% and 27.27% of total water use in the province. The research results showed that planting structure in Shaanxi Province was relatively reasonable and that green water footprint was hugely utilized. The efficiency and pressure of water environment still needed improvement. The relationship between economic growth of crop industry and water resources use was being gradually transformed from primary co-ordination of weak decoupling to quality co-ordination of strong decoupling. However, it still faced the change of industrial diversity, economic growth and environmental pressures.
Key words:Shaanxi Province/
Water footprint/
Tapio decoupling model/
Crop industry/
Economic growth/
Water environment pressure/
Crop water consumption/
Water footprint use efficiency
HTML全文
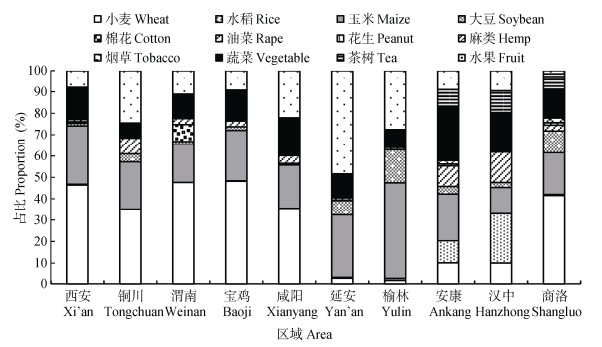
图12005—2016年陕西省各地级市种植业各种作物耗水量平均组成
Figure1.Average proportions of water consumptions of different crops in planting industry in various cities of Shaanxi Province during 2005 to 2016
 下载: 全尺寸图片幻灯片
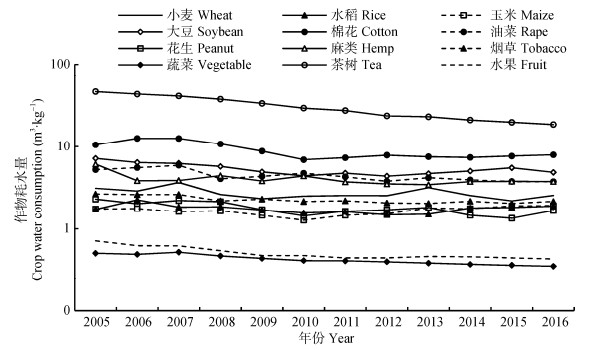
图22005—2016年陕西省作物耗水量变化趋势
Figure2.Trends of water consumption of different crops in Shaanxi Province during 2005 to 2016
下载: 全尺寸图片幻灯片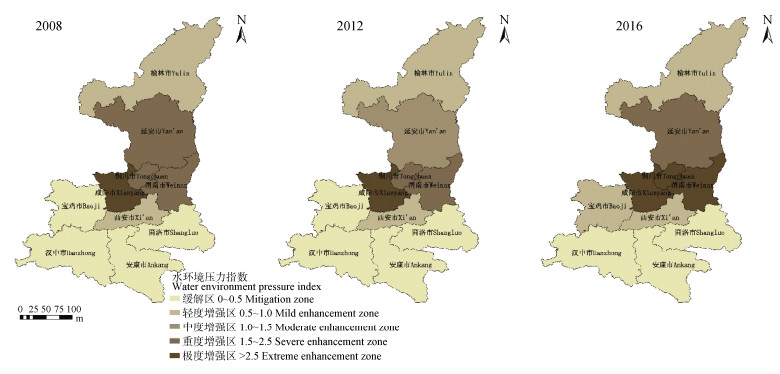
图32008年、2012年和2016年陕西省水资源环境压力空间变化
Figure3.Spatial variation of environmental pressure on water resources in Shaanxi Province in 2008, 2012 and 2016
下载: 全尺寸图片幻灯片表1陕西省2005—2016年间灌溉水利用系数
Table1.Irrigation water utilization coefficients in Shaanxi Province from 2005 to 2016
| 年份Year | 2005 | 2006 | 2007 | 2008 | 2009 | 2010 | 2011 | 2012 | 2013 | 2014 | 2015 | 2016 |
| 灌溉水利用系数 Irrigation water utilization coefficient | 0.48 | 0.50 | 0.51 | 0.52 | 0.53 | 0.54 | 0.54 | 0.55 | 0.55 | 0.55 | 0.56 | 0.56 |
下载: 导出CSV表2Tapio指数脱钩程度判断表[29]
Table2.Tapio index decoupling degree judgment table
| 脱钩类型 Decoupling type | 脱钩状态 Decoupling state | Δ种植业总产值(ΔTPO) Δ total planting output value | Δ水足迹/Δ灰水足迹 (ΔWF/ΔWFgrey) Δ water footprint /Δ green water footprint | 脱钩指数(DE) Decoupling index |
| 负脱钩 Negative decoupling | 弱负脱钩Weak negative decoupling | < 0 | < 0 | 0 < DE < 0.8 |
| 强负脱钩Strong negative decoupling | < 0 | > 0 | DE < 0 | |
| 增长负脱钩Expansive negative decoupling | > 0 | > 0 | DE > 1.2 | |
| 脱钩 Decoupling | 衰退脱钩Recessive decoupling | < 0 | < 0 | DE > 1.2 |
| 强脱钩Strong decoupling | > 0 | < 0 | DE < 0 | |
| 弱脱钩Weak decoupling | > 0 | > 0 | 0 < DE < 0.8 | |
| 耦合 Coupling | 衰退型耦合Recessive coupling | < 0 | < 0 | 0.8 < DE < 1.2 |
| 扩张性耦合Expansion coupling | > 0 | > 0 | 0.8 < DE < 1.2 |
下载: 导出CSV表32005—2016年陕西省各地级市作物绿水足迹平均相对占比
Table3.Average relative proportions of crop green water footprints in various cities in Shaanxi Province during 2005 to 2016
| % | ||||||||||||
| 区域 Area | 小麦 Wheat | 水稻 Rice | 玉米 Maize | 大豆 Soybean | 棉花 Cotton | 油菜 Rape | 花生 Peanut | 麻类 Hemp | 烟草 Tobacco | 蔬菜 Vegetable | 茶树 Tea | 水果 Fruit |
| 西安Xi’an | 15.47 | 20.28 | 33.88 | 33.92 | 28.61 | 20.98 | 24.06 | — | — | 47.68 | — | 52.24 |
| 铜川Tongchuan | 14.58 | 28.09 | 37.31 | 36.26 | — | 21.09 | — | — | — | 44.08 | — | 76.94 |
| 渭南Weinan | 17.70 | 28.11 | 42.17 | 48.29 | 39.46 | 24.30 | 27.23 | 61.87 | 100.00 | 53.93 | — | 61.39 |
| 宝鸡Baoji | 21.81 | — | 43.98 | 48.52 | 42.70 | 29.01 | 30.82 | — | 89.10 | 45.30 | — | 70.80 |
| 咸阳Xianyang | 16.09 | — | 35.60 | 36.74 | 29.12 | 21.48 | 26.32 | 47.04 | 62.86 | 43.02 | — | 64.02 |
| 延安Yan’an | 13.68 | 22.95 | 27.26 | 38.56 | 29.03 | 18.25 | 20.84 | 50.90 | 82.17 | 36.41 | — | 66.17 |
| 榆林Yulin | 10.80 | 19.05 | 22.10 | 31.43 | 23.35 | 15.94 | 15.22 | 36.04 | 45.93 | 26.21 | — | 42.93 |
| 安康Ankang | 35.78 | 43.45 | 62.11 | 52.80 | 44.40 | 40.42 | 59.77 | 84.13 | 100.00 | 65.03 | 57.63 | 44.99 |
| 汉中Hanzhong | 26.58 | 37.60 | 68.34 | 68.52 | 59.83 | 40.75 | 59.29 | 80.43 | 100.00 | 63.86 | 65.11 | 49.81 |
| 商洛Shangluo | 22.88 | 27.18 | 60.63 | 51.91 | 44.00 | 24.38 | 40.22 | 73.42 | 73.56 | 55.62 | 61.30 | 64.74 |
| “—”表示研究期内作物种植较少, 统计时不做考虑。“—” means that the crop area is too little not to be calculated. | ||||||||||||
下载: 导出CSV表42005—2016年陕西省各地级市各种作物年平均灰水足迹总量
Table4.Annual average gray water footprint of different crops in various areas of Shaanxi Province during 2005 to 2016 ×108 m3·a-1
| 区域 Area | 小麦 Wheat | 水稻 Rice | 玉米 Maize | 大豆 Soybean | 棉花 Cotton | 油菜 Rape | 花生 Peanut | 麻类 Hemp | 烟草 Tobacco | 蔬菜 Vegetable | 茶树 Tea | 水果 Fruit |
| 陕西Shannxi | 21.11 | 1.85 | 26.19 | 1.94 | 1.25 | 2.74 | 0.40 | 0.01 | 0.37 | 16.30 | 2.76 | 47.15 |
| 西安Xi’an | 3.86 | 0.02 | 4.15 | 0.08 | 0.06 | 0.06 | 0.00 | 0.00 | 0.00 | 2.18 | 0.00 | 2.10 |
| 铜川Tongchuan | 0.51 | 0.00 | 0.62 | 0.05 | 0.00 | 0.09 | 0.00 | 0.00 | 0.01 | 0.17 | 0.00 | 2.25 |
| 渭南Weinan | 5.46 | 0.00 | 4.54 | 0.13 | 1.16 | 0.26 | 0.13 | 0.00 | 0.01 | 1.94 | 0.00 | 6.66 |
| 宝鸡Baoji | 3.69 | 0.01 | 3.01 | 0.11 | 0.00 | 0.16 | 0.00 | 0.00 | 0.05 | 1.61 | 0.00 | 2.60 |
| 咸阳Xianyang | 4.17 | 0.00 | 3.89 | 0.06 | 0.01 | 0.34 | 0.00 | 0.00 | 0.03 | 2.96 | 0.00 | 11.25 |
| 延安Yan’an | 0.12 | 0.01 | 1.65 | 0.26 | 0.02 | 0.04 | 0.02 | 0.00 | 0.03 | 0.70 | 0.00 | 11.63 |
| 榆林Yulin | 0.07 | 0.04 | 3.08 | 0.67 | 0.00 | 0.00 | 0.07 | 0.00 | 0.00 | 0.70 | 0.00 | 7.80 |
| 安康Ankang | 1.12 | 0.47 | 1.89 | 0.14 | 0.00 | 0.65 | 0.07 | 0.00 | 0.12 | 1.97 | 0.86 | 1.18 |
| 汉中Hanzhong | 0.84 | 1.28 | 1.61 | 0.16 | 0.00 | 1.08 | 0.05 | 0.00 | 0.04 | 1.77 | 1.44 | 1.49 |
| 商洛Shangluo | 1.28 | 0.01 | 1.74 | 0.28 | 0.00 | 0.06 | 0.06 | 0.00 | 0.08 | 0.64 | 0.45 | 0.18 |
下载: 导出CSV表52005—2016年陕西省水资源利用与种植业生产总值脱钩状态
Table5.Decoupling of water resources utilization and crop production in Shaanxi Province during 2005 to 2016
| 年份 Year | 种植业 总产值 TPO (×108 ) | 水足迹 WF (×108 m3) | 灰水足迹 WFgrey (×108 m3) | Δ总产值 ΔTPO (%) | Δ水足迹 ΔWF (%) | 水足迹脱钩指数 DE(WF, TPO) | 脱钩状态 Decoupling state | Δ灰水足迹 ΔWFgrey (%) | 水环境 脱钩指数DE(WFgrey, TPO) | 脱钩状态 Decoupling state |
| 2005 | 472.90 | 496.71 | 108.04 | 10.68 | 3.14 | 0.29 | 弱Weak | 2.64 | 0.25 | 强Strong |
| 2006 | 523.42 | 512.31 | 110.89 | 20.24 | -6.17 | -0.30 | 强Strong | -2.13 | -0.11 | 强Strong |
| 2007 | 629.34 | 480.71 | 108.53 | 23.28 | 3.55 | 0.15 | 弱Weak | 4.89 | 0.21 | 弱Weak |
| 2008 | 775.85 | 497.77 | 113.84 | 6.15 | -1.57 | -0.25 | 强Strong | 5.28 | 0.86 | 扩张性耦合Expansion coupling |
| 2009 | 823.60 | 489.98 | 119.85 | 34.44 | 5.12 | 0.15 | 弱Weak | 11.25 | 0.33 | 弱Weak |
| 2010 | 1 107.24 | 515.07 | 133.33 | 22.89 | -6.15 | -0.27 | 强Strong | -7.55 | -0.33 | 强Strong |
| 2011 | 1 360.66 | 483.38 | 123.27 | 12.17 | 4.29 | 0.35 | 弱Weak | 1.56 | 0.13 | 弱Weak |
| 2012 | 1 526.28 | 504.10 | 125.20 | 12.35 | 7.92 | 0.64 | 弱Weak | 2.55 | 0.21 | 弱Weak |
| 2013 | 1 714.79 | 544.00 | 128.39 | 9.10 | -4.14 | -0.46 | 强Strong | 1.00 | 0.11 | 弱Weak |
| 2014 | 1 870.78 | 521.48 | 129.68 | 2.13 | 1.10 | 0.52 | 弱Weak | 1.12 | 0.53 | 弱Weak |
| 2015 | 1 910.71 | 527.22 | 131.13 | 6.12 | 3.26 | 0.53 | 强Strong | 1.16 | 0.19 | 强Strong |
| 2016 | 2 027.56 | 544.43 | 132.66 | — | — | — | — | — | — | — |
| TPO: total planting output value; WF: water footprint; WFgrey: grey water footprint; ΔTPO: change rate of TPO; ΔWF: change rate of WF; DE(WF, TPO): decoupling index of WF; ΔWFgrey: change rate of WFgrey; DE(WFgrey, TPO): decoupling index of water environment. | ||||||||||
下载: 导出CSV表6不同****对陕西区域小麦水足迹研究比较
Table6.Comparison of different scholars' researches on wheat water footprint in Shaanxi region
| 作者 Author | 研究区域 Study area | 研究期 Study period | 作物水足迹组成 Water footprint composition | 水足迹 Water footprint (m3·kg-1) | 参考文献 Reference |
| 张炜等 Zhang Wei, et al. | 陕西省 Shaanxi Province | 2005—2016 | 绿水、蓝水(灰水) Green water, blue water (grey water) | 2.75 (3.21) | — |
| 史利洁等 Shi Lijie, et al. | 陕西省 Shaanxi Province | 2000—2012 | 绿水、蓝水Green water, blue water | 1.29 | [9] |
| 刘帝等 Liu Di, et al. | 陕西省关中地区 Guanzhong Region, Shaanxi Province | 1998, 2005, 2010 | 绿水、蓝水Green water, blue water | 0.96 | [31] |
| 冯东溥等 Feng Dongpu, et al. | 陕西省宝鸡峡灌区 Baoji Gorge Irrigation District, Shaanxi Province | 1994—2010 | 绿水、蓝水(灰水) Green water, blue water (grey water) | 0.68 (1.04) | [32] |
| 括号内数据为包含灰水足迹下的作物水足迹。Values in brackets are water footprint containing grey water footprint. | |||||
下载: 导出CSV参考文献
| [1] | FALKENMARK M. Freshwater as shared between society and ecosystems:From divided approaches to integrated challenges[J]. Philosophical Transactions of the Royal Society B:Biological Sciences, 2003, 358(1440):2037-2049 doi: 10.1098/rstb.2003.1386 |
| [2] | ROCKSTR?M J. Green water security for the food makers of tomorrow:Windows of opportunity in drought-prone savannahs[J]. Water Science & Technology, 2001, 43(4):71-78 http://europepmc.org/abstract/MED/11379229 |
| [3] | 黄万霞, 闫滨, 姬建梅.关于国内外灰水足迹的研究综述[J].环境工程, 2017, 35(12):149-153 http://d.old.wanfangdata.com.cn/Periodical/hjgc201712030 HUANG W X, YAN B, JI J M. A review of researches on the gray water footprint[J]. Environmental Engineering, 2017, 35(12):149-153 http://d.old.wanfangdata.com.cn/Periodical/hjgc201712030 |
| [4] | HOEKSTRA A Y, CHAPAGAIN A K, ALDAYA M M, et al. The Water Footprint Assessment Manual:Setting the Global Standard[M]. London:Earthscan, 2011 |
| [5] | 王艳阳, 王会肖, 蔡燕.北京市水足迹计算与分析[J].中国生态农业学报, 2011, 19(4):954-960 http://www.ecoagri.ac.cn/zgstny/ch/reader/view_abstract.aspx?file_no=20110439&flag=1 WANG Y Y, WANG H X, CAI Y. Calculation and analysis of water footprint in Beijing City[J]. Chinese Journal of Eco-Agriculture, 2011, 19(4):954-960 http://www.ecoagri.ac.cn/zgstny/ch/reader/view_abstract.aspx?file_no=20110439&flag=1 |
| [6] | 苏芮, 陈亚宁, 张燕, 等.新疆城乡居民虚拟水消费结构及其用水效率评价[J].中国生态农业学报, 2011, 19(1):181-186 http://www.ecoagri.ac.cn/zgstny/ch/reader/view_abstract.aspx?file_no=20110132&flag=1 SU R, CHEN Y N, ZHANG Y, et al. Estimation of virtual water consumption structure and water efficiency in cities and rural areas of Xinjiang[J]. Chinese Journal of Eco-Agriculture, 2011, 19(1):181-186 http://www.ecoagri.ac.cn/zgstny/ch/reader/view_abstract.aspx?file_no=20110132&flag=1 |
| [7] | 虞祎, 张晖, 胡浩.农业生产与水资源承载力评价[J].中国生态农业学报, 2016, 24(7):978-986 http://www.ecoagri.ac.cn/zgstny/ch/reader/view_abstract.aspx?file_no=2016715&flag=1 YU Y, ZHANG H, HU H. Agricultural production and evaluation in terms of water resources carrying capacity[J]. Chinese Journal of Eco-Agriculture, 2016, 24(7):978-986 http://www.ecoagri.ac.cn/zgstny/ch/reader/view_abstract.aspx?file_no=2016715&flag=1 |
| [8] | 田园宏, 诸大建, 王欢明, 等.中国主要粮食作物的水足迹值:1978-2010[J].中国人口·资源与环境, 2013, 23(6):122-128 doi: 10.3969/j.issn.1002-2104.2013.06.018 TIAN Y H, ZHU D J, WANG H M, et al. Water footprint calculation of China's main food crops:1978-2010[J]. China Population, Resources and Environment, 2013, 23(6):122-128 doi: 10.3969/j.issn.1002-2104.2013.06.018 |
| [9] | 史利洁, 吴普特, 王玉宝, 等.基于作物生产水足迹的陕西省水资源压力评价[J].中国生态农业学报, 2015, 23(5):650-658 http://www.ecoagri.ac.cn/zgstny/ch/reader/view_abstract.aspx?file_no=2015516&flag=1 SHI L J, WU P T, WANG Y B, et al. Assessment of water stress in Shaanxi Province based on crop water footprint[J]. Chinese Journal of Eco-Agriculture, 2015, 23(5):650-658 http://www.ecoagri.ac.cn/zgstny/ch/reader/view_abstract.aspx?file_no=2015516&flag=1 |
| [10] | 刘莉, 邓欧平, 邓良基, 等. 2003~2011年四川省各市(州)农业水足迹时空变化与驱动力研究[J].长江流域资源与环境, 2015, 24(7):1133-1141 doi: 10.11870/cjlyzyyhj201507008 LIU L, DENG O P, DENG L J, et al. Agricultural water footprint space-time change and driving factors research of various cities in Sichuan Province from 2003 to 2011[J]. Resources and Environment in the Yangtze Basin, 2015, 24(7):1133-1141 doi: 10.11870/cjlyzyyhj201507008 |
| [11] | 王旭, 高翔, 曹蕾, 等.水足迹视角下的宁夏中卫市农业水资源利用评价[J].兰州大学学报:自然科学版, 2015, 51(5):619-624 http://d.old.wanfangdata.com.cn/Periodical/lzdxxb201505005 WANG X, GAO X, CAO L, et al. Evaluation of agricultural water resource utilization from the water footprint perspective in Zhongwei City, Ningxia Hui Autonomous Region[J]. Journal of Lanzhou University:Natural Sciences, 2015, 51(5):619-624 http://d.old.wanfangdata.com.cn/Periodical/lzdxxb201505005 |
| [12] | 李宁, 张建清, 王磊.基于水足迹法的长江中游城市群水资源利用与经济协调发展脱钩分析[J].中国人口·资源与环境, 2017, 27(11):202-208 http://d.old.wanfangdata.com.cn/Periodical/zgrkzyyhj201711022 LI N, ZHANG J Q, WANG L. Decoupling and water footprint analysis of the coordinated development between water utilization and the economy in urban agglomeration in the middle reaches of the Yangtze River[J]. China Population, Resources and Environment, 2017, 27(11):202-208 http://d.old.wanfangdata.com.cn/Periodical/zgrkzyyhj201711022 |
| [13] | GROLL M, OPP C, KULMATOV R, et al. Water quality, potential conflicts and solutions-an upstream-downstream analysis of the transnational Zarafshan River (Tajikistan, Uzbekistan)[J]. Environmental Earth Sciences, 2015, 73(2):743-763 doi: 10.1007/s12665-013-2988-5 |
| [14] | PERRY C. Water footprints:Path to enlightenment, or false trail?[J]. Agricultural Water Management, 2014, 134:119-125 doi: 10.1016/j.agwat.2013.12.004 |
| [15] | 孙世坤, 王玉宝, 刘静, 等.中国主要粮食作物的生产水足迹量化及评价[J].水利学报, 2016, 47(9):1115-1124 http://d.old.wanfangdata.com.cn/Periodical/slxb201609003 SUN S K, WANG Y B, LIU J, et al. Quantification and evaluation of water footprint of major grain crops in China[J]. Journal of Hydraulic Engineering, 2016, 47(9):1115-1124 http://d.old.wanfangdata.com.cn/Periodical/slxb201609003 |
| [16] | 吴普特, 孙世坤, 王玉宝, 等.作物生产水足迹量化方法与评价研究[J].水利学报, 2017, 48(6):651-660 http://d.old.wanfangdata.com.cn/Periodical/slxb201706003 WU P T, SUN S K, WANG Y B, et al. Research on the quantification methods for water footprint of crop production[J]. Journal of Hydraulic Engineering, 2017, 48(6):651-660 http://d.old.wanfangdata.com.cn/Periodical/slxb201706003 |
| [17] | 郭元裕.农田水利学[M].第3版.北京:中国水利水电出版社, 1997 GUO Y Y. Irrigation and Drainage Engineering[M]. 3rd ed. Beijing:China Water Resources and Hydropower Press, 1997 |
| [18] | 付永虎, 刘黎明, 起晓星, 等.基于灰水足迹的洞庭湖区粮食生产环境效应评价[J].农业工程学报, 2015, 31(10):152-160 doi: 10.11975/j.issn.1002-6819.2015.10.020 FU Y H, LIU L M, QI X X, et al. Environmental effects evaluation for grain production based on grey water footprint in Dongting Lake area[J]. Transactions of the CSAE, 2015, 31(10):152-160 doi: 10.11975/j.issn.1002-6819.2015.10.020 |
| [19] | 高凡, 李玉中, 郭家选, 等.农产品水足迹评价研究进展[J].中国生态农业学报, 2017, 25(7):1071-1080 http://www.ecoagri.ac.cn/zgstny/ch/reader/view_abstract.aspx?file_no=20170715&flag=1 GAO F, LI Y Z, GUO J X, et al. A review of water footprint assessment for agricultural products[J]. Chinese Journal of Eco-Agriculture, 2017, 25(7):1071-1080 http://www.ecoagri.ac.cn/zgstny/ch/reader/view_abstract.aspx?file_no=20170715&flag=1 |
| [20] | CHAPAGAIN A K, HOEKSTRA A Y. The blue, green and grey water footprint of rice from production and consumption perspectives[J]. Ecological Economics, 2011, 70(4):749-758 doi: 10.1016/j.ecolecon.2010.11.012 |
| [21] | 王小英, 陈占飞, 胡凡, 等.陕西省农田化肥投入过量与不足的研究[J].干旱地区农业研究, 2017, 35(6):159-165 http://d.old.wanfangdata.com.cn/Periodical/ghdqnyyj201706024 WANG X Y, CHEN Z F, HU F, et al. Study on the excessive and insufficient of chemical fertilizer inputs on farmland in Shaanxi Province[J]. Agricultural Research in the Arid Areas, 2017, 35(6):159-165 http://d.old.wanfangdata.com.cn/Periodical/ghdqnyyj201706024 |
| [22] | 赵佐平, 闫莎, 刘芬, 等.陕西果园主要分布区氮素投入特点及氮负荷风险分析[J].生态学报, 2014, 34(19):5642-5649 http://d.old.wanfangdata.com.cn/Periodical/stxb201419033 ZHAO Z P, YAN S, LIU F, et al. Analysis of nitrogen inputs and soil nitrogen loading in different kinds of orchards in Shaanxi Province[J]. Acta Ecologica Sinica, 2014, 34(19):5642-5649 http://d.old.wanfangdata.com.cn/Periodical/stxb201419033 |
| [23] | 刘侯俊, 巨晓棠, 同延安, 等.陕西省主要果树的施肥现状及存在问题[J].干旱地区农业研究, 2002, 20(1):38-44 doi: 10.3321/j.issn:1000-7601.2002.01.009 LIU H J, JU X T, TONG Y A, et al. The status and problems of fertilization of main fruit trees in Shaanxi Province[J]. Agricultural Research in the Arid Areas, 2002, 20(1):38-44 doi: 10.3321/j.issn:1000-7601.2002.01.009 |
| [24] | 杨帆, 孟远夺, 姜义, 等. 2013年我国种植业化肥施用状况分析[J].植物营养与肥料学报, 2015, 21(1):217-225 http://d.old.wanfangdata.com.cn/Periodical/zwyyyflxb201501024 YANG F, MENG Y D, JIANG Y, et al. Chemical fertilizer application and supply in crop farming in China in 2013[J]. Journal of Plant Nutrition and Fertilizer, 2015, 21(1):217-225 http://d.old.wanfangdata.com.cn/Periodical/zwyyyflxb201501024 |
| [25] | 马立锋, 苏孔武, 黎金兰, 等.控释氮肥对茶叶产量、品质和氮素利用效率及经济效益的影响[J].茶叶科学, 2015, 35(4):354-362 doi: 10.3969/j.issn.1000-369X.2015.04.011 MA L F, SU K W, LI J L, et al. Effects of controlled-release nitrogen fertilizer on tea yield, quality, nitrogen use efficiency and economic benefit[J]. Journal of Tea Science, 2015, 35(4):354-362 doi: 10.3969/j.issn.1000-369X.2015.04.011 |
| [26] | 邱强, 方鑫, 左翔.城市化对碳排放非线性脱钩效应的研究——基于Tapio脱钩模型的估计[J].现代经济探讨, 2017, (5):76-82 doi: 10.3969/j.issn.1009-2382.2017.05.014 QIU Q, FANG X, ZUO X. Study on the nonlinear decoupling effect of urbanization on carbon emission-Based on the estimation of Tapio decoupling model[J]. Modern Economic Research, 2017, (5):76-82 doi: 10.3969/j.issn.1009-2382.2017.05.014 |
| [27] | 杨振华, 苏维词, 赵卫权.岩溶地区水资源与经济发展脱钩分析[J].经济地理, 2016, 36(10):159-165 http://d.old.wanfangdata.com.cn/Periodical/gzkx201605008 YANG Z H, SU W C, ZHAO W Q. Decoupling analysis of urban water resources and economic development based on water ecological footprint[J]. Economic Geography, 2016, 36(10):159-165 http://d.old.wanfangdata.com.cn/Periodical/gzkx201605008 |
| [28] | 周银香.交通碳排放与行业经济增长脱钩及耦合关系研究——基于Tapio脱钩模型和协整理论[J].经济问题探索, 2016, (6):41-48 http://www.wanfangdata.com.cn/details/detail.do?_type=perio&id=QKC20162016070100049651 ZHOU Y X. Study on the decoupling and coupling relationship between transportation carbon emissions and industry economic growth-Based on Tapio decoupling model and cointegration theory[J]. Inquiry into Economic Issues, 2016, (6):41-48 http://www.wanfangdata.com.cn/details/detail.do?_type=perio&id=QKC20162016070100049651 |
| [29] | TAPIO P. Towards a theory of decoupling:Degrees of decoupling in the EU and the case of road traffic in Finland between 1970 and 2001[J]. Transport Policy, 2005, 12(2):137-151 http://www.sciencedirect.com/science/article/pii/S0967070X05000028 |
| [30] | 刘聪.中国粮食生产的水资源利用特征评价[J].华中农业大学学报:社会科学版, 2017, (4):22-29 http://d.old.wanfangdata.com.cn/Periodical/hznydxxb-shkxb201704005 LIU C. Evaluation on utilization of water resources of food production in China[J]. Journal of Huazhong Agricultural University:Social Sciences Edition, 2017, (4):22-29 http://d.old.wanfangdata.com.cn/Periodical/hznydxxb-shkxb201704005 |
| [31] | 冯东溥, 魏晓妹, 降亚楠.宝鸡峡灌区小麦水足迹时空变化特征与归因分析[J].农业机械学报, 2017, 48(12):269-277 doi: 10.6041/j.issn.1000-1298.2017.12.032 FENG D P, WEI X M, JIANG Y N. Temporal and spatial variation characteristics and attribution analysis of wheat water footprint in Baojixia Irrigation Area, China[J]. Transactions of the Chinese Society of Agricultural Machinery, 2017, 48(12):269-277 doi: 10.6041/j.issn.1000-1298.2017.12.032 |
| [32] | 刘帝, 操信春, 王玉宝.基于田间实际耗水的作物生产水足迹[J].排灌机械工程学报, 2014, 32(8):719-724 http://d.old.wanfangdata.com.cn/Periodical/pgjx201408013 LIU D, CAO X C, WANG Y B. Water footprint of grain production based on crop water consumption[J]. Journal of Drainage and Irrigation Machinery Engineering, 2014, 32(8):719-724 http://d.old.wanfangdata.com.cn/Periodical/pgjx201408013 |
