潘洪义,,
黄佩
四川师范大学西南土地资源评价与监测教育部重点实验室/四川师范大学地理与资源科学学院 成都 610068
基金项目: 国家自然科学基金项目41371125
四川省教育厅项目16ZB0061
四川省哲学社会科学规划项目SC18B095
教育部规划基金项目18XJA630005
详细信息
作者简介:徐婕, 主要从事土地利用与生态补偿研究。E-mail:xxujie@foxmail.com
通讯作者:潘洪义, 主要从事土地利用与评价研究。E-mail:panhongyi80@163.com
中图分类号:F301.24计量
文章访问数:836
HTML全文浏览量:5
PDF下载量:609
被引次数:0
出版历程
收稿日期:2018-05-22
录用日期:2018-08-14
刊出日期:2019-01-01
Carbon emission and ecological compensation of main functional areas in Sichuan Province based on LUCC
XU Jie,PAN Hongyi,,
HUANG Pei
Key Laboratory of Land Resources Evaluation and Monitoring in Southwest, Sichuan Normal University/College of Geography and Resources Science, Sichuan Normal University, Chengdu 610068, China
Funds: the National Natural Science Foundation of China41371125
the Project of Department of Education of Sichuan Province16ZB0061
Sichuan Philosophy and Social Science Planning ProjectSC18B095
the Planning Fund Project of Ministry of Education of China18XJA630005
More Information
Corresponding author:PAN Hongyi, E-mail:panhongyi80@163.com
摘要
HTML全文
图
参考文献
相关文章
施引文献
资源附件
访问统计
摘要
摘要:土地利用/土地覆被变化(LUCC)影响下的碳排放充分体现人类活动对生态环境的扰动程度,由此切入的碳收支与补偿研究对区域低碳经济与平衡发展具有重要意义。本文以2005年和2015年四川省土地利用数据为基础,参考IPCC假定构建碳排放模型,借助GIS平台运用数学模型对四川省5个主体功能区碳排放及碳补偿率进行测度与分析,采用造林成本法和碳税率法对生态补偿标准进行测算。结果表明:1)研究期内四川省各主体功能区土地利用与主体功能区规划相符并按其功能定位优化发展。重点开发区域耕地占绝对优势,建设用地面积的总量和增量最大;重点生态功能区林地、草地占比最大。2)研究期内各主体功能区的总碳排放量大幅度增加。重点开发区域碳源量、总碳排放量及其增量均居首位;重点生态功能区碳吸收的能力减弱。3)各主体功能区建设用地碳排放强度远大于总碳排放强度,研究期内各主体功能区总碳排放强度均增加,建设用地碳排放强度则有增有减。国家层面重点开发区域总碳排放强度最大,建设用地碳排放强度很小。4)生态发展区碳补偿率高,经济发达区低。国家层面限制开发区域(重点生态功能区)碳吸收补偿系数最高。5)碳源区应对作为碳汇区的甘孜藏族自治州按固碳价格进行生态补偿。碳排放量与各主体功能区功能定位高度相关,生态补偿标准大致从成都平原向四周递减,限制开发区域生态补偿标准偏低。基于碳排放的生态补偿标准建立横向财政转移支付政策,有利于四川省节能减排和平衡发展。
关键词:土地利用/土地覆被变化/
主体功能区/
碳排放/
碳源区/
碳汇区/
碳补偿率/
生态补偿
Abstract:Carbon emissions under land use/cover change (LUCC) reflect the disturbance degree of environment by human activities. Therefore, carbon budget and compensation research was of great significance to regional low-carbon economy and balanced development. Based on land use data for Sichuan Province in 2005 and 2015, this paper built a new local land use classification system and carbon emission model to quantitatively analyze carbon emission and carbon offset rate of land use in 183 counties in Sichuan Province. Taking into account regional differences at county level and breaking traditional administrative regional boundaries, the study based on the five main functional areas of Sichuan Province to measure ecological compensation standards with afforestation cost and carbon tax rate methods. The results showed that:1) during the study period, land use in each main functional area in Sichuan Province was consistent with the main functional area planning and was optimized according to the functional orientation. Cultivated lands in the key development area had absolute advantage, while the total amount and increase in construction land area was the largest. Otherwise, cultivated land holding capacity in the main agricultural production area remained the strongest. Woodland and grassland accounted for 70%-80% in the key ecological function areas. 2) During the study period, total carbon emission in each main functional area increased significantly, and the construction land was the main carbon source, and forest land was the main carbon sink. Total carbon emissions and increments in the key development area ranked first, with carbon sinks in the key ecological functional area accounting for 63% of Sichuan Province, although the ability to absorb carbon gradually weakened. 3) Carbon emission intensity of construction land of each main functional area was much greater than total carbon emission intensity. Total carbon emission intensity of each main functional area increased during the investigated period, but carbon emission intensity of construction land showed increased or decreased. Total carbon emission intensity of the key development area at national level was largest, while that of construction land was smallest. 4) The rate of carbon compensation in the ecological development areas was high, with economic development area having the reverse trend. The compensation coefficient of carbon absorption was highest for the restricted development area at national level (key ecological function area). 5) Carbon source area provided ecological compensation for carbon sink area based on the scope of ecological compensation. Ecological compensation standard for Ganzi Tibetan Autonomous Prefecture, which was a carbon sink area, was 5.82 billion to 20.56 billion Yuan. It indicated that carbon emission was correlated with functional location of each functional area. Ecological compensation standard generally decreased from Chengdu Plain to the surrounding areas, and ecological compensation standard of the restricted development areas were relatively low. On the basis of the ecological compensation standard for carbon emissions, a horizontal fiscal transfer payment policy was established as reference basis for energy conservation, emission reduction and balanced development of Sichuan Province.
Key words:Land use/cover change/
Main functional area/
Carbon emission/
Carbon sources area/
Carbon sink area/
Carbon offset rate/
Ecological compensation
HTML全文
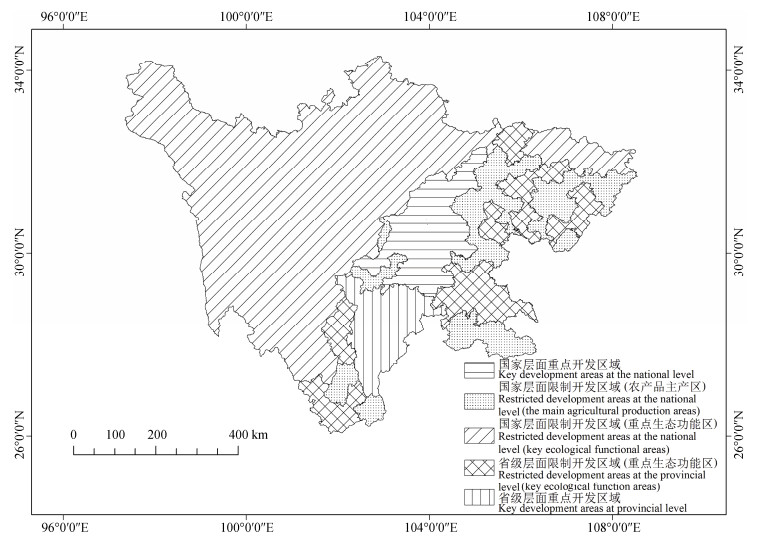
图1四川省主体功能分区
Figure1.The main functional division of Sichuan Province
 下载: 全尺寸图片幻灯片
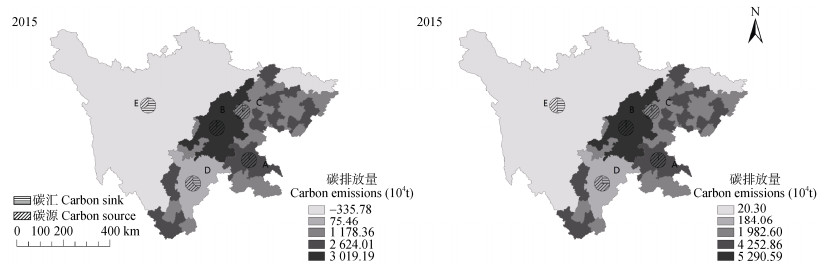
图22005年和2015年四川省主体功能区碳排放格局
A为省级层面重点开发区域; B为国家层面重点开发区域; C为国家层面限制开发区域(农产品主产区); D为省级层面限制开发区域(重点生态功能区); E为国家层面限制开发区域(重点生态功能区)。
Figure2.Carbon emission distribution of main functional areas in Sichuan Province in 2005 and 2015
A: key development areas at provincial level; B: key development areas at the national level; C: restricted development areas at the national level (the main agricultural production areas); D: restricted development areas at the provincial level (key ecological function areas); E: restricted development areas at the national level (key ecological functional areas).
下载: 全尺寸图片幻灯片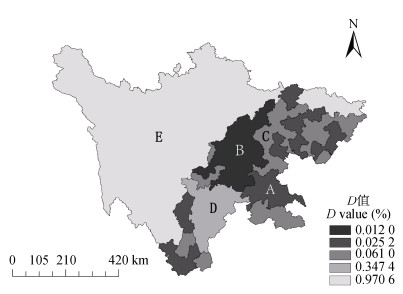
图32015年四川省主体功能区碳吸收补偿系数(D)
A为省级层面重点开发区域; B为国家层面重点开发区域; C为国家层面限制开发区域(农产品主产区); D为省级层面限制开发区域(重点生态功能区); E为国家层面限制开发区域(重点生态功能区)。
Figure3.Spatial distribution of compensation coefficient of carbon absorption (D) in main functional areas of Sichuan Province in 2015
A: key development areas at provincial level; B: key development areas at the national level; C: restricted development areas at the national level (the main agricultural production areas); D: restricted development areas at the provincial level (key ecological function areas); E: restricted development areas at the national level (key ecological functional areas).
下载: 全尺寸图片幻灯片表1四川省土地分类系统
Table1.Land classification system of Sichuan Province
| 一级类 First class | 二级类 Secondary class |
| 耕地 Cultivated land | 旱地、水田 Dry land, paddy field |
| 林地 Forest land | 有林地、灌木林地、疏林地、其他林地 Forest land, shrubbery land, sparse woodland, other woodland |
| 草地 Grassland | 高覆盖度草地、中覆盖度草地、低覆盖度草地 High, medium and low coverage grassland |
| 水域 Water | 河渠、湖泊、水库坑塘、永久性冰川雪地、滩地 Rivers, lakes, reservoirs, pits, permanent glacier snow, beaches |
| 建设用地 Built-up land | 城镇用地、农村居民点、其他建设用地 Urban land, rural residential areas, other construction land |
| 未利用地 Unused land | 沙地、盐碱地、沼泽地、裸土地、裸岩石砾地 Sand, saline-alkali land, marshland, bare land, bare rocky gravel |
下载: 导出CSV表2不同土地利用及化石燃料的碳源(汇)碳排放(吸收)系数
Table2.Carbon source (sink) carbon emission (absorption) coefficients of different land use types and fossil fuels
| 项目 Item | 参数值 Parameter value | 单位 Unit | 数据来源 Data sources |
| 林地碳汇Woodland carbon sink | -0.612 5 | kg(C)·m-2·a-1 | [22-23] |
| 草地碳汇Grassland carbon sink | -0.020 5 | kg(C)·m-2·a-1 | [22-23] |
| 耕地碳源Cultivated land carbon source | 0.459 5 | kg(C)·m-2·a-1 | [22-24] |
| 未利用地碳汇Unused carbon sink | -0.000 5 | kg(C)·m-2·a-1 | [25-26] |
| 水域碳汇Water carbon sequestration | -0.025 3 | kg(C)·m-2·a-1 | [27] |
| 煤炭碳源Coal carbon source | 0.740 2 | t(C)·t-1 | [28-29] |
| 石油碳源Petroleum carbon source | 0.570 0 | t(C)·t-1 | [28-29] |
| 天然气碳源Natural gas carbon source | 0.433 1 | t(C)·t-1 | [28-29] |
下载: 导出CSV表32005年和2015年四川省主体功能区土地利用
Table3.Land use types in main function areas of Sichuan Province in 2005 and 2015
| 主体功能区 Main function area | 年份 Year | 耕地 Cultivated land | 林地 Forest land | 草地 Grassland | 水域 Water | 建设用地 Built-up land | 未利用地 Unused land | |||||||||||
| 面积Area (km2) | 比例Proportion (%) | 面积Area (km2) | 比例Proportion (%) | 面积Area (km2) | 比例Proportion (%) | 面积Area (km2) | 比例Proportion (%) | 面积Area (km2) | 比例Proportion (%) | 面积Area (km2) | 比例Proportion (%) | |||||||
| A | 2005 | 36 374.06 | 58.77 | 17 962.41 | 29.02 | 5 598.89 | 9.05 | 1 155.81 | 1.87 | 744.57 | 1.20 | 59.01 | 0.10 | |||||
| 2015 | 36 078.31 | 58.29 | 17 752.84 | 28.68 | 5 408.25 | 8.74 | 1 205.70 | 1.95 | 1 390.59 | 2.25 | 59.06 | 0.10 | ||||||
| B | 2005 | 26 509.03 | 62.39 | 10 572.68 | 24.88 | 2 404.27 | 5.66 | 690.17 | 1.62 | 2 295.68 | 5.40 | 18.99 | 0.04 | |||||
| 2015 | 25 587.95 | 60.22 | 10 420.10 | 24.52 | 2 338.98 | 5.50 | 744.44 | 1.75 | 3 289.66 | 7.74 | 109.67 | 0.26 | ||||||
| C | 2005 | 38 050.42 | 58.93 | 20 453.73 | 31.68 | 5 087.24 | 7.88 | 645.12 | 1.00 | 309.29 | 0.48 | 27.91 | 0.04 | |||||
| 2015 | 37 599.34 | 58.23 | 20 838.34 | 32.27 | 4 700.84 | 7.28 | 809.96 | 1.25 | 603.63 | 0.93 | 21.61 | 0.03 | ||||||
| D | 2005 | 7 107.84 | 22.37 | 15 385.29 | 48.42 | 9 064.49 | 28.53 | 101.41 | 0.32 | 44.75 | 0.14 | 70.36 | 0.22 | |||||
| 2015 | 6 971.09 | 21.94 | 15 693.24 | 49.39 | 8 763.82 | 27.58 | 199.38 | 0.63 | 76.96 | 0.24 | 69.65 | 0.22 | ||||||
| E | 2005 | 13 094.59 | 4.57 | 101 158.01 | 35.29 | 153 625.23 | 53.60 | 1 256.58 | 0.44 | 219.58 | 0.08 | 17 267.33 | 6.02 | |||||
| 2015 | 13 057.29 | 4.56 | 104 216.29 | 36.36 | 150 033.17 | 52.35 | 1 693.40 | 0.59 | 419.46 | 0.15 | 17 201.61 | 6.00 | ||||||
| A为省级层面重点开发区域; B为国家层面重点开发区域; C为国家层面限制开发区域(农产品主产区); D为省级层面限制开发区域(重点生态功能区); E为国家层面限制开发区域(重点生态功能区)。A: key development areas at provincial level; B: key development areas at the national level; C: restricted development areas at the national level (the main agricultural production areas); D: restricted development areas at the provincial level (key ecological function areas); E: restricted development areas at the national level (key ecological functional areas). | ||||||||||||||||||
下载: 导出CSV表42005年和2015年四川省主体功能区的土地利用碳排放
Table4.Land use carbon emissions in main functional areas of Sichuan Province in 2005 and 2015
| ×104 t | ||||||||||
| 主体功能区 Main function area | 年份 Year | 耕地 Cultivated land | 林地 Forest land | 草地 Grassland | 水域 Water | 建设用地 Built-up land | 未利用地 Unused land | 碳汇 Carbon sink | 碳源 Carbon source | 碳排放 Carbone mission |
| A | 2005 | 167.138 8 | -110.019 8 | -1.147 8 | -0.292 4 | 2 568.331 0 | -0.000 3 | -111.460 3 | 2 735.469 7 | 2 624.009 5 |
| 2015 | 165.779 8 | -108.736 2 | -1.108 7 | -0.305 0 | 4 197.231 4 | -0.000 3 | -110.150 2 | 4 363.011 3 | 4 252.861 1 | |
| B | 2005 | 121.809 0 | -64.757 7 | -0.492 9 | -0.174 6 | 2 962.805 9 | -0.000 1 | -65.425 2 | 3 084.614 9 | 3 019.189 6 |
| 2015 | 117.576 6 | -63.823 1 | -0.479 5 | -0.188 3 | 5 237.508 6 | -0.000 5 | -64.491 5 | 5 355.085 2 | 5 290.593 7 | |
| C | 2005 | 174.841 7 | -125.279 1 | -1.042 9 | -0.163 2 | 1 130.000 7 | -0.000 1 | -126.485 3 | 1 304.842 4 | 1 178.357 1 |
| 2015 | 172.769 0 | -127.634 8 | -0.963 7 | -0.204 9 | 1 938.635 8 | -0.000 1 | -128.803 5 | 2 111.404 8 | 1 982.601 3 | |
| D | 2005 | 32.660 5 | -94.234 9 | -1.858 2 | -0.025 7 | 138.919 5 | -0.000 4 | -96.119 1 | 171.580 1 | 75.460 9 |
| 2015 | 32.032 1 | -96.121 1 | -1.796 6 | -0.050 4 | 249.992 6 | -0.000 3 | -97.968 5 | 282.024 7 | 184.056 3 | |
| E | 2005 | 60.169 6 | -619.592 8 | -31.493 2 | -0.317 9 | 255.536 5 | -0.086 3 | -651.490 2 | 315.706 1 | -335.784 1 |
| 2015 | 59.998 2 | -638.324 8 | -30.756 8 | -0.428 4 | 629.894 9 | -0.086 0 | -669.596 0 | 689.893 1 | 20.297 1 | |
| A为省级层面重点开发区域; B为国家层面重点开发区域; C为国家层面限制开发区域(农产品主产区); D为省级层面限制开发区域(重点生态功能区); E为国家层面限制开发区域(重点生态功能区)。A: key development areas at provincial level; B: key development areas at the national level; C: restricted development areas at the national level (the main agricultural production areas); D: restricted development areas at the provincial level (key ecological function areas); E: restricted development areas at the national level (key ecological functional areas). | ||||||||||
下载: 导出CSV表52005年和2015年四川省及其主体功能区碳排放强度
Table5.Carbon emission intensity of Sichuan Province and its main functional areas in 2005 and 2015
| 104 t·km-2 | |||||
| 主体功能区Main function area | 2005 | 2015 | |||
| 总碳排放强度 Total carbon emission intensity | 建设用地碳排放强度 Carbon emission intensity of construction land | 总碳排放强度 Total carbon emission intensity | 建设用地碳排放强度 Carbon emission intensity of construction land | ||
| A | 0.042 4 | 3.449 4 | 0.068 7 | 3.018 3 | |
| B | 0.071 1 | 1.290 6 | 0.124 5 | 1.592 1 | |
| C | 0.018 2 | 3.653 6 | 0.030 7 | 3.211 6 | |
| D | 0.002 4 | 3.104 2 | 0.005 8 | 3.248 2 | |
| E | -0.001 2 | 1.163 8 | 0.000 1 | 1.501 7 | |
| 四川省Sichuan Province | 0.013 5 | 1.952 4 | 0.024 1 | 2.119 8 | |
| A为省级层面重点开发区域; B为国家层面重点开发区域; C为国家层面限制开发区域(农产品主产区); D为省级层面限制开发区域(重点生态功能区); E为国家层面限制开发区域(重点生态功能区)。A: key development areas at provincial level; B: key development areas at the national level; C: restricted development areas at the national level (the main agricultural production areas); D: restricted development areas at the provincial level (key ecological function areas); E: restricted development areas at the national level (key ecological functional areas). | |||||
下载: 导出CSV表62015年四川省各市(州)生态补偿标准区间
Table6.Intervals of ecological compensation standards of cities and states in Sichuan Province in 2015
| ×108¥ | |
| 主体功能区 Main function area | 生态补偿标准 Ecological compensation standard |
| A | 攀枝花市(22.49, 79.39)、内江市(18.22, 64.34)、宜宾市(18.11, 63.94)、南充市(16.50, 58.23)、自贡市(10.31, 36.41)、遂宁市(9.71, 34.27)。Panzhihua City (22.49, 79.39), Neijiang City (18.22, 64.34), Yibin City (18.11, 63.94), Nanchong City (16.50, 58.23), Zigong City (10.31, 36.41), Suining City (9.71, 34.27). |
| B | 成都市(71.54, 252.56)、乐山市(22.81, 80.52)、绵阳市(17.75, 62.67)、德阳市(17.56, 61.99)、眉山市(12.92, 45.61)、资阳市(11.36, 40.11)。Chengdu City (71.54, 252.56), Leshan City (22.81, 80.52), Mianyang City (17.75, 62.67), Deyang City (17.56, 61.99), Meishan City (12.92, 45.61), Ziyang City (11.36, 40.11). |
| C | 达州市(18.66, 65.88)、泸州市(17.12, 60.43)、广安市(11.55, 40.78)、广元市(5.95, 20.99)。Dazhou City (18.66, 65.88), Luzhou City (17.12, 60.43), Guang’an City (11.55, 40.78), Guangyuan City (5.95, 20.99). |
| D | 凉山州(9.69, 34.22)。Liangshan Yi Autonomous Prefecture (9.69, 34.22). |
| E | 雅安市(5.93, 20.94)、巴中市(5.01, 17.70)、阿坝州(2.45, 8.65)、甘孜州(-5.82, -20.56)。Ya’an City (5.93, 20.94), Bazhong City (5.01, 17.70), Aba Tibetan Autonomous Prefecture (2.45, 8.65), Ganzi Tibetan Autonomous Prefecture (-5.82, -20.56). |
| A为省级层面重点开发区域; B为国家层面重点开发区域; C为国家层面限制开发区域(农产品主产区); D为省级层面限制开发区域(重点生态功能区); E为国家层面限制开发区域(重点生态功能区)。21个市(州)生态补偿标准均以开区间表示, 单位为108元, 正值为应提供的生态补偿, 负值为应得到的生态补偿。A: key development areas at provincial level; B: key development areas at the national level; C: restricted development areas at the national level (the main agricultural production areas); D: restricted development areas at the provincial level (key ecological function areas); E: restricted development areas at the national level (key ecological functional areas). The ecological compensation standards of 21 cities (states) are all expressed in the open interval, the unit is 108 RMB, the positive value is the ecological compensation that should be provided, and the negative value is the ecological compensation that should be obtained. | |
下载: 导出CSV参考文献
| [1] | CANADELL J G. Land use effects on terrestrial carbon sources and sinks[J]. Science in China Series C:Life Sciences, 2002, 45(S1):1-9 doi: 10.1007/BF02878382 |
| [2] | HOUGHTON R A. The annual net flux of carbon to the atmosphere from changes in land use 1850-1990[J]. Tellus B:Chemical and Physical Meteorology, 1999, 51(2):298-313 doi: 10.3402/tellusb.v51i2.16288 |
| [3] | 李蓓蓓, 方修琦, 叶瑜, 等.中国东北地区过去300年耕地开垦导致的碳收支[J].中国科学:地球科学, 2014, 44(9):1987-1996 http://www.cnki.com.cn/Article/CJFDTOTAL-JDXK201409011.htm LI B B, FANG X Q, YE Y, et al. Carbon emissions induced by cropland expansion in Northeast China during the past 300 years[J]. Science China:Earth Sciences, 2014, 44(9):1987-1996 http://www.cnki.com.cn/Article/CJFDTOTAL-JDXK201409011.htm |
| [4] | 吴昊玥, 何艳秋, 陈柔.中国农业碳排放绩效评价及随机性收敛研究——基于SBM-Undesirable模型与面板单位根检验[J].中国生态农业学报, 2017, 25(9):1381-1391 http://www.ecoagri.ac.cn/zgstny/ch/reader/view_abstract.aspx?file_no=20170915&flag=1 WU H Y, HE Y Q, CHEN R. Assessment of agricultural carbon emission performance and stochastic convergence in China using SBM-Undesirable model and panel unit root test[J]. Chinese Journal of Eco-Agriculture, 2017, 25(9):1381-1391 http://www.ecoagri.ac.cn/zgstny/ch/reader/view_abstract.aspx?file_no=20170915&flag=1 |
| [5] | BOLIN B. Changes of land biota and their importance for the carbon cycle[J]. Science, 1977, 196(4290):613-615 doi: 10.1126/science.196.4290.613 |
| [6] | HOUGHTON R A. Changes in terrestrial carbon over the last 135 years[M]//HEIMANN M. The Global Carbon Cycle. Berlin, Heidelberg: Springer, 1993: 139-157 |
| [7] | RICHARDS J F, FLINT E P, DANIELS R C. Historic Land Use and Carbon Estimates for South and Southeast Asia: 1880-1980[R]. Oak Ridge, TN: Oak Ridge National Laboratory, 1994 |
| [8] | GUO L B, GIFFORD R M. Soil carbon stocks and land use change:A meta analysis[J]. Global Change Biology, 2002, 8(4):345-360 doi: 10.1046/j.1354-1013.2002.00486.x |
| [9] | LIU J X, VOGELMANN J E, ZHU Z L, et al. Estimating California ecosystem carbon change using process model and land cover disturbance data:1951-2000[J]. Ecological Modelling, 2011, 222(14):2333-2341 doi: 10.1016/j.ecolmodel.2011.03.042 |
| [10] | RAVINDRANATH N H, MURTHY I K, CHATURVEDI R K, et al. Carbon forestry economic mitigation potential in India, by land classification[J]. Mitigation and Adaptation Strategies for Global Change, 2007, 12(6):1027-1050 doi: 10.1007/s11027-006-9063-4 |
| [11] | 刘学荣, 杨琳, 王颖, 等.基于土地利用变化的东北地区碳排放效应研究[J].水土保持通报, 2017, 37(2):107-114 http://d.old.wanfangdata.com.cn/Periodical/stbctb201702017 LIU X R, YANG L, WANG Y, et al. Assessment of carbon emissions based on land use change in Northeast China[J]. Bulletin of Soil and Water Conservation, 2017, 37(2):107-114 http://d.old.wanfangdata.com.cn/Periodical/stbctb201702017 |
| [12] | 王刚, 张华兵, 薛菲, 等.成都市县域土地利用碳收支与经济发展关系研究[J].自然资源学报, 2017, 32(7):1170-1182 http://d.old.wanfangdata.com.cn/Periodical/zrzyxb201707008 WANG G, ZHANG H B, XUE F, et al. Relations between land use carbon budget and economic development at county level in Chengdu City[J]. Journal of Natural Resources, 2017, 32(7):1170-1182 http://d.old.wanfangdata.com.cn/Periodical/zrzyxb201707008 |
| [13] | 刘慧灵, 伍世代, 韦素琼, 等.基于低碳经济导向的土地利用结构优化研究——以福建省福州市为例[J].水土保持通报, 2017, 37(6):202-208 http://www.wanfangdata.com.cn/details/detail.do?_type=perio&id=stbctb201706034 LIU H L, WU S D, WEI S Q, et al. Optimization research of low-carbon economy oriented land use structure-A case study in Fuzhou City of Fujian Province[J]. Bulletin of Soil and Water Conservation, 2017, 37(6):202-208 http://www.wanfangdata.com.cn/details/detail.do?_type=perio&id=stbctb201706034 |
| [14] | 崔盼盼, 张艳平, 张丽君, 等.中国省域隐含碳排放及其驱动机理时空演变分析[J].自然资源学报, 2018, 33(5):879-892 http://d.old.wanfangdata.com.cn/Periodical/zrzyxb201805013 CUI P P, ZHANG Y P, ZHANG L J, et al. Analysis on the spatial and temporal evolution of indirect carbon emissions and its driving mechanism in China[J]. Journal of Natural Resources, 2018, 33(5):879-892 http://d.old.wanfangdata.com.cn/Periodical/zrzyxb201805013 |
| [15] | 黎孔清, 陈俭军, 马豆豆.基于STIRPAT和GM(1, 1)模型的湖南省农地投入碳排放增长机理及趋势预测[J].长江流域资源与环境, 2018, 27(2):345-352 http://d.old.wanfangdata.com.cn/Periodical/cjlyzyyhj201802013 LI K Q, CHEN J J, MA D D. Growth mechanism and trend forecast of carbon emission from farmland inputs in Hunan Province based on Stirpat and GM (1, 1) model[J]. Resources and Environment in the Yangtze Basin, 2018, 27(2):345-352 http://d.old.wanfangdata.com.cn/Periodical/cjlyzyyhj201802013 |
| [16] | 柳荻, 胡振通, 靳乐山.生态保护补偿的分析框架研究综述[J].生态学报, 2018, 38(2):380-392 http://d.old.wanfangdata.com.cn/Periodical/stxb201802003 LIU D, HU Z T, JIN L S. Review on analytical framework of eco-compensation[J]. Acta Ecologica Sinica, 2018, 38(2):380-392 http://d.old.wanfangdata.com.cn/Periodical/stxb201802003 |
| [17] | 王雅敬, 谢炳庚, 李晓青, 等.长株潭经济圈土地利用变化的碳排放量及生态补偿研究[J].生态科学, 2017, 36(4):160-165 http://d.old.wanfangdata.com.cn/Periodical/stkx201704022 WANG Y J, XIE B G, LI X Q, et al. Research on benefit carbon emission and countervail ecological system of Chang-Zhu-Tan land exploit[J]. Ecological Science, 2017, 36(4):160-165 http://d.old.wanfangdata.com.cn/Periodical/stkx201704022 |
| [18] | GREEN C. Potential scale-related problems in estimating the costs of CO2 mitigation policies[J]. Climatic Change, 2000, 44(3):331-349 doi: 10.1023/A:1005597112439 |
| [19] | 彭文甫, 周介铭, 徐新良, 等.基于土地利用变化的四川省碳排放与碳足迹效应及时空格局[J].生态学报, 2016, 36(22):7244-7259 http://d.old.wanfangdata.com.cn/Periodical/stxb201622037 PENG W F, ZHOU J M, XU X L, et al. Effect of land use changes on the temporal and spatial patterns of carbon emissions and carbon footprints in the Sichuan Province of Western China, from 1990 to 2010[J]. Acta Ecologica Sinica, 2016, 36(22):7244-7259 http://d.old.wanfangdata.com.cn/Periodical/stxb201622037 |
| [20] | 方精云, 郭兆迪, 朴世龙, 等. 1981-2000年中国陆地植被碳汇的估算[J].中国科学D辑:地球科学, 2007, 37(6):804-812 http://d.old.wanfangdata.com.cn/Periodical/zgkx-cd200706012 FANG J Y, GUO Z D, PIAO S L, et al. Terrestrial vegetation carbon sinks in China, 1981-2000[J]. Science in China Series D:Earth Sciences, 2007, 37(6):804-812 http://d.old.wanfangdata.com.cn/Periodical/zgkx-cd200706012 |
| [21] | 王秋贤, 王登杰, 颜晓妹, 等.基于脱钩理论的烟台市碳排放效应分析[J].水土保持通报, 2015, 35(2):313-318 http://d.old.wanfangdata.com.cn/Periodical/stbctb201502058 WANG Q X, WANG D J, YAN X M, et al. An analysis on carbon emission effects in Yantai City based on decoupling theory[J]. Bulletin of Soil and Water Conservation, 2015, 35(2):313-318 http://d.old.wanfangdata.com.cn/Periodical/stbctb201502058 |
| [22] | 李颖, 黄贤金, 甄峰.江苏省区域不同土地利用方式的碳排放效应分析[J].农业工程学报, 2008, 24(S2):102-107 http://d.old.wanfangdata.com.cn/Conference/7424407 LI Y, HUANG X J, ZHEN F. Effects of land use patterns on carbon emission in Jiangsu Province[J]. Transactions of the CSAE, 2008, 24(S2):102-107 http://d.old.wanfangdata.com.cn/Conference/7424407 |
| [23] | 苏雅丽, 张艳芳.陕西省土地利用变化的碳排放效益研究[J].水土保持学报, 2011, 25(1):152-156 http://d.old.wanfangdata.com.cn/Periodical/trqsystbcxb201101032 SU Y L, ZHANG Y F. Study on effects of carbon emission by land use patterns of Shaanxi Province[J]. Journal of Soil and Water Conservation, 2011, 25(1):152-156 http://d.old.wanfangdata.com.cn/Periodical/trqsystbcxb201101032 |
| [24] | 何勇.中国气候、陆地生态系统碳循环研究[M].北京:气象出版社, 2006 HE Y. Research on Carbon Cycle in Climate and Terrestrial Ecosystems in China[M]. Beijing:Meteorological Press, 2006 |
| [25] | 赖力, 黄贤金, 刘伟良, 等.基于投入产出技术的区域生态足迹调整分析——以2002年江苏为例[J].生态学报, 2006, 26(4):1285-1292 doi: 10.3321/j.issn:1000-0933.2006.04.041 LAI L, HUANG X J, LIU W L, et al. Adjustment for regional ecological footprint based on input-output technique:A case study of Jiangsu Province in 2002[J]. Acta Ecologica Sinica, 2006, 26(4):1285-1292 doi: 10.3321/j.issn:1000-0933.2006.04.041 |
| [26] | 段晓男, 王效科, 逯非, 等.中国湿地生态系统固碳现状和潜力[J].生态学报, 2008, 28(2):463-469 doi: 10.3321/j.issn:1000-0933.2008.02.002 DUAN X N, WANG X K, LU F, et al. Carbon sequestration and its potential by wetland ecosystems in China[J]. Acta Ecologica Sinica, 2008, 28(2):463-469 doi: 10.3321/j.issn:1000-0933.2008.02.002 |
| [27] | 赖力.中国土地利用的碳排放效应研究[D].南京: 南京大学, 2010 LAI L. Carbon emission effect of land use in China[D]. Nanjing: Nanjing University, 2010 |
| [28] | 徐国泉, 刘则渊, 姜照华.中国碳排放的因素分解模型及实证分析:1995-2004[J].中国人口·资源与环境, 2006, 16(6):158-161 doi: 10.3969/j.issn.1002-2104.2006.06.030 XU G Q, LIU Z Y, JIANG Z H. Decomposition model and empirical study of carbon emissions for China, 1995-2004[J]. China Population, Resources and Environment, 2006, 16(6):158-161 doi: 10.3969/j.issn.1002-2104.2006.06.030 |
| [29] | 张秀梅, 李升峰, 黄贤金, 等.江苏省1996年至2007年碳排放效应及时空格局分析[J].资源科学, 2010, 32(4):768-775 http://d.old.wanfangdata.com.cn/Periodical/zykx201004026 ZHANG X M, LI S F, HUANG X J, et al. Effects of carbon emissions and their spatio-temporal patterns in Jiangsu Province from 1996 to 2007[J]. Resources Science, 2010, 32(4):768-775 http://d.old.wanfangdata.com.cn/Periodical/zykx201004026 |
| [30] | TAO Y G, HUANG Z F. Review of accounting for carbon dioxide emissions from tourism at different spatial scales[J]. Acta Ecologica Sinica, 2014, 34(5):246-254 doi: 10.1016/j.chnaes.2014.03.007 |
| [31] | CAI Z C, KANG G D, TSURUTA H, et al. Estimate of CH4 emissions from year-round flooded rice fields during rice growing season in China[J]. Pedosphere, 2005, 15(1):66-71 http://www.cqvip.com/Main/Detail.aspx?id=15219373 |
| [32] | MA C B, STERN D I. China's changing energy intensity trend:a decomposition analysis[J]. Energy Economics, 2008, 30(3):1037-1053 doi: 10.1016/j.eneco.2007.05.005 |
| [33] | 谢守红, 王利霞, 邵珠龙.国内外碳排放研究综述[J].干旱区地理, 2014, 37(4):720-730 http://d.old.wanfangdata.com.cn/Periodical/xdjjxx201413207 XIE S H, WANG L X, SHAO Z L. Review on carbon emissions researches at home and abroad[J]. Arid Land Geography, 2014, 37(4):720-730 http://d.old.wanfangdata.com.cn/Periodical/xdjjxx201413207 |
| [34] | 孙贤斌, 傅先兰, 倪建华, 等.安徽省会经济圈碳排放强度与生态补偿研究[J].地域研究与开发, 2012, 31(1):135-138 doi: 10.3969/j.issn.1003-2363.2012.01.028 SUN X B, FU X L, NI J H, et al. Intensity of carbon emissions and ecological compensation in the city ecology circle in Anhui Province[J]. Areal Research and Development, 2012, 31(1):135-138 doi: 10.3969/j.issn.1003-2363.2012.01.028 |
| [35] | 王亮.盐城市土地利用变化碳排放效益及影响因素分解研究[J].生态科学, 2015, 34(5):122-128 http://d.old.wanfangdata.com.cn/Conference/9187211 WANG L. Research for decomposition results of impact factors about carbon emission by land use patterns in Yancheng City[J]. Ecological Science, 2015, 34(5):122-128 http://d.old.wanfangdata.com.cn/Conference/9187211 |
| [36] | 刘建华, 许皞, 王耀, 等.基于土地利用格局变化的生态风险与固碳功能评价——以河北省黄骅市为例[J].中国生态农业学报, 2018, 26(8):1217-1226 http://www.ecoagri.ac.cn/zgstny/ch/reader/view_abstract.aspx?file_no=2018-0814&flag=1 LIU J H, XU H, WANG Y, et al. Evaluation of ecological risk and carbon fixation from land use change:A case study of Huanghua City, Hebei Province[J]. Chinese Journal of Eco-Agriculture, 2018, 26(8):1217-1226 http://www.ecoagri.ac.cn/zgstny/ch/reader/view_abstract.aspx?file_no=2018-0814&flag=1 |
