罗文兵
湖南科技大学商学院 湘潭 411201
基金项目: 教育部人文社会科学研究规划基金项目18YJAZH013
教育部人文社会科学研究规划基金项目18YJAZH013, 13YJCZH276
湖南省哲学社会科学基金一般项目17YBA156
详细信息
作者简介:邓明君, 主要研究方向为绿色农业发展战略。E-mail:mjdeng@hnust.edu.cn
中图分类号:X511计量
文章访问数:1210
HTML全文浏览量:3
PDF下载量:898
被引次数:0
出版历程
收稿日期:2018-01-04
录用日期:2018-05-02
刊出日期:2018-09-01
Space-time evolution of China's agricultural ammonia emission and emission reduction potential
DENG Mingjun,,LUO Wenbing
School of Business, Hunan University of Science and Technology, Xiangtan 411201, China
Funds: the Project of Humanities and Social Sciences of Ministry of Education in China18YJAZH013
the Project of Humanities and Social Sciences of Ministry of Education in China18YJAZH013, 13YJCZH276
the General Project of Hunan Philosophy and Social Science Fund, China17YBA156
More Information
Corresponding author:DENG Mingjun, E-mail: mjdeng@hnust.edu.cn
摘要
HTML全文
图
参考文献
相关文章
施引文献
资源附件
访问统计
摘要
摘要:中国雾霾成因比发达国家更为复杂,人为源氨气(NH3)污染是中国PM2.5指数被持续推高的重要因素,却一直被全社会所忽视。已有研究表明,人为源NH3排放主要来自农业,农业NH3减排是雾霾治理最经济有效的方法,因此,研究中国农业NH3减排潜力对中国控氨治霾具有重要现实意义。本文基于各类统计年鉴和研究成果中的相关数据,参考《大气氨源排放清单编制技术指南(试行)》,构建农业NH3减排潜力分析模型,应用排放因子法和情景分析法,测算并分析了中国2004-2013年农业NH3排放演变和2020-2030年农业NH3减排潜力。结果表明:1)2013年中国农业NH3排放总量为1 193.92万t,比2004年增长18.59%。2)农业年NH3排放总量在60万t以上的省市,2004年有河南、山东、河北和内蒙古4省,到2013年演变为河南、内蒙古、河北、山东、新疆和四川6省。3)趋势照常情景(business-as-usual,BAU)下,2020年、2025年和2030年中国农业NH3排放将比2013年分别提高15.26%、23.60%和30.23%。4)减排情景下,2020年、2025年和2030年的中国农业NH3排放将比BAU情景分别减少319.40万t、501.31万t和660.40万t,将比2013年分别下降11.49%、18.39%和25.08%。5)未来中国农业NH3减排的关键取决于中国居民消费畜禽产品的数量和结构,其次是中国畜禽养殖的饲料营养水平改变。6)未来中国农业NH3减排重点区域在河南、山东、河北、内蒙古和四川。由此可见,BAU情境下未来中国农业NH3排放将失控,未来中国农业NH3减排必须从大力削减重点区域排放和加速转变居民畜禽产品消费行为两方面入手。
Abstract:The causes of haze in China are more complicated than those in developed countries. Artificial ammonia (NH3) pollution is an important factor driving the continuous increase in PM2.5 index in China, but so widely ignored by the entire society. Existing research shows that artificial NH3 emission come mainly from agriculture. Thus, agricultural NH3 emission reduction is the most economic and effective method of haze governance. Therefore, research on agricultural NH3 emission reduction potential has significant practical significance for the governance of haze in China. Based on the related data (statistical yearbook and research results), referred to as "Technical Guidelines for Preparation of Atmospheric Ammonia Emission Inventory (for Trial Implementation)", we built an analytical model of agricultural NH3 emission reduction potential, calculated and analyzed temporal evolution of China's agricultural NH3 emission for the period from 2004 to 2013 and the reduction potential of agricultural NH3 emission for the period from 2020 to 2030 using emission factor method and scenario analysis. The results showed that:1) total agricultural NH3 emission was 11.939 2 million tons in 2013, up 18.59% compared to 2004. 2) The provinces and cities where total amount of agricultural NH3 emission was 0.6 million t·a-1 or more in 2004 were Henan, Shandong, Hebei and Inner Mongolia provinces. By 2013, this had expanded to six provinces-Henan, Inner Mongolia, Hebei, Shandong, Xinjiang and Sichuan. 3) Under business-as-usual (BAU) scenario, China's agricultural NH3 emissions in 2020, 2025 and 2030 increased by 15.26%, 23.60% and 30.23%, respectively, over that in 2013. 4) Under abatement scenario, China's agricultural NH3 emissions in 2020, 2025 and 2030 reduced by 3.194 million tons, 5.013 million tons and 6.604 million tons, respectively, compared with BAU scenario, which were respectively 11.49%, 18.39%, and 25.08% lower than the 2013 levels. 5) For the future, the key to China's agricultural NH3 emission reduction depended on the quantity and consumption structure of China's household consumption of livestock and poultry products. Next, it depended on the changes in feed nutrient levels in China's livestock and poultry farming. 6) The key potential agricultural NH3 emission reduction provinces were Henan, Shandong, Hebei, Inner Mongolia and Sichuan. Thus for future control of China's agricultural NH3 emissions under BAU scenario, the implementation of China's agricultural NH3 emissions reduction must be done by vigorously cutting down emissions in key areas and accelerating the transformation of consumer behavior in livestock and poultry products.
HTML全文
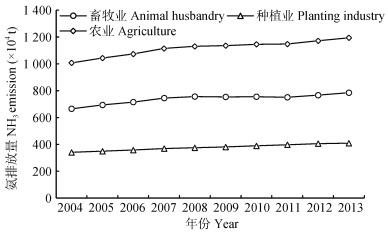
图12004—2013年中国畜牧业、种植业NH3排放及农业NH3排放总量
Figure1.NH3 emissions of animal husbandry, planting industry and total agriculture in China from 2004 to 2013
 下载: 全尺寸图片幻灯片
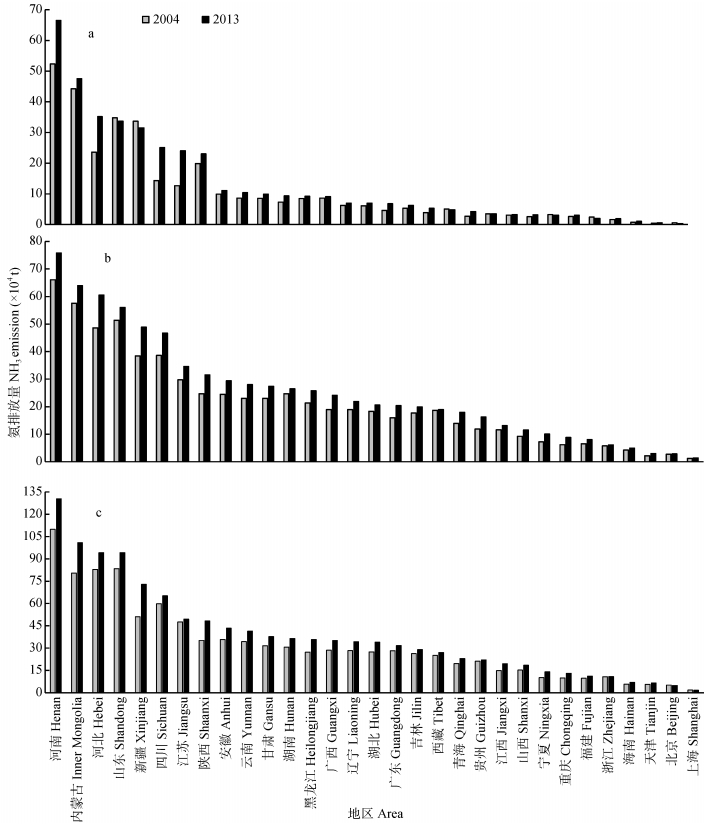
图22004年和2013年中国各省市种植业(a)、养殖业(b)及农业(c)NH3排放总量
Figure2.NH3 emissions from planting industry (a), animal husbandry (b) and total agriculture (c) in China's provinces and cities in 2004 and 2013
下载: 全尺寸图片幻灯片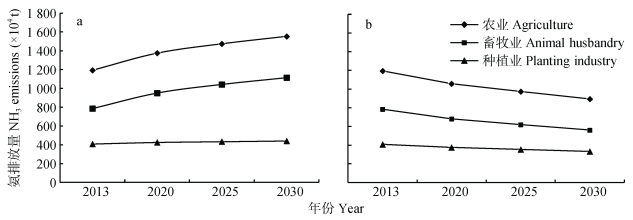
图3趋势照常(BAU)情景(a)和减排情景(b)下未来中国农业NH3排放量
Figure3.China's agricultural NH3 emissions in business-as-usual (BAU) scenario (a) and in emission abatement scenario (b)
下载: 全尺寸图片幻灯片表1不同土壤类型不同温度下各类氮肥的NH3基准排放系数(单位为氮肥施用量的百分比)
Table1.Baseline emission factors for various nitrogen fertilizers at different temperatures in different soil groups (in % of N fertilizer application)
| 土壤种类 Great soil group | 温度 Temperature (℃) | 尿素 Urea | 碳酸氢铵 Ammonium bicarbonate | 硝酸铵 Ammonium nitrate | 硫酸胺 Ammonium sulfate | 其他 Others |
| 酸性土壤 Acid soil | < 10 | 0.51 | 1.71 | 0.36 | 0.66 | 0.21 |
| 10~20 | 2.51 | 2.61 | 0.40 | 0.82 | 0.23 | |
| 碱性土壤 Alkaline soil | 20~30 | 4.50 | 3.52 | 0.45 | 0.97 | 0.26 |
| > 30 | 5.50 | 3.98 | 0.47 | 1.05 | 0.27 | |
| < 10 | 12.66 | 6.02 | 1.25 | |||
| 10~20 | 14.66 | 6.93 | 1.40 | |||
| 20~30 | 16.66 | 7.84 | 1.56 | |||
| > 30 | 17.66 | 8.29 | 1.63 |
下载: 导出CSV表2不同温度下集约化养殖和散养的各类畜禽养殖的NH3排放因子
Table2.NH3 emission factors of different livestock and poultry species at different temperatures under intensive farming or free-rang livestock breeding kg?head-1
| 畜禽种类 Livestock and poultry species | 集约化养殖Intensive livestock breeding | 散养Free-range livestock breeding | |||||
| < 10 ℃ | 10~20 ℃ | > 20 ℃ | < 10 ℃ | 10~20 ℃ | > 20 ℃ | ||
| 肉牛 < 1 a Beef cattle < 1 a | 11.50 | 11.68 | 11.87 | 11.93 | 12.00 | 12.06 | |
| 肉牛 > 1 a Beef cattle > 1 a | 27.52 | 28.37 | 29.23 | 27.96 | 28.26 | 28.56 | |
| 奶牛 < 1 a Cows < 1 a | 11.50 | 11.68 | 11.87 | 11.93 | 12.00 | 12.06 | |
| 奶牛 > 1 a Cows > 1 a | 53.55 | 55.20 | 56.88 | 44.54 | 45.12 | 45.70 | |
| 山羊 < 1 a Goat < 1 a | 3.24 | 3.29 | 3.34 | 3.36 | 3.38 | 3.40 | |
| 山羊 > 1 a Goat > 1 a | 5.58 | 5.61 | 5.66 | 5.32 | 5.34 | 5.36 | |
| 绵羊 < 1 a Sheep < 1 a | 3.24 | 3.29 | 3.34 | 3.36 | 3.38 | 3.40 | |
| 绵羊 > 1 a Sheep > 1 a | 5.58 | 5.61 | 5.66 | 5.32 | 5.34 | 5.36 | |
| 母猪Sow | 4.61 | 4.88 | 5.16 | 3.46 | 3.53 | 3.60 | |
| 肉猪 < 75 d Hog < 75 d | 0.21 | 0.22 | 0.23 | 0.15 | 0.16 | 0.16 | |
| 肉猪 > 75 d Hog > 75 d | 0.83 | 0.89 | 0.96 | 0.60 | 0.61 | 0.62 | |
| 马、驴、骡和骆驼Horses, donkeys, storks and camels | 28.25 | 28.45 | 28.65 | 14.37 | 14.46 | 14.55 | |
| 蛋鸡Egg chicken | 0.29 | 0.35 | 0.39 | 0.37 | 0.41 | 0.43 | |
| 蛋鸭Egg duck | 0.32 | 0.34 | 0.36 | 0.28 | 0.30 | 0.31 | |
| 蛋鹅Egg goose | 0.16 | 0.17 | 0.18 | 0.14 | 0.15 | 0.15 | |
| 肉鸡Meat chicken | 0.03 | 0.04 | 0.04 | 0.04 | 0.04 | 0.04 | |
| 肉鸭Meat duck | 0.04 | 0.04 | 0.04 | 0.03 | 0.03 | 0.03 | |
| 肉鹅Meat goose | 0.02 | 0.03 | 0.03 | 0.02 | 0.02 | 0.02 | |
下载: 导出CSV表3趋势照常(BAU)情景下未来中国畜禽产品产量的增长比例(与2013年相比)
Table3.Proportions of China's livestock production growth in the future under the business-as-usual (BAU) scenario (compared with 2013)
| % | |||||
| 年份Year | 猪肉Pork | 禽肉Poultry | 牛羊肉Beef and mutton | 牛奶Milk | 禽蛋Poultry eggs |
| 2020 | 10.03 | 6.92 | 41.82 | 13.98 | 14.41 |
| 2025 | 16.67 | 13.56 | 52.00 | 21.78 | 17.22 |
| 2030 | 23.69 | 20.61 | 62.88 | 31.93 | 22.91 |
下载: 导出CSV表4未来中国氮肥施用的NH3减排情景(以2013氮肥施用量为基准)
Table4.NH3 abatement scenario of China's nitrogen fertilizer application (based on the amount of nitrogen fertilizer applied in 2013)
| % | |||
| 年份 Year | 相关措施应用减少全国氮肥施用的比例 Reduced proportion of nitrogen fertilizer application in the country by relevant measures application | 缓控释氮肥占氮肥施用比例的增加 Increasing proportion of controlled-release nitrogen fertilizers accounted for N fertilizer application | 全国氮肥深施比例的增加 Increasing proportion of deep nitrogen fertilizer application in the country |
| 2020 | 4.5 | 1.5 | 5 |
| 2025 | 6.0 | 3.0 | 10 |
| 2030 | 7.5 | 4.5 | 15 |
| 以上比例根据目前实际情况人为设定。The above proportions are artificially set according to the current actual situation. | |||
下载: 导出CSV表5中国2013年人均畜禽产品消费量以及营养学建议水平
Table5.China's per capita consumption of livestock products in 2013 and the levels of nutrition recommendation
| g·d-1 | ||||||
| 项目 Item | 牛羊肉 Beef and mutton | 猪肉 Pork | 禽肉 Poultry | 其他肉类 Other meat | 禽蛋 Poultry eggs | 奶类及奶制品 Milk and dairy products |
| 2013年人均消费量 Per capita consumption in 2013 | 9.89 | 63.07 | 27.18 | 2.69 | 57.91 | 143.13 |
| 营养学建议水平 Nutritional recommendation level | 40~75 (畜禽肉合计Total livestock and poultry meat) | 40~50 | 300 | |||
| 畜禽产品包括畜禽产品进出口净值; 奶类制品主要由城镇居民消费, 本文以城镇人口数计算。Livestock and poultry products include the net value of imports and exports. Milk products are mainly consumed by urban residents, this paper uses the urban population to calculate. | ||||||
下载: 导出CSV表6未来中国人均畜禽产品消费情景下中国畜禽养殖减少比例
Table6.Reduction ratio of China's livestock breeding under consumption scenario in future
| 年份 Year | 畜禽肉人均消费量 Per capita consumption of livestock and poultry (g·d-1) | 禽蛋人均消费量 Per capita egg consumption (g·d-1) | 肉猪养殖减少比例 Reduction ratio of hog farming (%) | 肉牛养殖减少比例 Reduction ratio of beef cattle breeding (%) | 蛋鸡养殖减少比例 Reduction ratio of egg chicken breeding (%) |
| 2020 | 92 | 55 | 8.87 | 8.04 | 5.06 |
| 2025 | 82 | 50 | 17.46 | 15.83 | 14.06 |
| 2030 | 72 | 45 | 26.15 | 23.71 | 23.23 |
下载: 导出CSV表7未来中国畜禽养殖的NH3减排情景(与2013年相比)
Table7.NH3 emission abatement scenario for China's livestock and poultry farming in future (compared with 2013)
| 年份 Year | 饲料中添加酶和活菌剂比例的增加 Increasing proportion of enzymes and live bacteria added to feed | 饲料营养水平改变比例的增加 Increasing proportion of feed nutrient changes | 生物发酵床应用比例的增加 Increasing proportion of biological fermentation bed applications |
| 2020 | 10 | 20 | 3 |
| 2025 | 15 | 25 | 5 |
| 2030 | 20 | 30 | 7 |
| 以上比例根据目前实际情况人为设定。The above proportions are artificially set according to the current actual situation. | |||
下载: 导出CSV表82020—2030年减排情景下中国农业的绝对NH3减排潜力
Table8.Potential of China's agricultural absolute NH3 emission reduction under the emission abatement scenario from 2020 to 2030
| ×104 t | |||
| 年份 Year | 农业总量 Total of agriculture | 畜牧业 Animal husbandry | 种植业 Planting industry |
| 2020 | 319.40 | 268.99 | 50.41 |
| 2025 | 501.31 | 421.88 | 79.43 |
| 2030 | 660.40 | 551.78 | 108.62 |
下载: 导出CSV表9中国农业的相对NH3减排潜力来源(2013年为基准年)
Table9.Potential sources of China's agricultural relative NH3 emission reduction (with 2013 as the base year)
| % | ||||
| 项目Item | 2020 | 2025 | 2030 | |
| 相对减排潜力Relative emission reduction potential | 11.49 | 18.39 | 25.08 | |
| 减排潜力来源所占比重 Proportion of NH3 emission reduction resource | 氮肥施用减少Nitrogen fertilizer application reduction | 13.42 | 11.18 | 10.24 |
| 施用缓控释氮肥Application of slow controlled release nitrogen fertilizer | 1.09 | 1.36 | 1.50 | |
| 氮肥深施Deep application of nitrogen fertilizer | 10.14 | 12.67 | 13.93 | |
| 居民减少畜禽产品消费Reduction of resident consumption of livestock and poultry product | 23.26 | 30.11 | 33.64 | |
| 饲料中添加酶和活菌剂Enzymes and living bacteria in feed | 16.47 | 14.73 | 13.71 | |
| 饲料营养水平改变Feed nutrition level change | 21.96 | 16.37 | 13.71 | |
| 生物发酵床应用Biological fermentation bed application | 13.67 | 13.59 | 13.27 | |
下载: 导出CSV表102020—2030年中国农业的相对NH3减排潜力空间分布(2013年为基准年)
Table10.Spatial distribution of China's agricultural relative potential of NH3 emission reduction (2013 as the base year) from 2020 to 2030
| ×104 t | |||||||||||
| 地区Area | 2020 | 2025 | 2030 | ||||||||
| 畜牧业 Animal husbandry | 种植业 Planting industry | 农业总量 Total of agriculture | 畜牧业 Animal husbandry | 种植业 Planting industry | 农业总量 Total of agriculture | 畜牧业 Animal husbandry | 种植业 Planting industry | 农业总量 Total of agriculture | |||
| 河南Henan | 8.69 | 5.50 | 14.19 | 13.98 | 9.00 | 22.98 | 19.05 | 12.50 | 31.55 | ||
| 山东Shandong | 7.39 | 2.78 | 10.17 | 11.67 | 4.55 | 16.22 | 15.80 | 6.33 | 22.13 | ||
| 内蒙古Inner Mongolia | 8.36 | 2.08 | 10.44 | 12.57 | 3.40 | 15.97 | 16.68 | 4.72 | 21.40 | ||
| 河北Hebei | 5.62 | 3.93 | 9.55 | 8.79 | 6.43 | 15.22 | 11.85 | 8.93 | 20.78 | ||
| 四川Sichuan | 7.98 | 0.76 | 8.74 | 12.84 | 1.24 | 14.08 | 17.47 | 1.73 | 19.20 | ||
| 新疆Xinjiang | 5.32 | 1.99 | 7.31 | 7.97 | 3.25 | 11.22 | 10.57 | 4.52 | 15.09 | ||
| 云南Yunnan | 5.00 | 0.56 | 5.56 | 8.01 | 0.92 | 8.93 | 10.88 | 1.28 | 12.16 | ||
| 江苏Jiangsu | 2.27 | 2.61 | 4.88 | 3.69 | 4.27 | 7.96 | 5.05 | 5.93 | 10.98 | ||
| 湖南Hunan | 4.35 | 0.58 | 4.93 | 7.08 | 0.95 | 8.03 | 9.68 | 1.32 | 11.00 | ||
| 广西Guangxi | 3.86 | 0.77 | 4.63 | 6.33 | 1.27 | 7.60 | 8.68 | 1.76 | 10.44 | ||
| 陕西Shaanxi | 1.66 | 2.91 | 4.57 | 2.61 | 4.76 | 7.37 | 3.52 | 6.61 | 10.13 | ||
| 安徽Anhui | 2.59 | 1.90 | 4.49 | 4.14 | 3.12 | 7.26 | 5.63 | 4.33 | 9.96 | ||
| 湖北Hubei | 3.51 | 0.82 | 4.33 | 5.73 | 1.34 | 7.07 | 7.85 | 1.87 | 9.72 | ||
| 黑龙江Heilongjiang | 4.11 | 0.35 | 4.46 | 6.46 | 0.57 | 7.03 | 8.72 | 0.79 | 9.51 | ||
| 辽宁Liaoning | 3.73 | 0.52 | 4.25 | 6.00 | 0.84 | 6.84 | 8.18 | 1.17 | 9.35 | ||
| 甘肃Gansu | 3.46 | 0.86 | 4.32 | 5.38 | 1.41 | 6.79 | 7.23 | 1.95 | 9.18 | ||
| 广东Guangdong | 3.06 | 0.92 | 3.98 | 5.07 | 1.50 | 6.57 | 6.99 | 2.09 | 9.08 | ||
| 吉林Jilin | 2.86 | 0.75 | 3.61 | 4.60 | 1.23 | 5.83 | 6.27 | 1.71 | 7.98 | ||
| 西藏Tibet | 3.70 | 0.05 | 3.75 | 5.84 | 0.08 | 5.92 | 7.89 | 0.11 | 8.00 | ||
| 贵州Guizhou | 2.89 | 0.26 | 3.15 | 4.68 | 0.43 | 5.11 | 6.38 | 0.60 | 6.98 | ||
| 青海Qinghai | 2.94 | 0.09 | 3.03 | 4.62 | 0.15 | 4.77 | 6.22 | 0.21 | 6.43 | ||
| 江西Jiangxi | 2.50 | 0.27 | 2.77 | 4.13 | 0.44 | 4.57 | 5.67 | 0.61 | 6.28 | ||
| 山西Shanxi | 1.38 | 0.58 | 1.96 | 2.14 | 0.94 | 3.08 | 2.88 | 1.31 | 4.19 | ||
| 重庆Chongqing | 1.46 | 0.25 | 1.71 | 2.39 | 0.41 | 2.80 | 3.27 | 0.57 | 3.84 | ||
| 福建Fujian | 1.16 | 0.25 | 1.41 | 1.89 | 0.41 | 2.30 | 2.58 | 0.58 | 3.16 | ||
| 宁夏Ningxia | 1.01 | 0.44 | 1.45 | 1.53 | 0.72 | 2.25 | 2.04 | 1.00 | 3.04 | ||
| 浙江Zhejiang | 0.87 | 0.40 | 1.27 | 1.44 | 0.65 | 2.09 | 1.97 | 0.91 | 2.88 | ||
| 海南Hainan | 0.73 | 0.16 | 0.89 | 1.20 | 0.26 | 1.46 | 1.64 | 0.36 | 2.00 | ||
| 天津Tianjin | 0.39 | 0.29 | 0.68 | 0.61 | 0.47 | 1.08 | 0.83 | 0.66 | 1.49 | ||
| 北京Beijing | 0.35 | 0.16 | 0.51 | 0.56 | 0.27 | 0.83 | 0.76 | 0.37 | 1.13 | ||
| 上海Shanghai | 0.17 | 0.03 | 0.20 | 0.28 | 0.05 | 0.33 | 0.38 | 0.07 | 0.45 | ||
| 全国Entire country | 103.37 | 33.82 | 137.19 | 164.23 | 55.33 | 219.56 | 222.61 | 76.90 | 299.51 | ||
下载: 导出CSV参考文献
| [1] | 孔令钰.控氨大课题[J].新世纪周刊, 2014, (35):62-64 http://d.old.wanfangdata.com.cn/Periodical/lncxhjkj201701002 KONG L Y. The big subject of controlling ammonia[J]. Century Weekly, 2014, (35):62-64 http://d.old.wanfangdata.com.cn/Periodical/lncxhjkj201701002 |
| [2] | 大洋网-广州日报. 治霾不控氨成效要打折?[EB/OL]. [2014-10-22]. http://news.163.com/14/1022/06/A9509LRH0-0014AED.html Dayang Net-Guangzhou Daily. If you do not control ammonia emissions, the effectiveness of fog and haze treatment should be discounted?[EB/OL]. [2014-10-22]. http://news.163.com/14/1022/06/A9509LRH00014AED.html |
| [3] | FANG M, CHAN C K, YAO X H. Managing air quality in a rapidly developing nation:China[J]. Atmospheric Environment, 2009, 43(1):79-86 doi: 10.1016/j.atmosenv.2008.09.064 |
| [4] | YANG F, TAN J, ZHAO Q, et al. Characteristics of PM2.5 speciation in representative megacities and across China[J]. Atmospheric Chemistry and Physics, 2011, 11(11):5207-5219 doi: 10.5194/acp-11-5207-2011 |
| [5] | PAULOT F, JACOB D J, PINDER R W, et al. Ammonia emissions in the United States, European Union, and China derived by high-resolution inversion of ammonium wet deposition data:Interpretation with a new agricultural emissions inventory (MASAGE_NH3)[J]. Journal of Geophysical Research:Atmospheres, 2014, 119(7):4343-4364 doi: 10.1002/2013JD021130 |
| [6] | 钱晓雍, 郭小品, 林立, 等.国内外农业源NH3排放影响PM2.5形成的研究方法探讨[J].农业环境科学学报, 2013, 32(10):1908-1914 doi: 10.11654/jaes.2013.10.002 QIAN X Y, GUO X P, LIN L, et al. Research methods for agriculturally emitted ammonia effects on formation of fine particulate matter (PM2.5):A review[J]. Journal of Agro-Environment Science, 2013, 32(10):1908-1914 doi: 10.11654/jaes.2013.10.002 |
| [7] | HUANG X, SONG Y, LI M M, et al. A high-resolution ammonia emission inventory in China[J]. Global Biogeochemical Cycles, 2012, 26(1):GB1030 http://d.old.wanfangdata.com.cn/OAPaper/oai_doaj-articles_c0a02001fc6de9eb189533a441782d85 |
| [8] | PINDER R W, ADAMS P J, PANDIS S N. Ammonia emission controls as a cost-effective strategy for reducing atmospheric particulate matter in the Eastern United States[J]. Environmental Science & Technology, 2007, 41(2):380-386 http://www.wanfangdata.com.cn/details/detail.do?_type=perio&id=JJ029558990 |
| [9] | DERWENT R, WITHAM C, REDINGTON A, et al. Particulate matter at a rural location in southern England during 2006:Model sensitivities to precursor emissions[J]. Atmospheric Environment, 2009, 43(3):689-696 doi: 10.1016/j.atmosenv.2008.09.077 |
| [10] | HARRISON R M, JONES A M, BEDDOWS D C S, et al. The effect of varying primary emissions on the concentrations of inorganic aerosols predicted by the enhanced UK Photochemical Trajectory Model[J]. Atmospheric Environment, 2013, 69:211-218 doi: 10.1016/j.atmosenv.2012.12.016 |
| [11] | BESSAGNET B, BEAUCHAMP M, GUERREIRO C, et al. Can further mitigation of ammonia emissions reduce exceedances of particulate matter air quality standards?[J]. Environmental Science & Policy, 2014, 44:149-163 http://cn.bing.com/academic/profile?id=302f68eedab935242c3f875870c1bd43&encoded=0&v=paper_preview&mkt=zh-cn |
| [12] | ZHANG Y, DORE A J, MA L, et al. Agricultural ammonia emissions inventory and spatial distribution in the North China Plain[J]. Environmental Pollution, 2010, 158(2):490-501 doi: 10.1016/j.envpol.2009.08.033 |
| [13] | ZHANG Y S, LUAN S J, CHEN L L, et al. Estimating the volatilization of ammonia from synthetic nitrogenous fertilizers used in China[J]. Journal of Environmental Management, 2011, 92(3):480-493 doi: 10.1016/j.jenvman.2010.09.018 |
| [14] | European Environment Agency (EEA). EMEP/EEA air pollutant emission inventory guidebook 2009[R]. Technical Guidance to Prepare National Emission Inventories. Copenhagen: EEA, 2009 |
| [15] | REIDY B, MENZI H. Assessment of the ammonia abatement potential of different geographical regions and altitudinal zones based on a large-scale farm and manure management survey[J]. Biosystems Engineering, 2007, 97(4):520-531 doi: 10.1016/j.biosystemseng.2007.03.034 |
| [16] | NDEGWA P M, HRISTOV A N, AROGO J, et al. A review of ammonia emission mitigation techniques for concentrated animal feeding operations[J]. Biosystems Engineering, 2008, 100(4):453-469 doi: 10.1016/j.biosystemseng.2008.05.010 |
| [17] | OENEMA O, VELTHOF G. Emissions from Agriculture and Their Control Potentials[R]. Belgium: DG-Environment of the European Commission, 2012 |
| [18] | 沈兴玲, 尹沙沙, 郑君瑜, 等.广东省人为源氨排放清单及减排潜力研究[J].环境科学学报, 2014, 34(1):43-53 http://d.old.wanfangdata.com.cn/Periodical/hjkxxb201401006 SHEN X L, YIN S S, ZHENG J Y, et al. Anthropogenic ammonia emission inventory and its mitigation potential in Guangdong Province[J]. Acta Scientiae Circumstantiae, 2014, 34(1):43-53 http://d.old.wanfangdata.com.cn/Periodical/hjkxxb201401006 |
| [19] | WEBB J, RYAN M, ANTHONY S G. Cost-effective means of reducing ammonia emissions from UK agriculture using the NARSES model[J]. Atmospheric Environment, 2006, 40(37):7222-7233 doi: 10.1016/j.atmosenv.2006.06.029 |
| [20] | KLIMONT Z, WINIWARTER W. Estimating costs and potential for reduction of ammonia emissions from agriculture in the GAINS model[M]//REIS S, HOWARD C, SUTTON M A. Costs of Ammonia Abatement and the Climate Co-Benefits. Dordrecht: Springer, 2015 |
| [21] | 孔令钰.农业或存50%氨气减排潜力[J].新世纪周刊, 2014, (35):55-58 KONG L Y. Agriculture may have 50% ammonia emission reduction potential[J]. Century Weekly, 2014, (35):55-58 |
| [22] | 汪开英, 代小蓉, 李震宇, 等.不同地面结构的育肥猪舍NH3排放系数[J].农业机械学报, 2010, 41(1):163-166 doi: 10.3969/j.issn.1000-1298.2010.01.031 WANG K Y, DAI X R, LI Z Y, et al. NH3 emission factors of fattening pig buildings with different floor systems[J]. Transactions of the Chinese Society for Agricultural Machinery, 2010, 41(1):163-166 doi: 10.3969/j.issn.1000-1298.2010.01.031 |
| [23] | 胡锦艳, 刘春雪, 刘小红, 等.发酵床养猪技术的现状、调研与分析[J].家畜生态学报, 2015, 36(4):74-81 doi: 10.3969/j.issn.1673-1182.2015.04.014 HU J Y, LIU C X, LIU X H, et al. Investigation and analysis of fermentation bed application in pig raising in China[J]. Acta Ecologae Animalis Domastici, 2015, 36(4):74-81 doi: 10.3969/j.issn.1673-1182.2015.04.014 |
| [24] | 叶小梅, 常志州, 钱玉婷, 等.江苏省大中型沼气工程调查及沼液生物学特性研究[J].农业工程学报, 2012, 28(6):222-227 doi: 10.3969/j.issn.1002-6819.2012.06.036 YE X M, CHANG Z Z, QIAN Y T, et al. Investigation on large and medium scale biogas plants and biological properties of digestate in Jiangsu Province[J]. Transactions of the CSAE, 2012, 28(6):222-227 doi: 10.3969/j.issn.1002-6819.2012.06.036 |
| [25] | 常志州, 靳红梅, 黄红英, 等.畜禽养殖场粪便清扫、堆积及处理单元氮损失率研究[J].农业环境科学学报, 2013, 32(5):1068-1077 http://www.wanfangdata.com.cn/details/detail.do?_type=perio&id=QKC20132013062700098930 CHANG Z Z, JIN H M, HUANG H Y, et al. Nitrogen loss during cleaning, storage, compost and anaerobic digestion of animal manures in individual treatment unit[J]. Journal of Agro-Environment Science, 2013, 32(5):1068-1077 http://www.wanfangdata.com.cn/details/detail.do?_type=perio&id=QKC20132013062700098930 |
| [26] | 宋宇. 《氨排放清单编制技术指南(试行)》(征求意见稿)编制说明[R]. 北京: 北京大学, 2014 SONG Y. Description of Technical Guidelines for the Compilation of Ammonia Emission Inventory (Trial)[R]. Beijing: Peking University, 2014 |
| [27] | 丁维军, 陶林海, 吴林, 等.新型缓释尿素对削减温室气体、NH3排放和淋溶作用的研究[J].环境科学学报, 2013, 33(10):2840-2847 http://www.actasc.cn/hjkxxb/ch/reader/view_abstract.aspx?file_no=20121210001&flag=1 DING W J, TAO L H, WU L, et al. Effects of controlled release urea on greenhouse gases, NH3 emissions and eluviation[J]. Acta Scientiae Circumstantiae, 2013, 33(10):2840-2847 http://www.actasc.cn/hjkxxb/ch/reader/view_abstract.aspx?file_no=20121210001&flag=1 |
| [28] | ABALOS D, SANZ-COBENA A, MISSELBROOK T, et al. Effectiveness of urease inhibition on the abatement of ammonia, nitrous oxide and nitric oxide emissions in a non-irrigated Mediterranean barley field[J]. Chemosphere, 2012, 89(3):310-318 doi: 10.1016/j.chemosphere.2012.04.043 |
| [29] | 赵素芬, 汪开英.集约化养猪场NH3的排放及控制研究进展[J].农机化研究, 2004, (1):88-90 doi: 10.3969/j.issn.1003-188X.2004.01.030 ZHAO S F, WANG K Y. Study on reducing ammonia from the intensive swine[J]. Journal of Agricultural Mechanization Research, 2004, (1):88-90 doi: 10.3969/j.issn.1003-188X.2004.01.030 |
| [30] | SHRIVER J A, CARTER S D, SUTTON A L, et al. Effects of adding fiber sources to reduced-crude protein, amino acid-supplemented diets on nitrogen excretion, growth performance, and carcass traits of finishing pigs[J]. Journal of Animal Science, 2003, 81(2):492-502 doi: 10.2527/2003.812492x |
| [31] | 郭焱芳. 发酵床养殖模式对猪舍环境及猪肉品质的影响研究[D]. 长沙: 湖南农业大学, 2011 GUO Y F. Effects of deep litter system on pig housing environment and meat quality of pig[D]. Changsha: Hunan Agricultural University, 2011 |
| [32] | 高春亮, 魏后凯.中国城镇化趋势预测研究[J].当代经济科学, 2013, 35(4):85-90 doi: 10.3969/j.issn.1002-2848.2013.04.010 GAO C L, WEI H K. Prediction study on the urbanization trends of China[J]. Modern Economic Science, 2013, 35(4):85-90 doi: 10.3969/j.issn.1002-2848.2013.04.010 |
| [33] | 孟令国, 李超令, 胡广.基于PDE模型的中国人口结构预测研究[J].中国人口·资源与环境, 2014, 24(2):132-141 doi: 10.3969/j.issn.1002-2104.2014.02.019 MENG L G, LI C L, HU G. Predictions of China's population structure based on the PDE model[J]. China Population, Resources and Environment, 2014, 24(2):132-141 doi: 10.3969/j.issn.1002-2104.2014.02.019 |
| [34] | 程广燕, 刘珊珊, 杨祯妮, 等.中国肉类消费特征及2020年预测分析[J].中国农村经济, 2015, (2):76-82 http://www.wanfangdata.com.cn/details/detail.do?_type=perio&id=663880091 CHENG G Y, LIU S S, YANG Z N, et al. Characteristics of China's meat consumption and its forecast in 2020[J]. Chinese Rural Economy, 2015, (2):76-82 http://www.wanfangdata.com.cn/details/detail.do?_type=perio&id=663880091 |
| [35] | 白军飞, 闵师, 仇焕广, 等.人口老龄化对我国肉类消费的影响[J].中国软科学, 2014, (11):17-26 doi: 10.3969/j.issn.1002-9753.2014.11.003 BAI J F, MIN S, QIU H G, et al. Impact of population aging on China's meat consumption[J]. China Soft Science, 2014, (11):17-26 doi: 10.3969/j.issn.1002-9753.2014.11.003 |
| [36] | 胡浩, 郑微微, 虞祎.我国城乡居民畜产品及其制品消费需求的预测——兼以日本经验数据的修正[J].中国畜牧杂志, 2013, 49(16):35-41 doi: 10.3969/j.issn.0258-7033.2013.16.008 HU H, ZHENG W W, YU Y. Prediction of consumption demand of livestock products and its products in China's urban and rural residents-Also on the amendment of Japan's experience data[J]. Chinese Journal of Animal Science, 2013, 49(16):35-41 doi: 10.3969/j.issn.0258-7033.2013.16.008 |
| [37] | 张福锁. 我国主要作物氮肥施用状况及科学施肥策略[C]//2010第三届国际缓释肥料产业发展(汉枫)论坛论文集. 北京: 中国化工信息中心, 2010: 1-6 ZHANG F S. Application status of nitrogen fertilizers and scientific fertilization strategies for major crops in China[C]//2010 Third International Sustained Release Fertilizer Industry Development (Hanfeng) Forum Proceedings. Beijing: China National Chemical Information Center, 2010: 1-6 |
| [38] | 王玉倩.我国缓控释肥行业现状分析[J].化学工业, 2013, 31(6):34-36 doi: 10.3969/j.issn.1673-9647.2013.06.007 WANG Y Q. Analysis of slow/control release fertilizer in China[J]. Chemical Industry, 2013, 31(6):34-36 doi: 10.3969/j.issn.1673-9647.2013.06.007 |
| [39] | 中国营养学会.中国居民膳食指南[M].北京:人民卫生出版社, 2016 Chinese Nutrition Society. Dietary Guidelines for Chinese Residents[M]. Beijing:People's Health Press, 2016 |
| [40] | HRISTOV A N. Technical note:Contribution of ammonia emitted from livestock to atmospheric fine particulate matter (PM2.5) in the United States[J]. Journal of Dairy Science, 2011, 94(6):3130-3136 doi: 10.3168/jds.2010-3681 |
