韩美,
山东师范大学地理与环境学院 济南 250358
基金项目: 国家自然科学基金面上项目41371517
山东省科技攻关计划2013GSF11706
详细信息
作者简介:徐泽华, 研究方向为气候变化。E-mail:944571456@qq.com
通讯作者:韩美, 研究方向为资源与环境。E-mail:hanmei568568@126.com
中图分类号:P429计量
文章访问数:963
HTML全文浏览量:0
PDF下载量:1420
被引次数:0
出版历程
收稿日期:2017-11-09
录用日期:2018-04-20
刊出日期:2018-08-01
Spatio-temporal distribution characteristics of drought in Shandong Province and it relationship with ENSO
XU Zehua,HAN Mei,
School of Geography and Environment, Shandong Normal University, Jinan 250358, China
Funds: the National Natural Science Foundation of China41371517
Shandong Science and Technology Research Program2013GSF11706
More Information
Corresponding author:HAN Mei, E-mail:hanmei568568@126.com
摘要
HTML全文
图
参考文献
相关文章
施引文献
资源附件
访问统计
摘要
摘要:基于山东省15个气象台站1964—2010年的逐月降水和平均气温资料,采用标准化降水蒸散指数(SPEI)定量分析了山东省不同时间尺度干旱发生频率,利用Mann-Kendall非参数检验法和Arcgis软件,对近50年山东省干旱的时空变化趋势进行分析。为了研究厄尔尼诺/南方涛动(ENSO)对山东省干旱的影响,运用连续小波(CWT)、交叉小波变换(XWT)和小波相干谱(WTC)分析SPEI与ENSO指数(多变量ENSO指数,MEI)的相关关系和周期特征。结果表明:多时间尺度的SPEI值可以较好地反映山东省的干旱情况;不同时间尺度的SPEI值随时间变化的敏感性存在明显差异,时间尺度越小,变化幅度越大。近50年山东地区呈现明显的增暖趋势,其中东部增温最为显著,降水减少和温度升高使山东气候趋于"暖干化",加剧山东省干旱程度。空间变化趋势上,山东省年SPEI和山东省年降水的空间分布具有一致性,总体有西部变湿润、东部变干的趋势。在干旱发生时间尺度上,月尺度干旱发生频率高于年尺度干旱发生频率,四季中春、秋季干旱最为严重。春旱和秋旱以鲁西和鲁西北平原发生频率最高,各地区之间差异明显。ENSO暖事件时,山东易旱;ENSO冷事件时,干旱减少。SPEI存在1~2.5 a尺度的年际振荡周期特征,呈现了与MEI指数相似的变化特征。高能量区,SPEI和MEI存在5~6 a的共振周期,SPEI较MEI提前1~2个月;低能量区,SPEI与MEI存在3~3.8 a呈负相位的共振周期。
关键词:山东省/
SPEI/
干旱/
ENSO事件/
多变量ENSO指数/
小波分析
Abstract:Drought is the most devastating natural disaster in the world. In recent years, prolonged droughts with huge impacts had caused enormous economic losses in China. Shandong Province belongs to a semi-humid climate, with complex and diverse underlying surfaces and sparse surface vegetation that is sensitive to climate change. Due to uneven distribution of precipitation during the year, drought and flood disasters in Shandong Province have been frequent, with significant impact on agricultural production and socio-economic development. Given the above, it was pivotal to study the spatial and temporal changes in drought in Shandong Province for application in drought monitoring and water resources management. Based on monthly precipitation and average temperature data from 15 meteorological stations in Shandong Province from 1964-2010, the frequency of drought at different time-scales in Shandong Province was quantitatively analyzed using standardized precipitation evapotranspiration index (SPEI). Using the Mann-Kendall non-parametric test method and Arcgis platform, the trends in temporal and spatial variation of drought in Shandong Province in the recent 50 years were analyzed. In order to study the impact of El Ni?o/Southern Oscillation (ENSO) on drought in Shandong Province, the continuous wavelet (CWT), cross wavelet transform (XWT) and wavelet coherence spectrum (WTC) were used to analyze the correlation between SPEI and ENSO index with the periodic characteristics. The results showed that SPEI at multiple time-scales reflected drought condition in Shandong Province. The sensitivity of time-varying SPEI was obviously different. The smaller the time-scale was, the greater the variation range was. In the recent 50 years, Shandong Province had an obvious warming trend, which was most significant in the eastern part of the province. Decrease in precipitation and increase in temperature induced warm and dry climate in Shandong, which aggravated drought conditions in the province. The spatial distributions of SPEI and annual precipitation in Shandong Province were consistent with the trend in spatial change, and the trend in the west had become more humid and in the east more dry. On the time scale of drought occurrence, the frequency of monthly drought was higher than that of annually drought, with spring and autumn having the most severe droughts across the four seasons. The highest frequency of drought occurred in West Shandong and Northwest Shandong Plain, with distinctive difference among different regions. With ENSO warm events, Shandong became prone to drought and ENSO cold events reduced droughts conditions. The annual-inter-annual oscillation cycle characteristics of SPEI was 1.0-2.5 years, showing similarity with the characteristics of Multiple ENSO Index (MEI). In high energy sector, the resonance period was 5.0-6.0 years for SPEI and MEI, but 1-2 months ahead of MEI. In low energy sector, there was a negative phase resonance period for SPEI and MEI of 3.0-3.8 years. The study provided a quantitative basis for understanding the spatial and temporal changes in drought in Shandong Province under global climate change. It also was helpful to decision-makers by improving preparedness and adoption of appropriate policies for agricultural management.
Key words:Shandong Province/
SPEI/
Drought/
ENSO event/
Multiple ENSO index/
Wavelet analysis
HTML全文
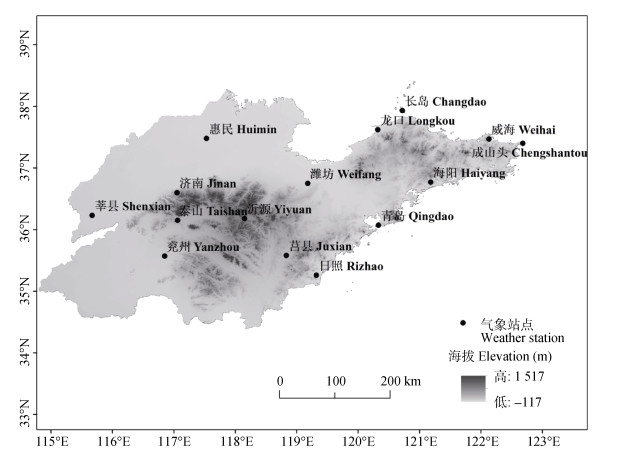
图1山东省气象站点分布图
Figure1.Distribution map of meteorological stations in Shandong Province
 下载: 全尺寸图片幻灯片
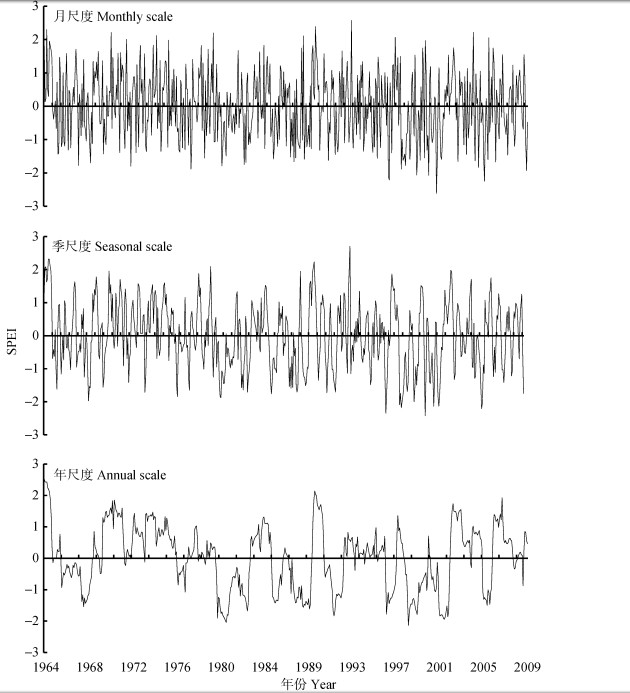
图21964—2010年山东多时间尺度标准化降水蒸散指数(SPEI)长期动态特征
Figure2.Long term dynamic characteristics of multi temporal scale standardized precipitation evapotranspiration index (SPEI) in Shandong from 1964 to 2010
下载: 全尺寸图片幻灯片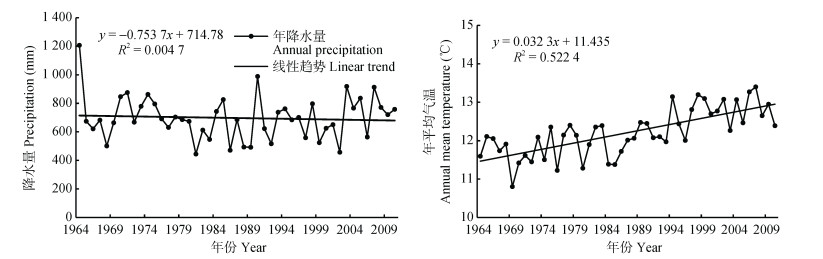
图31964—2010年山东省年降水量(a)和年平均气温(b)年际变化
Figure3.Interannual variations of annual precipitation (a) and annual mean temperature (b) in Shandong Province from 1964 to 2010
下载: 全尺寸图片幻灯片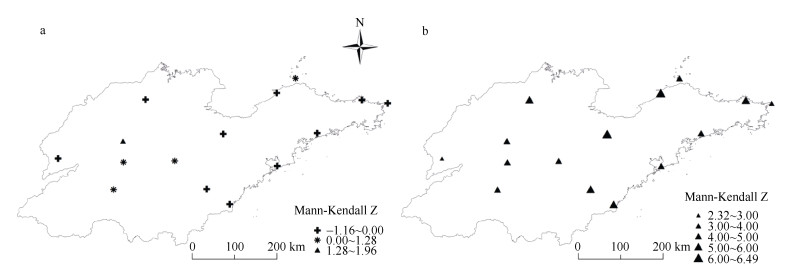
图41964—2010年山东省年降水(a)和气温(b)变化趋势空间分布特征
星号(加号)代表上升(下降)趋势不显著, 正三角代表上升; 形状大小表示通过了不同的显著性检验。
Figure4.Spatial distribution characteristics of annual precipitation (a) and air temperature (b) in Shandong Province from 1964 to 2010
Asterisks (plus) represents no significant increase (decline) trend. Positive triangle represents rise. Size of marks indicates significance level.
下载: 全尺寸图片幻灯片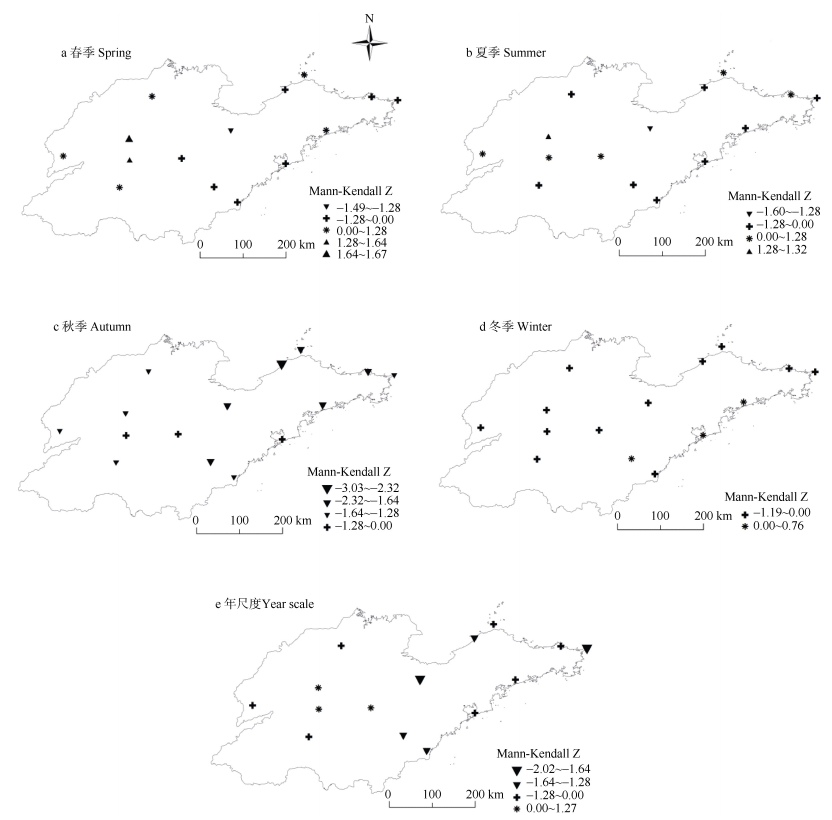
图5山东省1964—2010年四季和年的干旱指数变化趋势
星号(加号)代表上升(下降)趋势不显著; 正三角代表上升, 倒三角代表下降; 形状大小表示通过了不同的显著性检验。
Figure5.Variation trends of drought indexes in four seasons and years in Shandong Province from 1964 to 2010
Asterisks (plus) represents no significant increase (decline) trend. Positive triangle represents rise, and inverted triangle represents decline. Size of marks indicates significance level.
下载: 全尺寸图片幻灯片
图6山东省1964—2010年各尺度干旱发生频率
Figure6.Drought occurrence frequencies at different scales in different stations of Shandong Province from 1964 to 2010
下载: 全尺寸图片幻灯片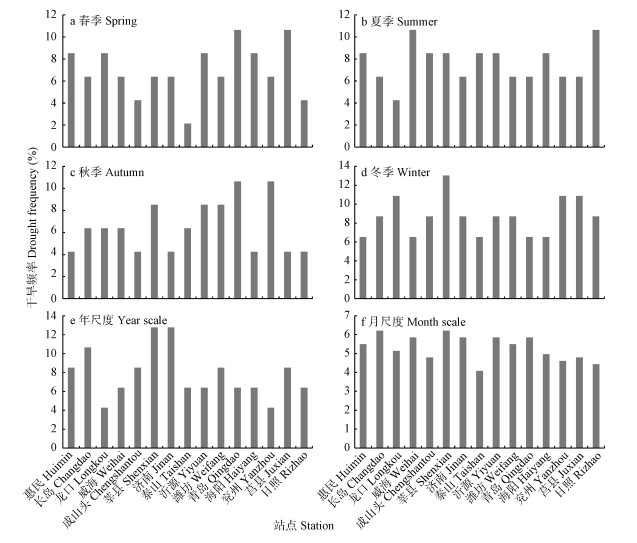
图7山东省1964—2010年各尺度重度及以上干旱发生频率
Figure7.Occurrence frequencies of severe drought at different scales in different stations of Shandong Province from 1964 to 2010
下载: 全尺寸图片幻灯片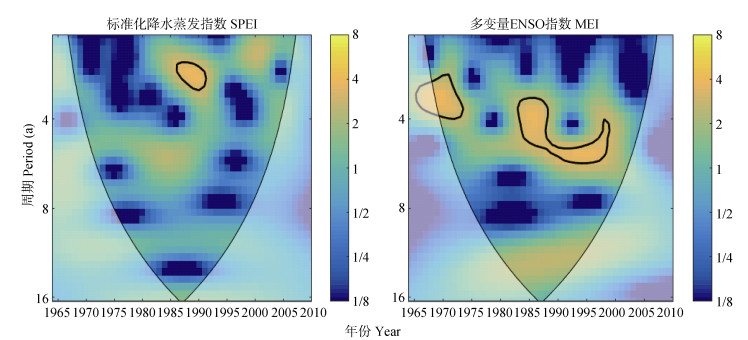
图81964—2010年山东省标准化降水蒸散指数(SPEI) (a)和多变量ENSO指数(b)连续小波变换
Figure8.Standardized precipitation evapotranspiration index (SPEI) (a) and Multivariate ENSO Index (MEI) (b) continuous wavelet transform in Shandong Province from 1964 to 2010
下载: 全尺寸图片幻灯片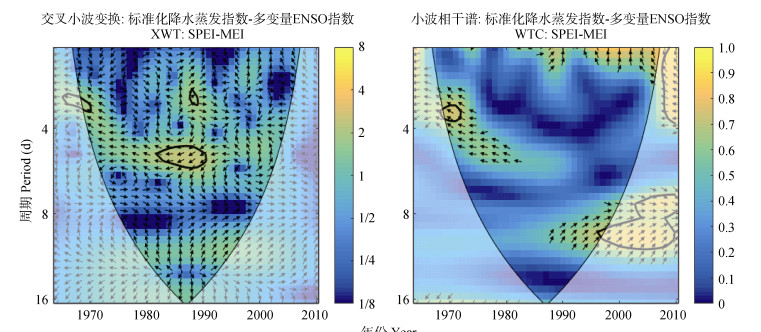
图91964—2010年山东省标准化降水蒸散指数(SPEI)与Multivariate ENSO Index的交叉小波(a)和相干小波(b)功率谱
Figure9.Cross wavelet (a) and coherent wavelet (b) power spectrum of standardized precipitation evapotranspiration index (SPEI) value and Multivariate ENSO Index (MEI) in Shandong Province from 1964 to 2010
下载: 全尺寸图片幻灯片表1SPEI值的干旱等级分类
Table1.Classification scales of meteorological drought for SPEI
| 干旱等级分类Drought level classification | SPEI值SPEI value |
| 正常Normal | -0.5 < SPEI |
| 轻度干旱Mild drought | -1.0 < SPEI≤0.5 |
| 中度干旱Moderate drought | -1.5 < SPEI≤-1.0 |
| 严重干旱Severe drought | -2.0 < SPEI≤-1.5 |
| 极端干旱Extreme drought | SPEI≤-2.0 |
下载: 导出CSV表21964—2010年ENSO冷暖事件及对应山东省标准化降水蒸散指数(SPEI)
Table2.ENSO warm and cold events and the corresponding standardized precipitation evapotranspiration index (SPEI) values of Shandong Province from 1964 to 2010
| ENSO | 起止时间(年-月) Time (year-month) | 历时 Duration (month) | SPEI | ENSO | 起止年月(年-月) Time (year-month) | 历时(月) Duration (month) | SPEI |
| ENSO暖事件 ENSOwarmevents | 1964-01—1964-02 | 2 | 0.93 | ENSO冷事件 ENSOcoldevents | 1964-05—1965-01 | 9 | 0.62 |
| 1965-06—1966-04 | 11 | -0.03 | 1967-12—1968-04 | 5 | -0.31 | ||
| 1968-11—1969-06 | 8 | 0.62 | 1970-07—1972-01 | 19 | 0.38 | ||
| 1969-08—1970-01 | 6 | -0.34 | 1973-06—1974-07 | 14 | 0.02 | ||
| 1972-05—1973-03 | 11 | 0.00 | 1974-10—1976-03 | 18 | 0.28 | ||
| 1976-09—1977-02 | 6 | -0.23 | 1984-10—1985-06 | 9 | 0.08 | ||
| 1977-09—1978-01 | 5 | -0.06 | 1988-05—1989-05 | 13 | -0.25 | ||
| 1979-10—1980-02 | 5 | -0.04 | 1995-08—1996-03 | 8 | -0.19 | ||
| 1982-04—1983-06 | 15 | -0.09 | 1998-07—2001-02 | 32 | -0.31 | ||
| 1986-09—1988-02 | 18 | 0.02 | 2007-08—2008-06 | 11 | 0.09 | ||
| 1991-06—1992-07 | 14 | -0.21 | 2010-07—2010-12 | 6 | -0.34 | ||
| 1994-10—1995-03 | 6 | 0.16 | |||||
| 1997-05—1998-05 | 13 | 0.16 | |||||
| 2002-06—2003-02 | 9 | -0.26 | |||||
| 2004-07—2005-04 | 10 | -0.09 | |||||
| 2006-09—2007-01 | 5 | -0.92 | |||||
| 2009-07—2010-04 | 10 | 0.25 |
下载: 导出CSV参考文献
| [1] | 王东, 张勃, 安美玲, 等.基于SPEI的西南地区近53a干旱时空特征分析[J].自然资源学报, 2014, 29(6):1003-1016 doi: 10.11849/zrzyxb.2014.06.009 WANG D, ZHANG B, AN M L, et al. Temporal and spatial distributions of drought in southwest China over the past 53 years based on standardized precipitation evapotranspiration index[J]. Journal of Natural Resources, 2014, 29(6):1003-1016 doi: 10.11849/zrzyxb.2014.06.009 |
| [2] | 马柱国, 符淙斌. 1951-2004年我国北方干旱化的基本事实[C]//全国旱情监测技术与抗旱减灾措施交流研讨会论文集. 青岛: 中国水利技术信息中心, 2009: 2429-2439 MA Z G, FU C B. The basic facts of drought in northern China from 1951 to 2004[C]//National Drought Monitoring Technology and Drought Mitigation Measures Papers. Qingdao:China Water Conservancy Technical Information Center, 2009:2429-2439 |
| [3] | 姜德娟, 李志, 王昆. 1961~2008年山东省极端降水事件的变化趋势分析[J].地理科学, 2011, 31(9):1118-1124 doi: 10.11820/dlkxjz.2011.09.006 JIANG D J, LI Z, WANG K. Trends of extreme precipitation events over Shandong Province from 1961 to 2008[J]. Scientia Geographica Sinica, 2011, 31(9):1118-1124 doi: 10.11820/dlkxjz.2011.09.006 |
| [4] | 王庆, 马倩倩, 夏艳玲, 等.最近50年来山东地区夏季降水的时空变化及其影响因素研究[J].地理科学, 2014, 34(2):220-228 doi: 10.13249/j.cnki.sgs.2014.08.1002 WANG Q, MA Q Q, XIA Y L, et al. Spatial-temporal variations and influential factors of summer precipitation in Shandong region during the last 50 years[J]. Scientia Geographica Sinica, 2014, 34(2):220-228 doi: 10.13249/j.cnki.sgs.2014.08.1002 |
| [5] | 张勃, 张耀宗, 任培贵, 等.基于SPEI法的陇东地区近50a干旱化时空特征分析[J].地理科学, 2015, 35(8):999-1006 http://www.cqvip.com/QK/95809X/201508/666148869.html ZHANG B, ZHANG Y Z, REN P G, et al. Analysis of drought spatial-temporal characteristics based on SPEI in eastern region of Gansu in recent 50 years[J]. Scientia Geographica Sinica, 2015, 35(8):999-1006 http://www.cqvip.com/QK/95809X/201508/666148869.html |
| [6] | 张玉静, 王春乙, 张继权.基于SPEI指数的华北冬麦区干旱时空分布特征分析[J].生态学报, 2015, 35(21):7097-7107 http://www.cqvip.com/QK/90772X/201521/666673879.html ZHANG Y J, WANG C Y, ZHANG J Q. Analysis of the spatial and temporal characteristics of drought in the North China Plain based on standardized precipitation evapotranspiration index[J]. Acta Ecologica Sinica, 2015, 35(21):7097-7107 http://www.cqvip.com/QK/90772X/201521/666673879.html |
| [7] | 翟禄新, 冯起.基于SPI的西北地区气候干湿变化[J].自然资源学报, 2011, 26(5):847-857 doi: 10.11849/zrzyxb.2011.05.012 ZHAI L X, FENG Q. Dryness/wetness climate variation based on standardized precipitation index in Northwest China[J]. Journal of Natural Resources, 2011, 26(5):847-857 doi: 10.11849/zrzyxb.2011.05.012 |
| [8] | 周丹, 张勃, 任培贵, 等.基于标准化降水蒸散指数的陕西省近50a干旱特征分析[J].自然资源学报, 2014, 29(4):677-688 doi: 10.11849/zrzyxb.2014.04.012 ZHOU D, ZHANG B, REN P G, et al. Analysis of drought characteristics of Shaanxi Province in recent 50 years based on standardized precipitation evapotranspiration index[J]. Journal of Natural Resources, 2014, 29(4):677-688 doi: 10.11849/zrzyxb.2014.04.012 |
| [9] | VICENTE-SERRANO S M, BEGUERíA S, LóPEZ-MORENO J I. A multiscalar drought index sensitive to global warming:The standardized precipitation evapotranspiration index[J]. Journal of Climate, 2010, 23(7):1696-1718 doi: 10.1175/2009JCLI2909.1 |
| [10] | 李伟光, 易雪, 侯美亭, 等.基于标准化降水蒸散指数的中国干旱趋势研究[J].中国生态农业学报, 2012, 20(5):643-649 http://www.ecoagri.ac.cn/zgstny/ch/reader/view_abstract.aspx?file_no=2012520&flag=1 LI W G, YI X, HOU M T, et al. Standardized precipitation evapotranspiration index shows drought trends in China[J]. Chinese Journal of Eco-Agriculture, 2012, 20(5):643-649 http://www.ecoagri.ac.cn/zgstny/ch/reader/view_abstract.aspx?file_no=2012520&flag=1 |
| [11] | 沈国强, 郑海峰, 雷振锋.基于SPEI指数的1961-2014年东北地区气象干旱时空特征研究[J].生态学报, 2017, 37(17):5882-5893 https://www.cnki.com.cn/qikan-GHZH201606012.html SHEN G Q, ZHENG H F, LEI Z F. Spatiotemporal analysis of meteorological drought (1961-2014) in Northeast China using a standardized precipitation evapotranspiration index[J]. Acta Ecologica Sinica, 2017, 37(17):5882-5893 https://www.cnki.com.cn/qikan-GHZH201606012.html |
| [12] | 许玲燕, 王慧敏, 段琪彩, 等.基于SPEI的云南省夏玉米生长季干旱时空特征分析[J].资源科学, 2013, 35(5):1024-1034 http://www.oalib.com/paper/4413872 XU L Y, WANG H M, DUAN Q C, et al. The temporal and spatial distribution of droughts during summer corn growth in Yunnan Province based on SPEI[J]. Resources Science, 2013, 35(5):1024-1034 http://www.oalib.com/paper/4413872 |
| [13] | 史本林, 朱新玉, 胡云川, 等.基于SPEI指数的近53年河南省干旱时空变化特征[J].地理研究, 2015, 34(8):1547-1558 http://www.cqvip.com/QK/95732X/201508/665811456.html SHI B L, ZHU X Y, HU Y C, et al. Spatial and temporal variations of drought in Henan Province over a 53-year period based on standardized precipitation evapotranspiration index[J]. Geographical Research, 2015, 34(8):1547-1558 http://www.cqvip.com/QK/95732X/201508/665811456.html |
| [14] | 苏宏新, 李广起.基于SPEI的北京低频干旱与气候指数关系[J].生态学报, 2012, 32(17):5467-5475 http://www.cnki.com.cn/Article/CJFDTotal-STXB201217020.htm SU H X, LI G Q. Low-frequency drought variability based on SPEI in association with climate indices in Beijing[J]. Acta Ecologica Sinica, 2012, 32(17):5467-5475 http://www.cnki.com.cn/Article/CJFDTotal-STXB201217020.htm |
| [15] | 张强, 邹旭恺, 肖风劲. GB/T20481-2006气象干旱等级[S]. 北京: 中国标准出版社, 2006 ZHANG Q, ZHOU X K, XIAO F J. GB/T20481-2006 Classification of Meteorological Drought Category[S]. Beijing:China Standard Press, 2006 |
| [16] | 张调风, 张勃, 王小敏, 等.基于综合气象干旱指数(CI)的干旱时空动态格局分析——以甘肃省黄土高原区为例[J].生态环境学报, 2012, 21(1):13-20 http://www.wanfangdata.com.cn/details/detail.do?_type=perio&id=tryhj201201003 ZHANG T F, ZHANG B, WANG X M, et al. Temporal and spatial analysis of drought for recent 50 years in Loess Plateau of Gansu Province based on meteorological drought composite index[J]. Ecology and Environmental Sciences, 2012, 21(1):13-20 http://www.wanfangdata.com.cn/details/detail.do?_type=perio&id=tryhj201201003 |
| [17] | 秦年秀, 姜彤, 许崇育.长江流域径流趋势变化及突变分析[J].长江流域资源与环境, 2005, 14(5):589-594 http://www.cnki.com.cn/Article/CJFDTotal-QHBH200502004.htm QIN N X, JIANG T, XU C Y. Trends and abruption analysis on the discharge in the Yangtze Basin[J]. Resources and Environment in the Yangtze Basin, 2005, 14(5):589-594 http://www.cnki.com.cn/Article/CJFDTotal-QHBH200502004.htm |
| [18] | 张岳军, 郝智文, 王雁, 等.基于SPEI和SPI指数的太原多尺度干旱特征与气候指数的关系[J].生态环境学报, 2014, 23(9):1418-1424 http://www.cqvip.com/QK/97636C/201409/662761755.html ZHANG Y J, HAO Z W, WANG Y, et al. Multiscale characteristics of drought based on SPEI and SPI in association with climate index in Taiyuan[J]. Ecology and Environmental Sciences, 2014, 23(9):1418-1424 http://www.cqvip.com/QK/97636C/201409/662761755.html |
| [19] | 温克刚, 王建国, 孙典卿.中国气象灾害大典.山东卷[M].北京:气象出版社, 2006 WEN K G, WANG J G, SUN D Q. China Meteorological Disaster Ceremony (Shandong Coils)[M]. Beijing:Meteorology Publish House, 2006 |
| [20] | 山东省水利厅. 2002年山东省水资源公报[EB/OL]. (2004-05-12). http://www.sdwr.gov.cn/zwgk/ggsjkf/sjkfml/szygb/ Department of Water Resources of Shandong. Shandong water resources bulletin 2002[EB/OL]. (2004-05-12). http://www.sdwr.gov.cn/zwgk/ggsjkf/sjkfml/szygb/ |
| [21] | IPCC. Climate Change 2007:The Physical Science Basis, Summary for Policy Makers[R]. Paris:IPCC, 2007 |
| [22] | 赵永平, 陈永利.一百多年来ENSO事件分类和ENSO循环研究[J].海洋湖沼通报, 1998, (3):7-12 https://www.wenkuxiazai.com/doc/b3891f4210661ed9ac51f319.html ZHAO Y P, CHEN Y L. The classification of ENSO events over recent one hundred plus years[J]. Transactions of Oceanology and Limnology, 1998, (3):7-12 https://www.wenkuxiazai.com/doc/b3891f4210661ed9ac51f319.html |
| [23] | D'ODORICO P, YOO J C, OVER T M. An assessment of ENSO-induced patterns of rainfall erosivity in the Southwestern United States[J]. Journal of Climate, 2000, 14(21):4230-4242 |
| [24] | 王亚敏, 张勃, 郭玲霞, 等.地磁Ap指数与太阳黑子数的交叉小波分析及R/S分析[J].地理科学, 2011, 31(6):747-752 http://kns.cnki.net/KCMS/detail/detail.aspx?filename=dlkx201106018&dbname=CJFD&dbcode=CJFQ WANG Y M, ZHANG B, GUO L X, et al. Cross wavelet analysis and R/S analysis of relationship between geomagnetic Ap index and sunspot number[J]. Scientia Geographica Sinca, 2011, 31(6):747-752 http://kns.cnki.net/KCMS/detail/detail.aspx?filename=dlkx201106018&dbname=CJFD&dbcode=CJFQ |
| [25] | 赵一飞, 邹欣庆, 张勃, 等.黄土高原甘肃区降水变化与气候指数关系[J].地理科学, 2015, 35(10):1325-1332 http://www.cqvip.com/QK/97197X/2004002/9219955.html ZHAO Y F, ZOU X Q, ZHANG B, et al. Precipitation variation in association with climate indices in Loess Plateau of Gansu Province, Northwest China[J]. Scientia Geographica Sinca, 2015, 35(10):1325-1332 http://www.cqvip.com/QK/97197X/2004002/9219955.html |
| [26] | 廉丽姝, 李为华, 朱平盛.山东省近40年气候变化特征[J].气象科技, 2006, 34(1):57-61 http://www.cqvip.com/QK/94270B/2007015/25132406.html LIAN L S, LI W H, ZHU P S. Analysis of climate change in Shandong Province since 1961[J]. Meteorological Science and Technology, 2006, 34(1):57-61 http://www.cqvip.com/QK/94270B/2007015/25132406.html |
| [27] | 王海军, 张勃, 赵传燕, 等.中国北方近57年气温时空变化特征[J].地理科学进展, 2009, 28(4):643-650 doi: 10.11821/xb20037s001 WANG H J, ZHANG B, ZHAO C Y, et al. The Spatio-temporal characteristics of temperature change in recent 57 years in northern China[J]. Progress in Geography, 2009, 28(4):643-650 doi: 10.11821/xb20037s001 |
| [28] | 李芬, 张建新, 郝智文, 等.山西降水与ENSO的相关性研究[J].地理学报, 2015, 70(3):420-430 http://www.cqvip.com/QK/90059X/201503/664330607.html LI F, ZHANG J X, HAO Z W, et al. Correlation analysis of rainfall and ENSO in Shanxi[J]. Acta Geographica Sinica, 2015, 70(3):420-430 http://www.cqvip.com/QK/90059X/201503/664330607.html |
| [29] | 卢爱刚, 葛剑平, 庞德谦, 等. 40a来中国旱灾对ENSO事件的区域差异响应研究[J].冰川冻土, 2006, 28(4):535-542 http://www.wanfangdata.com.cn/details/detail.do?_type=perio&id=bcdt200604012 LU A G, GE J P, PANG D Q, et al. Asynchronous response of droughts to ENSO in China[J]. Journal of Glaciology and Geocryology, 2006, 28(4):535-542 http://www.wanfangdata.com.cn/details/detail.do?_type=perio&id=bcdt200604012 |
| [30] | 陈世发. ENSO对韶关市1951-2013年降雨侵蚀力影响研究[J].地理科学, 2016, 36(10):1573-1580 http://kns.cnki.net/KCMS/detail/detail.aspx?filename=dlkx201610015&dbname=CJFD&dbcode=CJFQ CHEN S F. Impact of ENSO on rainfall erosivity in Shaoguan City during 1951-2013[J]. Scientia Geographica Sinica, 2016, 36(10):1573-1580 http://kns.cnki.net/KCMS/detail/detail.aspx?filename=dlkx201610015&dbname=CJFD&dbcode=CJFQ |
