秦帅1,
郝晋珉2
1.郑州轻工业学院经济与管理学院 郑州 450002
2.中国农业大学资源与环境学院 北京 100193
基金项目: 国家自然科学基金项目U1504707
国家自然科学基金项目41501189
教育部人文社会科学研究青年基金项目14YJCZH004
河南省高校科技创新人才支持计划(人文社科类)2017-cx-028
河南省高等学校青年骨干教师培养计划2017GGJS098
详细信息
作者简介:曹志宏, 主要研究方向为资源管理和农村经济。E-mail:caozhihongczh@163.com
中图分类号:S-3计量
文章访问数:757
HTML全文浏览量:2
PDF下载量:690
被引次数:0
出版历程
收稿日期:2017-11-15
录用日期:2018-05-31
刊出日期:2018-09-01
Spatio-temporal evolution and agglomeration characteristics of agricultural production carbon sink in Henan Province
CAO Zhihong1,,,QIN Shuai1,
HAO Jinmin2
1. College of Economic and Management, Zhengzhou Light Industry University, Zhengzhou 450002, China
2. College of Resources & Environment, China Agricultural University, Beijing 100193, China
Funds: the National Natural Science Foundation of ChinaU1504707
the National Natural Science Foundation of China41501189
the Youth Foundation for Humanities and Social Science Research of Ministry of Education, China14YJCZH004
the Program for Science and Technology Innovation Talents in Universities of Henan Province2017-cx-028
the Program for Training Young Excellent Teachers in University of Henan Province2017GGJS098
More Information
Corresponding author:CAO Zhihong, E-mail: caozhihongczh@163.com
摘要
HTML全文
图
参考文献
相关文章
施引文献
资源附件
访问统计
摘要
摘要:农业生产具有碳排放和碳吸收的双重属性,针对当前农业生产碳汇研究系统边界模糊不清、中观尺度研究成果少、核算项目缺失统一性和完整性等问题,本文在全面核算2000-2015年河南省传统农业碳排放和碳吸收的基础上,分析了该省农业生产碳汇的演变趋势,并利用基尼系数和洛伦兹曲线研究其空间集聚特征。研究结果表明,河南省农业生产系统表现碳汇特征,其碳汇量整体呈现逐渐增长趋势,至2015年全省农业生产碳汇量为3 235.11万t,相当于当年能源消费碳排放量的22.53%,因此农业生产对于减缓温室效应等方面具有一定的作用。河南省农业生产碳汇量增长的主要原因在于随着农业现代化的不断推进和农业生产能力的不断提高,其农业生产碳吸收能力快于碳排放增长速度。自然因素是河南省农业碳排放的主要方面,至2015年自然因素产生的碳排放占河南省农业生产碳排放总量的70.15%;而人工农资投入碳排放增长率相对较快,是全省碳排放量增长的主要原因,2000-2015年全省人工农资投入碳排放量年均增长率为3.27%,是其自然因素碳排放年均增长率的3.85倍。河南省各地农业生产碳汇在地域空间上表现增长的普遍性、相对稳定性和较显著集聚性特征,呈现显著的南北和东西差异,东部和北部农业地区碳汇数值相对较高,而南部和西部农业碳汇数值对较低。
关键词:农业生产/
碳吸收/
碳排放/
碳汇/
集聚特征/
基层系数/
洛伦兹曲线
Abstract:There are carbon emission and carbon absorption in agricultural production. Research on carbon sinks in agricultural production lacks clear system boundary, less medium scale researches and uniformity and integrity in accounting. To solve the above problems, this study analyzed the evolution trend and agglomeration characteristics using the Gene's coefficient and Lorenz curve methods through determining carbon sinks in agricultural production in Henan Province. The main results showed that agricultural production systems in Henan Province generally had carbon sink characteristic, and its carbon sequestration had been increased from 2000 to 2015. Carbon sinks in agricultural production in Henan Province amounted to 3.24×10⁷ tons in 2015, which was 22.53% of carbon emission driven by energy consumption in the province. Therefore, agricultural production had a positive ecological effect on decreasing greenhouse gas. There was gradual increase in the carbon sink due to agricultural production for the period from 2000 to 2015 as carbon absorption increased much faster than carbon emission with increasing agricultural modernization and agricultural production capacity. As far as structure was concerned, agricultural production was the main aspect of the natural function of carbon emission in Henan Province, was 70.15% of total carbon emission in agricultural production in 2015. Carbon emission via artificial agricultural input increased relatively faster than the natural function of carbon emission, which was the main reason for the increase in carbon emission via agricultural production in the province. The annual growth rates of carbon emission due to artificial agricultural input were respectively 0.85% and 3.27% in 2000 and 2015, which was 3.85 times that of the natural factors of carbon emission. The spatial distribution of carbon sink due to agriculture production in Henan Province showed universality, relative stability and significant agglomeration, with significant differences between the north and south and then east and west. The values of carbon sinks for agricultural production in the eastern and northern regions were relatively high, while those for southern and western regions were relatively low.
Key words:Agricultural production/
Carbon absorption/
Carbon emission/
Carbon sink/
Agglomeration characteristics/
Gene's coefficient/
Lorenz curve
HTML全文
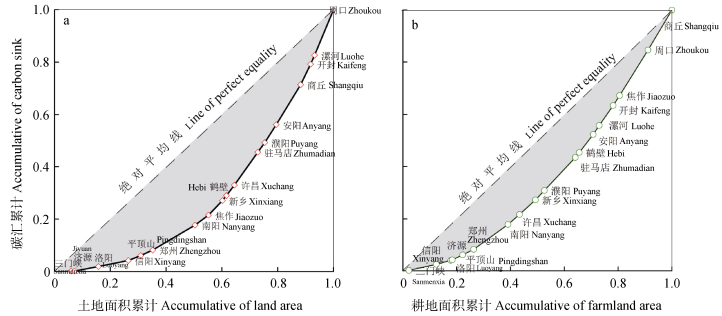
图12008—2015年河南省农业生产年均碳汇均值地域空间分布的洛伦兹曲线图
Figure1.Lorenz curve diagrams of spatial distribution of annual agricultural production carbon sink mean of Henan Province from 2008 to 2015
 下载: 全尺寸图片幻灯片
表1主要农作物经济系数(αj) [13]、干重比(βj)[14]及碳吸收率(γj)[15]取值
Table1.Economic coefficients (αj) [13], dry weight ratios (βj) [14] and carbon absorption rates (γj)[15] of main crops
| 作物Crop | αj | βj | γj |
| 水稻Rice | 0.49 | 0.86 | 0.41 |
| 小麦Wheat | 0.43 | 0.87 | 0.49 |
| 玉米Corn | 0.44 | 0.86 | 0.47 |
| 豆类Beans | 0.39 | 0.82 | 0.45 |
| 薯类Tubers | 0.67 | 0.55 | 0.42 |
| 其他粮食作物Others grain crops | 0.39 | 0.83 | 0.45 |
| 向日葵Sunflower | 0.30 | 0.90 | 0.45 |
| 油菜Oilseed rape | 0.27 | 0.82 | 0.45 |
| 花生Peanut | 0.43 | 0.90 | 0.45 |
| 棉花Cotton | 0.10 | 0.92 | 0.45 |
| 麻类Fiber crops | 0.83 | 0.83 | 0.45 |
| 烟草Tobacco | 0.83 | 0.83 | 0.45 |
| 蔬菜Vegetables | 0.83 | 0.15 | 0.45 |
| 瓜果Fruits | 0.70 | 0.90 | 0.45 |
下载: 导出CSV表2各类农资投入碳排放系数取值及其来源
Table2.Carbon emission coefficients and sources of various agricultural inputs
| 投入Input | 系数Coefficient | 单位Unit |
| 氮肥Nitrogenous fertilizer | 2.12[18] | kg(C)?kg-1 |
| 磷肥Phosphate fertilizer | 0.64[18] | kg(C)?kg-1 |
| 钾肥Potash fertilizer | 0.18[18] | kg(C)?kg-1 |
| 农药Pesticide | 4.93[15] | kg(C)?kg-1 |
| 农膜Agricultural film | 5.18[15] | kg(C)?kg–1 |
| 柴油Diesel fuel | 0.59[13] | kg(C)?kg–1 |
| 灌溉Irrigated area | 266.48[11] | kg(C)?hm–2 |
| 翻耕Tillage | 312.60[8] | kg(C)?hm-2 |
下载: 导出CSV表32000—2015奇数年河南省农业生产碳吸收和碳排放核算表
Table3.Agricultural production carbon sink revenues and expenditures in Henan Province in odd years from 2000 to 2015
| 项目Item | 2001 | 2003 | 2005 | 2007 | 2009 | 2011 | 2013 | 2015 | ||
| 碳排放 C emission (104 t) | 自然排放 Natural emission | 稻田CH4 Paddy CH4 | 25.31 | 30.61 | 31.10 | 36.51 | 37.20 | 38.82 | 39.53 | 39.92 |
| 土壤碳呼吸Soil respiration | 2 947.39 | 3 083.97 | 3 134.23 | 3 194.48 | 3 222.11 | 3 242.93 | 3 272.98 | 3 283.54 | ||
| 土壤硝化Soil nitrification | 82.79 | 85.85 | 88.09 | 89.67 | 90.22 | 90.63 | 90.98 | 91.17 | ||
| 小计Subtotal | 3 055.48 | 3 200.43 | 3 253.42 | 3 320.66 | 3 349.52 | 3 372.38 | 3 403.50 | 3 414.62 | ||
| 人工农资投入 Artificial agricultural input | 氮肥Nitrogenous fertilizer | 446.65 | 456.65 | 480.70 | 505.65 | 506.54 | 519.01 | 510.91 | 505.00 | |
| 磷肥Phosphate fertilizer | 64.63 | 66.01 | 67.49 | 69.83 | 74.14 | 76.92 | 76.17 | 74.75 | ||
| 钾肥Potash fertilizer | 7.25 | 7.80 | 9.14 | 10.03 | 10.77 | 11.42 | 11.56 | 11.45 | ||
| 农膜Agricultural film | 48.74 | 51.18 | 56.15 | 65.58 | 73.25 | 78.54 | 84.68 | 83.92 | ||
| 柴油Diesel fuel | 49.50 | 50.13 | 53.22 | 57.15 | 61.74 | 65.83 | 68.72 | 67.98 | ||
| 农药Pesticide | 48.58 | 48.69 | 51.84 | 58.22 | 59.90 | 63.53 | 64.08 | 63.53 | ||
| 灌溉Irrigated | 127.00 | 127.70 | 129.62 | 132.06 | 134.12 | 137.25 | 135.93 | 138.85 | ||
| 翻耕Tillage | 410.37 | 427.77 | 435.22 | 440.39 | 442.79 | 445.28 | 449.49 | 450.26 | ||
| 小计Subtotal | 1 202.73 | 1 235.93 | 1 283.38 | 1 338.91 | 1 363.24 | 1 397.77 | 1 401.55 | 1 395.73 | ||
| 碳吸收C absorption (104 t) | 农产品Agriculture products | 3 632.28 | 3 399.90 | 4 483.98 | 4 912.66 | 5 036.32 | 5 236.61 | 5 504.29 | 5 768.82 | |
| 秸秆Crop straw | 1 904.77 | 1 357.29 | 1 804.38 | 2 227.94 | 2 223.51 | 2 173.00 | 2 173.90 | 2 276.64 | ||
| 小计Subtotal | 5 537.05 | 4 757.19 | 6 288.36 | 7 140.61 | 7 259.82 | 7 409.61 | 7 688.09 | 8 045.46 | ||
| 碳汇合计Total carbon sink (104t) | 1 278.83 | 320.82 | 1 751.56 | 2 481.03 | 2 547.06 | 2 639.46 | 2 883.04 | 3 235.11 | ||
| 碳密度Carbon density (t?hm-2) | 1.85 | 0.45 | 2.43 | 3.44 | 3.11 | 3.23 | 3.55 | 3.99 | ||
下载: 导出CSV表42000—2007年和2008—2015年河南省农业生产碳汇核算均值
Table4.Agricultural production carbon sink means in Henan Province during 2000-2007 and 2008-2015
| 市 City | 2000—2007 | 市 City | 2008—2015 | |||||||
| 碳吸收 Carbon absorption (104 t) | 碳排放 Carbon emission (104 t) | 碳汇 Carbon sink | 碳吸收 Carbon absorption (104 t) | 碳排放 Carbon emission (104 t) | 碳汇 Carbon sink | |||||
| 总量Gross (104 t) | 密度Density (t?hm-2) | 总量Gross (104 t) | 密度Density (t?hm-2) | |||||||
| 信阳Xinyang | 418.87 | 470.36 | -51.49 | -0.71 | 三门峡Sanmenxia | 76.61 | 73.61 | 2.99 | 0.17 | |
| 三门峡Sanmenxia | 61.18 | 72.76 | -11.58 | -0.64 | 信阳Xinyang | 630.53 | 555.48 | 75.05 | 0.91 | |
| 洛阳Luoyang | 210.32 | 192.24 | 18.08 | 0.42 | 洛阳Luoyang | 256.16 | 208.19 | 47.97 | 1.12 | |
| 平顶山Pingdingshan | 187.02 | 170.28 | 16.75 | 0.50 | 济源Jiyuan | 24.12 | 18.69 | 5.43 | 1.22 | |
| 济源Jiyuan | 21.38 | 18.46 | 2.93 | 0.72 | 平顶山Pingdingshan | 234.23 | 178.39 | 55.84 | 1.76 | |
| 郑州Zhengzhou | 205.02 | 166.07 | 38.94 | 1.16 | 郑州Zhengzhou | 220.85 | 157.64 | 63.21 | 1.94 | |
| 南阳Nanyang | 697.47 | 564.57 | 132.90 | 1.30 | 南阳Nanyang | 890.51 | 594.83 | 295.68 | 2.87 | |
| 驻马店Zhumadian | 618.11 | 475.81 | 142.29 | 1.55 | 许昌Xuchang | 307.77 | 186.59 | 121.18 | 3.58 | |
| 新乡Xinxiang | 352.20 | 254.98 | 97.22 | 2.16 | 新乡Xinxiang | 452.04 | 283.02 | 169.02 | 3.63 | |
| 濮阳Puyang | 238.39 | 166.81 | 71.58 | 2.59 | 濮阳Puyang | 293.67 | 180.87 | 112.80 | 4.06 | |
| 许昌Xuchang | 271.31 | 174.53 | 96.78 | 2.74 | 驻马店Zhumadian | 878.93 | 493.58 | 385.36 | 4.16 | |
| 安阳Anyang | 347.69 | 216.86 | 130.84 | 3.10 | 鹤壁Hebi | 121.34 | 62.13 | 59.21 | 5.13 | |
| 周口Zhoukou | 807.36 | 520.65 | 286.71 | 3.24 | 安阳Anyang | 459.11 | 245.94 | 213.17 | 5.24 | |
| 开封Kaifeng | 388.57 | 235.84 | 152.74 | 3.53 | 漯河Luohe | 216.91 | 113.71 | 103.19 | 5.47 | |
| 鹤壁Hebi | 97.02 | 58.44 | 38.58 | 3.54 | 开封Kaifeng | 486.30 | 248.63 | 237.67 | 5.70 | |
| 商丘Shangqiu | 699.91 | 411.03 | 288.88 | 3.95 | 焦作Jiaozuo | 234.89 | 116.71 | 118.18 | 6.11 | |
| 焦作Jiaozuo | 194.15 | 111.30 | 82.85 | 4.18 | 周口Zhoukou | 1 072.86 | 537.38 | 535.47 | 6.29 | |
| 漯河Luohe | 196.27 | 115.14 | 81.14 | 4.27 | 商丘Shangqiu | 909.19 | 440.98 | 468.22 | 6.62 | |
| 负号表示碳源Minus means carbon source. | ||||||||||
下载: 导出CSV参考文献
| [1] | 原家范. 我国农业技术与碳排放相关性研究[D]. 哈尔滨: 哈尔滨工业大学, 2016 YUAN J F. Agricultural technology and carbon emissions correlation studies in China[D]. Harbin: Harbin Institute of Technology, 2016 |
| [2] | 高鸣, 宋洪远.中国农业碳排放绩效的空间收敛与分异——基于Malmquist-luenberger指数与空间计量的实证分析[J].经济地理, 2015, 35(4):142-148 http://www.wanfangdata.com.cn/details/detail.do?_type=perio&id=jjdl201504020 GAO M, SONG H Y. Dynamic changes and spatial agglomeration analysis of the Chinese agricultural carbon emissions performance[J]. Economic Geography, 2015, 35(4):142-148 http://www.wanfangdata.com.cn/details/detail.do?_type=perio&id=jjdl201504020 |
| [3] | 谢高地, 肖玉.农田生态系统服务及其价值的研究进展[J].中国生态农业学报, 2013, 21(6):645-651 http://www.ecoagri.ac.cn/zgstny/ch/reader/view_abstract.aspx?file_no=2013601&flag=1 XIE G D, XIAO Y. Review of agro-ecosystem services and their values[J]. Chinese Journal of Eco-Agriculture, 2013, 21(6):645-651 http://www.ecoagri.ac.cn/zgstny/ch/reader/view_abstract.aspx?file_no=2013601&flag=1 |
| [4] | 尹钰莹, 郝晋珉, 牛灵安, 等.河北省曲周县农田生态系统碳循环及碳效率研究[J].资源科学, 2016, 38(5):918-928 http://d.old.wanfangdata.com.cn/Periodical/zykx201605011 YIN Y Y, HAO J M, NIU L A, et al. Carbon cycle and carbon efficiency of farmland ecosystems in Quzhou, Hebei Province[J]. Resources Science, 2016, 38(5):918-928 http://d.old.wanfangdata.com.cn/Periodical/zykx201605011 |
| [5] | ACIL Tasman Pty Ltd. Agriculture and GHG Mitigation Policy:Options in Addition to the CPRS[M]. New South Wales:Industry & Investment NSW, 2009 |
| [6] | XIONG C H, YANG D G, HUO J W, et al. The relationship between agricultural carbon emissions and agricultural economic growth and policy recommendations of a low-carbon agriculture economy[J]. Polish Journal of Environmental Studies, 2016, 25(5):2187-2195 doi: 10.15244/pjoes/63038 |
| [7] | DYER J A, DESJARDINS R L. A review and evaluation of fossil energy and carbon dioxide emissions in Canadian agriculture[J]. Journal of Sustainable Agriculture, 2009, 33(2):210-228 doi: 10.1080/10440040802660137 |
| [8] | 田云, 张俊飚.中国农业生产净碳效应分异研究[J].自然资源学报, 2013, 28(8):1298-1309 http://xueshu.baidu.com/s?wd=paperuri%3A%28897c0823e7ae1389eebea4a6f0dbcefa%29&filter=sc_long_sign&tn=SE_xueshusource_2kduw22v&sc_vurl=http%3A%2F%2Fkns.cnki.net%2FKCMS%2Fdetail%2Fdetail.aspx%3Ffilename%3DZRZX201308004%26dbname%3DCJFD%26dbcode%3DCJFQ&ie=utf-8&sc_us=17216448211281431892 TIAN Y, ZHANG J B. Regional differentiation research on net carbon effect of agricultural production in China[J]. Journal of Natural Resources, 2013, 28(8):1298-1309 http://xueshu.baidu.com/s?wd=paperuri%3A%28897c0823e7ae1389eebea4a6f0dbcefa%29&filter=sc_long_sign&tn=SE_xueshusource_2kduw22v&sc_vurl=http%3A%2F%2Fkns.cnki.net%2FKCMS%2Fdetail%2Fdetail.aspx%3Ffilename%3DZRZX201308004%26dbname%3DCJFD%26dbcode%3DCJFQ&ie=utf-8&sc_us=17216448211281431892 |
| [9] | 程琳琳, 张俊飚, 田云, 等.中国省域农业碳生产率的空间分异特征及依赖效应[J].资源科学, 2016, 38(2):276-289 http://d.old.wanfangdata.com.cn/Periodical/zykx201602010 CHENG L L, ZHANG J B, TIAN Y, et al. The spatial variation characteristics and dependency of agricultural carbon productivity in China[J]. Resources Science, 2016, 38(2):276-289 http://d.old.wanfangdata.com.cn/Periodical/zykx201602010 |
| [10] | 戴小文, 何艳秋, 钟秋波.中国农业能源消耗碳排放变化驱动因素及其贡献研究——基于Kaya恒等扩展与LMDI指数分解方法[J].中国生态农业学报, 2015, 23(11):1445-1454 http://www.ecoagri.ac.cn/zgstny/ch/reader/view_abstract.aspx?file_no=20151112&flag=1 DAI X W, HE Y Q, ZHONG Q B. Driving factors and their contributions to agricultural CO2 emission due to energy consumption in China:Based on an expended Kaya identity and LMDI decomposition method[J]. Chinese Journal of Eco-Agriculture, 2015, 23(11):1445-1454 http://www.ecoagri.ac.cn/zgstny/ch/reader/view_abstract.aspx?file_no=20151112&flag=1 |
| [11] | 李波, 张俊飚, 李海鹏.中国农业碳排放时空特征及影响因素分解[J].中国人口·资源与环境, 2011, 21(8):80-86 doi: 10.3969/j.issn.1002-2104.2011.08.013 LI B, ZHANG J B, LI H P. Research on spatial-temporal characteristics and affecting factors decomposition of agricultural carbon emission in China[J]. China Population Resources and Environment, 2011, 21(8):80-86 doi: 10.3969/j.issn.1002-2104.2011.08.013 |
| [12] | 陈罗烨, 薛领, 雪燕.中国农业净碳汇时空演化特征分析[J].自然资源学报, 2016, 31(4):596-607 http://xueshu.baidu.com/s?wd=paperuri%3A%28ddaa57aa8ee922bb510e496bc7995df0%29&filter=sc_long_sign&tn=SE_xueshusource_2kduw22v&sc_vurl=http%3A%2F%2Fkns.cnki.net%2FKCMS%2Fdetail%2Fdetail.aspx%3Ffilename%3DZRZX201604005%26dbname%3DCJFD%26dbcode%3DCJFQ&ie=utf-8&sc_us=10303627852391763225 CHEN L Y, XUE L, XUE Y. Spatial-temporal characteristics of China's agricultural net carbon sink[J]. Journal of Natural Resources, 2016, 31(4):596-607 http://xueshu.baidu.com/s?wd=paperuri%3A%28ddaa57aa8ee922bb510e496bc7995df0%29&filter=sc_long_sign&tn=SE_xueshusource_2kduw22v&sc_vurl=http%3A%2F%2Fkns.cnki.net%2FKCMS%2Fdetail%2Fdetail.aspx%3Ffilename%3DZRZX201604005%26dbname%3DCJFD%26dbcode%3DCJFQ&ie=utf-8&sc_us=10303627852391763225 |
| [13] | WEST T O, MARLAND G. A Synthesis of carbon sequestration, carbon emissions, and net carbon flux in agriculture:Comparing tillage practices in the united states[J]. Agriculture, Ecosystems & Environment, 2002, 91(1/3):217-232 doi: 10.1016-S0167-8809(01)00233-X/ |
| [14] | EGGLESTON S, BUENDIA L, MIWA K, et al. 2006 IPCC Guidelines for National Greenhouse Gas Inventories[M]. Institute for Global Environment Institute for Global Environment Strategies (IGES), Hanyama, 2006 |
| [15] | 省级温室气体清单编制指南(试行)[EB/OL]. (2011-05)[2013-01-21]. https://wenku.baidu.com/view/c28d051b52d380eb62946df5.html Guidelines for the Preparation of Provincial Greenhouse Gas Inventories (for Trial Implementation)[EB/OL]. (2011-05)[2013-01-21]. https://wenku.baidu.com/view/c28d051b52d380eb62946df5.html |
| [16] | 李国志, 李宗植.中国农业能源消费碳排放因素分解实证分析——基于LMDI模型[J].农业技术经济, 2010, (10):66-72 http://www.wanfangdata.com.cn/details/detail.do?_type=perio&id=nyjsjj201010009 LI G Z, LI Z Z. Carbon emissions decomposition analysis on agricultural energy consumption in China-Based LMDI model[J]. Journal of Agrotechnical Economics, 2010, (10):66-72 http://www.wanfangdata.com.cn/details/detail.do?_type=perio&id=nyjsjj201010009 |
| [17] | 吴贤荣, 张俊飚, 田云, 等.中国省域农业碳排放:测算、效率变动及影响因素研究——基于DEA-Malmquist指数分解方法与Tobit模型运用[J].资源科学, 2014, 36(1):129-138 http://d.old.wanfangdata.com.cn/Periodical/jsnykx201605154 WU X R, ZHANG J B, TIAN Y, et al. Provincial agricultural carbon emissions in China:Calculation, performance change and influencing factors[J]. Resources Science, 2014, 36(1):129-138 http://d.old.wanfangdata.com.cn/Periodical/jsnykx201605154 |
| [18] | 陈舜, 逯非, 王效科.中国氮磷钾肥制造温室气体排放系数的估算[J].生态学报, 2015, 35(19):6371-6383 http://d.old.wanfangdata.com.cn/Periodical/stxb201519015 CHEN S, LU F, WANG X K. Estimation of greenhouse gases emission factors for China's nitrogen, phosphate, and potash fertilizers[J]. Acta Ecologica Sinica, 2015, 35(19):6371-6383 http://d.old.wanfangdata.com.cn/Periodical/stxb201519015 |
| [19] | 吴雪萍, 赵果庆.中国空间基尼系数:测算、改进与趋势[J].统计与决策, 2017, (3):5-9 http://d.old.wanfangdata.com.cn/Periodical/tjyjc201703001 WU X P, ZHAO G Q. Spatial Gini coefficient in China:Measurement, improvement and trend[J]. Statistics & Decision, 2017, (3):5-9 http://d.old.wanfangdata.com.cn/Periodical/tjyjc201703001 |
| [20] | FANG M, MOTAVALLI P P, KREMER R J, et al. Assessing changes in soil microbial communities and carbon mineralization in Bt and non-Bt corn residue-amended soils[J]. Applied Soil Ecology, 2007, 37(1/2):150-160 http://d.old.wanfangdata.com.cn/NSTLQK/NSTL_QKJJ0213851556/ |
| [21] | 曹志宏, 郝晋珉, 郭丽娜, 等.土地开发转让制度在区域土地空间配置及利益分配中的应用[J].中国人口·资源与环境, 2010, 20(10):91-96 doi: 10.3969/j.issn.1002-2104.2010.10.016 CAO Z H, HAO J M, GUO L N, et al. The application of land transferable development rights to land use secondary allocation and benefit distribution among different regions[J]. China Population Resources and Environment, 2010, 20(10):91-96 doi: 10.3969/j.issn.1002-2104.2010.10.016 |
