姚雄1,
王春萍1, 2,
吴红1, 2,
林清1, 2,
雷开荣1, 2,,
1.重庆市农业科学院 重庆 401329
2.逆境农业研究重庆市重点实验室 重庆 401329
基金项目: 国家重点研发计划项目2017YFD0301707
重庆市农发良种创新暨重大科研推广项目NKY2016AA003
重庆市社会民生科技创新专项cstc2016shms-ztzx80012
重庆市2017年度农业农村调研课题2017291
详细信息
作者简介:唐荣莉, 主要从事景观生态学研究。E-mail:tangtang832@163.com
通讯作者:雷开荣, 主要从事作物遗传改良与生物技术研究。E-mail:leikairong@126.com
中图分类号:170.4510计量
文章访问数:731
HTML全文浏览量:8
PDF下载量:575
被引次数:0
出版历程
收稿日期:2017-12-21
录用日期:2018-02-24
刊出日期:2018-07-01
Spatiotemporal evolution of rice production geographical agglomeration in Chongqing based on spatial statistics
TANG Rongli1, 2,,YAO Xiong1,
WANG Chunping1, 2,
WU Hong1, 2,
LIN Qing1, 2,
LEI Kairong1, 2,,
1. Chongqing Academy of Agricultural Sciences, Chongqing 401329, China
2. Chongqing Key Laboratory of Adversity Agriculture Research, Chongqing 401329, China
Funds: the National Key Research and Development Program of China2017YFD0301707
Chongqing Agricultural Development ProgramNKY2016AA003
Chongqing Social Science and Technology Innovation Projectcstc2016shms-ztzx80012
Chongqing Agricultural and Rural Research Project2017291
More Information
Corresponding author:LEI Kairong, E-mail:leikairong@126.com
摘要
HTML全文
图
参考文献
相关文章
施引文献
资源附件
访问统计
摘要
摘要:掌握农作物区域地理种植格局动态变化是进行种植结构调整和优化的重要基础。本研究以2000-2015年重庆市属区县水稻生产调查数据为基础,运用排序方法、空间统计方法剖析了16年来重庆水稻种植时空分布特点、不同区县时空演变的趋同性和相异性、区域水稻种植重心的转移特征、重庆水稻产业的地理集聚程度与分布的演化路径,以量化重庆市水稻生产的空间演化格局与动态。结果表明,16年间重庆市水稻种植面积和产量都存在波动,2007年以前水稻面积不断下降,2008年后面积逐渐恢复;在研究的各个时段内,无论单产、面积占比还是总产,重庆市的水稻生产均呈现出西部高于东部,南部高于北部的特征。重庆市以区县为统计单位的水稻生产可分为大面积高单产、小面积高单产、大面积低单产、小面积低单产4个类型;重庆市水稻产量重心位于区域西南部,但逐年向东北方向偏移;重庆水稻产业表现出高值聚集的特征,但空间聚集程度随时间推移逐渐降低,空间均质化程度提高。区域自然条件、社会经济、种植技术发展、政策引导等影响水稻产业的集聚格局,在今后的工作中需针对区域特征进行水稻种植规划和优化管理。
关键词:重庆市/
水稻生产/
集聚特征/
重心转移/
空间统计/
排序方法/
空间均质化
Abstract:Knowledge about dynamic changes of geographical planting patterns of crops is a critical basis for planting adjustments and optimal configurations. Using ordered and spatial statistical methods, the spatial distributions, temporal evolutions, key production area transformations and geographical concentrations of rice production in Chongqing municipality were determined. Also the spatial evolution patterns and dynamics of rice production from 2000 to 2015 were quantified. The results showed that the cultivated area and rice production in Chongqing decreased before 2007, but gradually increased after 2008. During the study period, the spatial distribution patterns of yield per unit area, planting area ratio and total yield in Chongqing were all higher in the west than in the east, and then higher in the south than in the north. Using administrative districts as study unit, rice production areas were divided into 4 typical zones-large area with high yield, small area with high yield, large area with low yield and small area with low yield. From 2000 to 2015, the counties belonging to the large area with high yield type and large area with low yield was stable with some changed in rank of counties. However, the type of small area with high yield changed greatly, the counties number decreased from 8 in 2000 to 4 in 2015. The counties of the small area and low yield type most located in the hill area where the light, water conditions were relative poor. With the expansion of Chongqing City, some counties once were in the small area with high yield changed to the type of small area with low yield. Rice production center was located in the southwest of Chongqing and gradually moved to the northeast. While the degree of geographical aggregation of rice industry decreased gradually over time, the degree of spatial homogenization improved. Regional natural factors, social economy, planting technology development and government planning were the influencing factors of the patterns of rice industry. In future, different cultivation planning and optimal management measures were needed for different planting areas.
Key words:Chongqing City/
Rice production/
Geographical aggregation/
Migration center of gravity/
Spatial statistics/
Ordered method/
Spatial homogenization
HTML全文

图1重庆市2000年、2005年、2010年和2015年水稻生产的时空特征(a:水稻种植面积区域占比; b:水稻单产; c:水稻总产)
BB: Beibei; BN: Banan; BS: Bishan; CK: Chengkou; CS: Changshou; DDK:大渡口Dadukou; DZ: Dazu; DJ: Dianjiang; FD: Fengdu; FJ: Fengjie; FL: Fuling; HC: Hechuan; JB: Jiangbei; JJ: Jiangjin; JLP:九龙坡Jiulongpo; KX: Kaixian; LP: Liangping; NA:南岸Nan’an; NC: Nanchuan; PS: Pengshui; QJ: Qianjiang; QJ2: Qijiang; RC: Rongchang; SPB:沙坪坝Shapingba; SZ: Shizhu; SQ:双桥Shuangqiao; TL: Tongliang; TN: Tongnan; WZ: Wanzhou; WS: Wushan; WS2: Wansheng; WX: Wuxi; WL: Wulong; XS: Xiushan; YC: Yongchuan; YB: Yubei; YY: Yunyang; YY2: Youyang; ZX: Zhongxian.
Figure1.Spatial-temporal features of rice production in 2000, 2005, 2010 and 2015 (a: ratio of rice planting area to region area; b: rice yield per unit area; c: overall production of rice)
 下载: 全尺寸图片幻灯片
图22000年、2005年、2010年和2015年重庆各区县水稻种植特征的异同
单产和面积累积可解释2000年、2005年、2010年和2015年区域差异的99.66%、99.82%、99.83%和99.79%。Area and per unit yield can explain 99.66%, 99.82%, 99.83% and 99.79% of the total variances between districts for 2000, 2005, 2010 and 2015, respectively. Icons of large & high, small & high, large & low, small & low stand for large area with high yield, small area with high yield, large area with low yield, and small area with low yield, respectively. BB: Beibei; BN: Banan; BS: Bishan; CK: Chengkou; CS: Changshou; DDK: Dadukou; DZ: Dazu; DJ: Dianjiang; FD: Fengdu; FJ: Fengjie; FL: Fuling; HC: Hechuan; JB: Jiangbei; JJ: Jiangjin; JLP: Jiulongpo; KX: Kaixian; LP: Liangping; NA: Nan’an; NC: Nanchuan; PS: Pengshui; QJ: Qianjiang; QJ2: Qijiang; RC: Rongchang; SPB: Shapingba; SZ: Shizhu; SQ: Shuangqiao; TL: Tongliang; TN: Tongnan; WZ: Wanzhou; WS: Wushan; WS2: Wansheng; WX: Wuxi; WL: Wulong; XS: Xiushan; YC: Yongchuan; YB: Yubei; YY: Yunyang; YY2: Youyang; ZX: Zhongxian.
Figure2.Similarities and differences in rice production among different districts of Chongqing in 2000, 2005, 2010 and 2015
下载: 全尺寸图片幻灯片
图32000年、2005年、2010年和2015年重庆区县水稻生产所属类型的变化
Icons of large & high, small & high, large & low, small & low stand for large area with high yield, small area with high yield, large area with low yield, and small area with low yield, respectively. BB: Beibei; BN: Banan; BS: Bishan; CK: Chengkou; CS: Changshou; DDK:大渡口Dadukou; DZ: Dazu; DJ: Dianjiang; FD: Fengdu; FJ: Fengjie; FL: Fuling; HC: Hechuan; JB: Jiangbei; JJ: Jiangjin; JLP:九龙坡Jiulongpo; KX: Kaixian; LP: Liangping; NA:南岸Nan’an; NC: Nanchuan; PS: Pengshui; QJ: Qianjiang; QJ2: Qijiang; RC: Rongchang; SPB:沙坪坝Shapingba; SZ: Shizhu; SQ:双桥Shuangqiao; TL: Tongliang; TN: Tongnan; WZ: Wanzhou; WS: Wushan; WS2: Wansheng; WX: Wuxi; WL: Wulong; XS: Xiushan; YC: Yongchuan; YB: Yubei; YY: Yunyang; YY2: Youyang; ZX: Zhongxian.
Figure3.Changes of rice production types of each district of Chongqing in 2000, 2005, 2010 and 2015
下载: 全尺寸图片幻灯片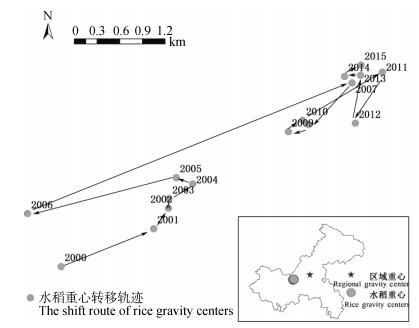
图42000-2015年重庆水稻种植地理分布重心的演变路径
Figure4.Shift route of gravity centers of rice production in Chongqing from 2000 to 2015
下载: 全尺寸图片幻灯片
图52000年、2005年、2010年和2015年重庆水稻种植地理集聚程度的演变特征
HH:高值聚集; LL:低值聚集; HL:高值离散; LH:低值离散。HH: clusters of high values; LL: clusters with low values; HL: high value but surrounded primarily by low values; LH: low value but surrounded primarily by high values. BB: Beibei; BN: Banan; BS: Bishan; CK: Chengkou; CS: Changshou; DDK:大渡口Dadukou; DZ: Dazu; DJ: Dianjiang; FD: Fengdu; FJ: Fengjie; FL: Fuling; HC: Hechuan; JB: Jiangbei; JJ: Jiangjin; JLP:九龙坡Jiulongpo; KX: Kaixian; LP: Liangping; NA:南岸Nan’an; NC: Nanchuan; PS: Pengshui; QJ: Qianjiang; QJ2: Qijiang; RC: Rongchang; SPB:沙坪坝Shapingba; SZ: Shizhu; SQ:双桥Shuangqiao; TL: Tongliang; TN: Tongnan; WZ: Wanzhou; WS: Wushan; WS2: Wansheng; WX: Wuxi; WL: Wulong; XS: Xiushan; YC: Yongchuan; YB: Yubei; YY: Yunyang; YY2: Youyang; ZX: Zhongxian.
Figure5.Spatio-temporal pattern of rice production agglomeration in Chongqing in 2000, 2005, 2010 and 2015
下载: 全尺寸图片幻灯片表12000-2015年重庆市水稻种植面积、单产和总产的变化特征
Table1.Change characteristics of planting area, yield per unit area and overall production of rice in Chongqing from 2000 to 2015
| 年份 Year | N | 面积 Area (hm2) | 单产 Yield per unit area (kg·hm-2) | 总产 Overall production (×104 t) | ||||||||||
| 最小值 Min. | 最大值 Max. | 总和 Total | 最小值 Min. | 最大值 Max. | 平均 Average | 中值 Mid-value | 标准差 Standard deviation | 最小值 Min. | 最大值 Max. | 总和 Total | ||||
| 2000 | 39 | 526.00 | 46 442.23 | 776 639.83 | 5 489.59 | 10 434.90 | 7 347.00 | 7 430.35 | 1 166.90 | 0.41 | 40.01 | 577.75 | ||
| 2001 | 39 | 508.00 | 46 057.23 | 762 967.79 | 4 286.76 | 8 957.74 | 6 480.49 | 6 525.93 | 1 053.15 | 0.36 | 39.47 | 507.68 | ||
| 2002 | 39 | 458.00 | 45 306.23 | 757 198.75 | 5 060.68 | 9 002.86 | 6 865.14 | 6 949.73 | 995.04 | 0.35 | 38.59 | 527.15 | ||
| 2003 | 39 | 452.00 | 44 618.22 | 738 489.66 | 5 067.53 | 8 986.32 | 7 028.38 | 7 063.90 | 908.03 | 0.32 | 38.15 | 530.30 | ||
| 2004 | 39 | 434.00 | 45 964.23 | 750 588.76 | 5 323.94 | 9 102.56 | 7 139.45 | 7 214.42 | 882.30 | 0.30 | 39.34 | 549.12 | ||
| 2005 | 39 | 387.00 | 46 064.23 | 747 762.73 | 5 542.85 | 8 826.60 | 7 179.99 | 7 248.24 | 885.49 | 0.27 | 39.35 | 546.96 | ||
| 2006 | 39 | 218.00 | 45 302.23 | 672 303.38 | 3 444.89 | 8 091.72 | 5 138.46 | 5 177.05 | 841.11 | 0.10 | 25.38 | 344.91 | ||
| 2007 | 39 | 62.00 | 43 241.22 | 652 135.28 | 5 679.15 | 8 621.64 | 7 296.30 | 7 338.67 | 693.42 | 0.05 | 36.68 | 491.60 | ||
| 2008 | 39 | 68.00 | 45 152.23 | 673 541.39 | 5 702.36 | 9 536.04 | 7 576.48 | 7 376.75 | 934.49 | 0.05 | 38.75 | 529.39 | ||
| 2009 | 39 | 67.00 | 45 338.23 | 682 044.42 | 6 063.28 | 8 990.30 | 7 248.05 | 7 044.74 | 738.35 | 0.05 | 36.92 | 511.31 | ||
| 2010 | 39 | 58.00 | 45 112.23 | 683 907.42 | 5 281.78 | 9 050.21 | 7 288.11 | 7 068.93 | 804.78 | 0.04 | 37.55 | 518.58 | ||
| 2011 | 39 | 34.67 | 44 911.76 | 686 488.74 | 4 607.67 | 8 859.71 | 6 757.37 | 6 539.50 | 1 057.07 | 0.02 | 35.89 | 493.48 | ||
| 2012 | 38 | 23.33 | 45 274.89 | 690 593.66 | 4 610.22 | 8 813.55 | 6 820.77 | 6 770.67 | 977.61 | 0.02 | 36.02 | 500.42 | ||
| 2013 | 38 | 20.00 | 45 609.23 | 688 660.47 | 4 515.61 | 8 851.56 | 6 881.87 | 6 719.08 | 957.48 | 0.01 | 36.55 | 503.07 | ||
| 2014 | 38 | 19.00 | 45 828.56 | 689 676.60 | 5 235.56 | 8 692.12 | 6 937.32 | 6 776.02 | 822.52 | 0.01 | 36.68 | 503.19 | ||
| 2015 | 38 | 0.67 | 45 875.90 | 688 322.39 | 4 295.73 | 8 762.06 | 7 015.92 | 6 941.08 | 872.79 | 0.00 | 36.80 | 506.40 | ||
下载: 导出CSV表22000年、2005年、2010年和2015年重庆市不同水稻生产类型区的基本特征
Table2.Basic characteristics of different rice production types areas of Chongqing in 2000, 2005, 2010 and 2015
| 生产类型区 Production type | 指标 Index | 2000年Year 2000 | 2005年Year 2005 | 2010年Year 2010 | 2015年Year 2015 | |||||||||||
| 面积 Area (hm2) | 总产 Overall production (×104 t) | 单产 Yield per unit area (kg·hm-2) | 面积 Area (hm2) | 总产 Overall production (×104 t) | 单产 Yield per unit area (kg·hm-2) | 面积 Area (hm2) | 总产 Overall production (×104 t) | 单产Yield per unit area (kg·hm-2) | 面积 Area (hm2) | 总产 Overall production (×104 t) | 单产 Yield per unit area (kg·hm-2) | |||||
| 大面积高单产 Large area with high yield | 数量N Amount | 13 | 13 | 14 | 14 | |||||||||||
| 平均 Average | 30 839.57 | 25.23 | 8 146.91 | 31 306.57 | 24.96 | 7 960.10 | 28 542.98 | 23.13 | 8 088.97 | 29 133.85 | 22.93 | 7 847.61 | ||||
| 百分比 Proportion (%) | 52 | 57 | - | 54 | 59 | - | 58 | 62 | - | 59 | 63 | - | ||||
| 大面积低单产 Large area with low yield | 数量N Amount | 9 | 7 | 7 | 7 | |||||||||||
| 平均 Average | 28 722.47 | 18.50 | 6 371.35 | 28 485.81 | 17.81 | 6 188.50 | 25 865.50 | 17.42 | 6 728.17 | 26 111.59 | 17.20 | 6 572.83 | ||||
| 百分比 Proportion (%) | 33 | 29 | - | 27 | 23 | - | 26 | 24 | - | 27 | 24 | - | ||||
| 小面积高单产 Small area with high yield | 数量N Amount | 8 | 9 | 4 | 4 | |||||||||||
| 平均 Average | 5 796.15 | 4.70 | 8 345.91 | 6 248.57 | 4.79 | 7 688.31 | 8 272.63 | 6.39 | 7 784.55 | 7 111.75 | 5.24 | 7 378.61 | ||||
| 百分比 Proportion (%) | 6 | 7 | - | 8 | 8 | - | 5 | 5 | - | 4 | 4 | - | ||||
| 小面积低单产 Small area with low yield | 数量N Amount | 9 | 10 | 14 | 13 | |||||||||||
| 平均 Average | 7 915.40 | 5.08 | 6 279.30 | 8 550.97 | 5.47 | 6 402.41 | 5 035.37 | 3.38 | 6 625.38 | 5 350.85 | 3.38 | 6 247.24 | ||||
| 百分比 Proportion (%) | 9 | 8 | - | 11 | 10 | - | 10 | 9 | - | 10 | 9 | - | ||||
下载: 导出CSV表32000年、2005年、2010年和2015年重庆水稻种植的区域地理聚集系数
Table3.Geographical aggregation indexes for rice production in Chongqing in 2000, 2005, 2010 and 2015
| 指标Index | 2000 | 2005 | 2010 | 2015 |
| Moran’s I | 0.454** | 0.386** | 0.255** | 0.128* |
| General G | 0.294** | 0.276** | 0.254* | 0.230 |
| **和*分别表示0.01、0.05水平上显著。**, * mean significant at 0.01, 0.05 levels, respectively. | ||||
下载: 导出CSV参考文献
| [1] | 王劲峰, 李连发, 葛咏, 等.地理信息空间分析的理论体系探讨[J].地理学报, 2000, 55(1): 92-103 doi: 10.11821/xb200001010 WANG J F, LI L F, GE Y, et al. A theoretic framework for spatial analysis[J]. Acta Geographica Sinica, 2000, 55(1): 92-103 doi: 10.11821/xb200001010 |
| [2] | 李二玲, 朱纪广, 李小建. 2008年中国种植业地理集聚与专业化格局[J].地理科学进展, 2012, 31(8): 1063-1070 doi: 10.11820/dlkxjz.2012.08.010 LI E L, ZHU J G, LI X J. Geographical agglomeration and specialized pattern of planting in China based on the different classifications[J]. Progress in Geography, 2012, 31(8): 1063-1070 doi: 10.11820/dlkxjz.2012.08.010 |
| [3] | 王国刚, 王明利, 杨春.中国畜牧业地理集聚特征及其演化机制[J].自然资源学报, 2014, 29(12): 2137-2146 doi: 10.11849/zrzyxb.2014.12.014 WANG G G, WANG M L, YANG C. Characteristics and mechanism of animal husbandry's geographical agglomeration in China[J]. Journal of Natural Resources, 2014, 29(12): 2137-2146 doi: 10.11849/zrzyxb.2014.12.014 |
| [4] | 纪龙, 吴文劼.我国蔬菜生产地理集聚的时空特征及影响因素[J].经济地理, 2015, 35(9): 141-148 http://www.cnki.com.cn/Article/CJFDTotal-JJDL201509019.htm JI L, WU W J. Spatial-temporal characteristics and affecting factors of vegetable produce geographic agglomeration in China[J]. Economic Geography, 2015, 35(9): 141-148 http://www.cnki.com.cn/Article/CJFDTotal-JJDL201509019.htm |
| [5] | 陈太政, 李二玲, 李琬. 1989-2009年河南省农作物地理集聚及其演化机制[J].地理科学进展, 2013, 32(8): 1237-1245 doi: 10.11820/dlkxjz.2013.08.007 CHEN T Z, LI E L, LI W. Geographical agglomeration of crops and its evolutionary mechanism in Henan Province during 1989-2009[J]. Progress in Geography, 2013, 32(8): 1237-1245 doi: 10.11820/dlkxjz.2013.08.007 |
| [6] | 王辉, 彭邦文, 王大力.云南省经济作物地理集聚的时空演变研究[J].云南师范大学学报:自然科学版, 2016, 36(2): 67-73 http://www.cqvip.com/QK/91650X/201602/668412177.html WANG H, PENG B W, WANG D L. Spatio-temporal pattern of Yunnan's economic crops agglomeration[J]. Journal of Yunnan Normal University, 2016, 36(2): 67-73 http://www.cqvip.com/QK/91650X/201602/668412177.html |
| [7] | 林正雨, 何鹏, 李晓, 等.四川省农业地理集聚格局及演化机制研究[J].中国农业资源与区划, 2017, 38(1): 207-215 http://www.cnki.com.cn/Article/CJFDTotal-DLYJ201606015.htm LIN Z Y, HE P, LI X, et al. The pattern and mechanism of agricultural geographical agglomeration in Sichuan Province[J]. Chinese Journal of Agricultural Resources and Regional Planning, 2017, 38(1): 207-215 http://www.cnki.com.cn/Article/CJFDTotal-DLYJ201606015.htm |
| [8] | 孙园园, 徐富贤, 孙永健, 等.四川稻作区优质稻生产气候生态条件适宜性评价及空间分布[J].中国生态农业学报, 2015, 23(4): 506-513 http://www.ecoagri.ac.cn/zgstny/ch/reader/view_abstract.aspx?file_no=2015415&flag=1 SUN Y Y, XU F X, SUN Y J, et al. Suitability evaluation of eco-climatic conditions for high quality rice production in Sichuan Province[J]. Chinese Journal of Eco-Agriculture, 2015, 23(4): 506-513 http://www.ecoagri.ac.cn/zgstny/ch/reader/view_abstract.aspx?file_no=2015415&flag=1 |
| [9] | 李二玲, 庞安超, 朱纪广.中国农业地理集聚格局演化及其机制[J].地理研究, 2012, 31(5): 885-898 http://geoscien.neigae.ac.cn/CN/article/downloadArticleFile.do?attachType=PDF&id=9957 LI E L, PANG A C, ZHU J G. Analysis of the evolution path and mechanism of China's agricultural agglomeration and geographic pattern[J]. Geographical Research, 2012, 31(5): 885-898 http://geoscien.neigae.ac.cn/CN/article/downloadArticleFile.do?attachType=PDF&id=9957 |
| [10] | 重庆市统计局, 国家统计局重庆调查总队.重庆统计年鉴-2017[M].北京:中国统计出版社, 2017 Chongqing Statistics Bureau, National Bureau of Statistics Chongqing Survey Team. Chongqing Statistical Year Book -2017[M]. Beijing: China Statistics Press, 2017 |
| [11] | 赖江山.生态学多元数据排序分析软件Canoco5介绍[J].生物多样性, 2013, 21(6): 765-768 http://www.cnki.com.cn/Article/CJFDTotal-SWDY201306016.htm LAI J S. Canoco 5: A new version of an ecological multivariate data ordination program[J]. Biodiversity Science, 2013, 21(6): 765-768 http://www.cnki.com.cn/Article/CJFDTotal-SWDY201306016.htm |
| [12] | 张松林, 张昆.全局空间自相关Moran指数和G系数对比研究[J].中山大学学报:自然科学版, 2007, 46(4): 93-97 http://www.cnki.com.cn/Article/CJFDTotal-ZSDZ200704022.htm ZHANG S L, ZHANG K. Comparison between general Moran's index and getis-ord general G of spatial autocorrelation[J]. Acta Scientiarum Naturalium Universitatis Sunyatseni, 2007, 46(4): 93-97 http://www.cnki.com.cn/Article/CJFDTotal-ZSDZ200704022.htm |
| [13] | 陈彦光.基于Moran统计量的空间自相关理论发展和方法改进[J].地理研究, 2009, 28(6): 1449-1463 http://www.cnki.com.cn/Article/CJFDTOTAL-DLYJ200906002.htm CHEN Y G. Reconstructing the mathematical process of spatial autocorrelation based on Moran's statistics[J]. Geographical Research, 2009, 28(6): 1449-1463 http://www.cnki.com.cn/Article/CJFDTOTAL-DLYJ200906002.htm |
| [14] | ANSELIN L. Local indicators of spatial association - LISA[J]. Geographical Analysis, 1995, 27(2): 93-115 |
| [15] | ZHANG C S, LUO L, XU W L, et al. Use of local Moran's I and GIS to identify pollution hotspots of Pb in urban soils of Galway, Ireland[J]. Science of the Total Environment, 2008, 398(1/3): 212-221 |
| [16] | 刘纪远, 张增祥, 徐新良, 等. 21世纪初中国土地利用变化的空间格局与驱动力分析[J].地理学报, 2009, 64(12): 1411-1420 http://www.cnki.com.cn/Article/CJFDTOTAL-DLXB200912004.htm LIU J Y, ZHANG Z X, XU X L, et al. Spatial patterns and driving forces of land use change in China in the early 21st century[J]. Acta Geogaphica Sinica, 2009, 64(12): 1411-1420 http://www.cnki.com.cn/Article/CJFDTOTAL-DLXB200912004.htm |
| [17] | 国家统计局农村社会经济调查司.中国农村统计年鉴-2015[M].北京:中国统计出版社, 2015 National Bureau of Statistics. China Rural Statistical Yearbook-2015[M]. Beijing: China Statistics Press, 2015 |
| [18] | 徐春春, 纪龙, 方福平, 等.西南地区水稻产业发展现状及存在问题与对策[J].贵州农业科学, 2016, 44(7): 142-146 http://www.cnki.com.cn/Article/CJFDTotal-GATE201607039.htm XU C C, JI L, FANG F P, et al. Rice industry actuality, existing problems and solutions in southwest China[J]. Guizhou Agricultural Sciences, 2016, 44(7): 142-146 http://www.cnki.com.cn/Article/CJFDTotal-GATE201607039.htm |
| [19] | 张建平, 刘宗元, 何永坤, 等.西南地区水稻干旱时空分布特征[J].应用生态学报, 2015, 26(10): 3103-3110 http://www.cjae.net/CN/abstract/abstract20255.shtml ZHANG J P, LIU Z Y, HE Y K, et al. Temporal and spatial distribution of rice drought in southwest China[J]. Chinese Journal of Applied Ecology, 2015, 26(10): 3103-3110 http://www.cjae.net/CN/abstract/abstract20255.shtml |
| [20] | 国家统计局.中国统计年鉴[M].北京:中国统计出版社, 2007 National Bureau of Statistics. China Statistical Yearbook[M]. Beijing: China Statistics Press, 2007 |
| [21] | 丛云飞, 陈松柏, 李杰, 等.重庆市水稻生产新型主体发展现状研究[J].南方农业, 2017, 11(23): 63-65 http://www.wanfangdata.com.cn/details/detail.do?_type=perio&id=nfny200901028 CONG Y F, CHEN S B, LI J, et al. The development status of new agricultural business subjects of rice production[J]. South China Agriculture, 2017, 11(23): 63-65 http://www.wanfangdata.com.cn/details/detail.do?_type=perio&id=nfny200901028 |
| [22] | 国家发展和改革委员会价格司. 全国农产品成本收益资料汇编[EB/OL]. 统计年鉴分享平台. [2018-03-23]. http://www.yearbookchina.com/naviBooklist-YZQGN-0.html Price Division of the National Development and Reform Commission. National agricultural product cost income data compilation[EB/OL]. Statistical Yearbook Sharing Platform. [2018-03-23]. http://www.yearbookchina.com/naviBooklist-YZQGN-0.html |
| [23] | 姚雄, 段秀建, 李经勇, 等.重庆市杂交水稻种子产业现状、问题及发展建议[J].杂交水稻, 2016, 31(3): 1-6 http://mall.cnki.net/magazine/Article/ZWYS201703009.htm YAO X, DUAN X J, LI J Y, et al. Current status, problems and developmental suggestions of hybrid rice seed industry in Chongqing municipality[J]. Hybrid Rice, 2016, 31(3): 1-6 http://mall.cnki.net/magazine/Article/ZWYS201703009.htm |
| [24] | 张晓梅, 丁艳锋, 张巫军, 等.西南稻区水稻产量的时空变化[J].浙江大学学报:农业与生命科学版, 2015, 41(6): 695-702 http://www.cnki.com.cn/Article/CJFDTotal-ZJNY201506011.htm ZHANG X M, DING Y F, ZHANG W J, et al. Spatial and temporal variation of rice yield in rice region of southwest China[J]. Journal of Zhejiang University: Agriculture and Life Sciences, 2015, 41(6): 695-702 http://www.cnki.com.cn/Article/CJFDTotal-ZJNY201506011.htm |
| [25] | 王国华, 张宁.重庆水稻产业的现状、问题与对策研究[J].中国稻米, 2003, 9(4): 38-39 WANG G H, ZHANG N. Development status, problem and their countermeasures for rice industrilization in Chongqing Municipality[J]. China Rice, 2003, 9(4): 38-39 |
| [26] | 张有望, 宋长鸣.区域合作视角下中三角地区主要农作物生产比较优势格局研究[J].农业现代化研究, 2017, 38(3): 502-509 http://cdmd.cnki.com.cn/Article/CDMD-10269-2010220066.htm ZHANG Y W, SONG C M. Study on the comparative advantages of major crops in central delta area from the perspective of regional cooperation[J]. Research of Agricultural Modernization, 2017, 38(3): 502-509 http://cdmd.cnki.com.cn/Article/CDMD-10269-2010220066.htm |
| [27] | 方福平.宏观政策对我国水稻生产发展的影响分析[J].农业经济问题, 2004, (9): 11-15 http://www.cnki.com.cn/Article/CJFDTOTAL-ZNJJ200111011.htm FANG F P. How does the macroeconomic policy influence on rice production in China: An analysis[J]. Issues in Agricultural Economy, 2004, (9): 11-15 http://www.cnki.com.cn/Article/CJFDTOTAL-ZNJJ200111011.htm |
| [28] | 陈风波, 刘晓丽, 冯肖映.水稻生产补贴政策实施效果及农户的认知与评价-来自长江中下游水稻产区的调查[J].华南农业大学学报:社会科学版, 2011, 10(2): 1-12 http://www.cnki.com.cn/Article/CJFDTotal-XDJZ201408077.htm CHEN F B, LIU X L, FENG X Y. The effect of rice subsidy policy and the rice farmers' recognition & evaluation - Survey from Yangtze River Area[J]. Journal of South China Agricultural University: Social Science Edition, 2011, 10(2): 1-12 http://www.cnki.com.cn/Article/CJFDTotal-XDJZ201408077.htm |
| [29] | 张现伟, 唐永群, 李经勇, 等.近5年重庆市审定和推广的水稻品种分析[J].中国稻米, 2015, 21(6): 52-53 http://www.cqvip.com/QK/98556X/201506/666715222.html ZHANG X W, TANG Y Q, LI J Y, et al. Analysis of rice varieties of Chongqing in recent five years[J]. China Rice, 2015, 21(6): 52-53 http://www.cqvip.com/QK/98556X/201506/666715222.html |
