 ,1,2,*
An Overview of Genome-wide Association Studies in Plants
Yuhui Zhao1, Xiuxiu Li1,2, Zhuo Chen1,2, Hongwei Lu1,2, Yucheng Liu1,2, Zhifang Zhang1,2, Chengzhi Liang,1,2,*ͨѶ����: *E-mail:cliang@genetics.ac.cn
���α༭: ������
�ո�����:2020-05-20��������:2020-08-26�����������:2020-11-01
| ��������: |
Corresponding authors: *E-mail:cliang@genetics.ac.cn
Received:2020-05-20Accepted:2020-08-26Online:2020-11-01

ժҪ
ȫ�������������(GWAS)�Ƕ�ֲ�︴����״��ػ���λ�ij����ֶΡ���ͨ��������ͼ�����Ӧ�ü�����ƶ���GWAS�ķ�չ����ֲ����, ����GWAS�����ܹ��Խϸߵķֱ�����ȫ������ˮƽ������������ȻȺ���ض���״��صĻ��������, ���ҿɽ�ʾ���ͱ�����Ŵ��ܹ�ȫ��ͼ��Ŀǰ, ��������GWAS���������������Ͻ�(Arabidopsis thaliana)��ˮ��(Oryza sativa)��С��(Triticum aestivum)������(Zea mays)�ʹ�(Glycine max)��ģʽֲ�����Ҫũ����Ʒϵ�з�����������״������ص�������״��λ(QTL)�����ѡ����λ��, ��������Щ��״���Ŵ�����, ��Ϊ��ʾ��Щ��״����ķ��ӻ����ṩ��ѡ����, ҲΪ����߲�����Ʒ�ֵ�ѡ���ṩ���������ݡ����Ķ�GWAS�ķ�����Ӱ�����ؼ����ݷ������̽�������ϸ����, ����Ϊ����о��ṩ�ο���
�ؼ��ʣ�
Abstract
Genome-wide association study (GWAS) is a general approach for unraveling genetic variations associated with complex traits in both animals and plants. The development of high-throughput genotyping has greatly boosted the development and application of GWAS. GWAS is not only used to identify genes/loci contributing to specific traits from diversenatural populations with high-resolution genome-wide markers, it also systematically reveals the genetic architecture underlying complex traits. During recent years, GWAS has successfully detected a large number of QTLs and candidate genes associated with various traits in plants including Arabidopsis, rice, wheat, soybean and maize. All these findings provided candidate genes controlling the traits and theoretical basis for breeding of high-yield and high-quality varieties. Here we review the methods, the factors affecting the power, and a data analysis pipeline of GWAS to provide reference for relevant research.
Keywords��
PDF (1798KB)Ԫ������ά�����������������EndNote|Ris|Bibtex�ղر���
����
�����, ������, ��پ, ³��ΰ, �����, ��־��, ����־. ������Ϣѧ��������I: ȫ�����������������. ֲ��ѧ��, 2020, 55(6): 715-732 doi:10.11983/CBB20091
Zhao Yuhui, Li Xiuxiu, Chen Zhuo, Lu Hongwei, Liu Yucheng, Zhang Zhifang, Liang Chengzhi.

1 GWAS����
ȫ�������������(genome-wide association study, GWAS)��һ��ͨ������ȫ�������Ŵ��������ͱ������������������λ����״��ص��Ŵ�λ��, ��Ⱥ��ˮƽ�Ͻ�����״�Ŵ������ķ�����Ӱ��GWAS�Ĺؼ�����֮һ��Ⱥ��ˮƽ����������ƽ��(linkage disequilibrium, LD)�������Ǵ��LD����Ҫ����(Visscher et al., 2012; Xiao et al., 2017)��LD�Ĵ�С��Ҫ��Ⱥ���Ŵ������Ե�Ӱ��, �ڲ�ͬ���ֺ�Ⱥ���в���ܴ�����, ����(Zea mays)Ⱥ���LDͨ����ˮ��(Oryza sativa)Ⱥ���LDС�ܶ�, ��������ִ�����Ʒ��Ⱥ���LD�������Ƚϴ�(Zhang et al., 2016; Li et al., 2020)����ͳ��QTL��λ�о�ͨ����2���ױ��ӽ�Ⱥ��Ϊ�о�����, ͨ��������ͼ��λĿ����״λ�㡣���ַ����ľ�����������Ϊ�ӽ�����Ⱥ������в����������¼���(LD��), Ϊʵ�־�ϸ��λ, ������ҪͶ�������Դ���������Ӵ������Ⱥ�塣��������������������о�������ȻȺ�����ʷ����(Yu and Buckler, 2006), �л����ø��߷ֱ��ʵĶ�λ���, ͬʱ�Ŵ�������ԴҲ��Ϊ�㷺, �����ܶ�λ����˫�ױ���ͼȺ���и������״����λ�㡣����LD�Ĵ���, ���������д�����ɱ��Ͳ���ı���ʱ, �ñ��츽�����Ŵ����Ҳ����������Ͳ�������, �Ӷ��������п��Ʊ��ͱ�������Ⱦɫ������GWAS�ѹ㷺Ӧ���ڽ������ͱ�����Ŵ�����, ��������ͱ�����ص�λ��, ��Ϊ���ܻ����о��ṩ��ѡ����/λ��, ��Ϊ����Ӧ���ṩ���ӱ�ǡ��� GWASҲ����һ����ȱ��, ��Ⱥ��ṹ��ɵļ�����, �Ŵ����������λ��ЧӦ��ڸǵȡ�Ϊ�˽����Щ����, �о�����Ҫ����������IJ���: ��һ�����㷨��, ͨ���ڹ�������ģ���п�����Ե��ϵ��Ⱥ��ṹ��Ӱ��, �Թ����������У��; ������ڹ���Ⱥ����, ѡȡ��Ե��ϵ��Ⱥ��ṹ������, ���DZ��ͱ���ḻ��Ⱥ��(Yano et al., 2016), ���˹�����Ⱥ�塣
2 GWAS�������
GWAS��Ҫ���ǵ��������Ⱥ���ѡȡ��Ⱥ��ṹ���������ͼ��������ݻ�ȡ��ʽ��ȫ�����������������ѡ���������2.1 Ⱥ���ѡȡ
Ⱥ���зḻ�ı��ͱ���ͳ�ֵ��Ŵ�������GWAS�ɹ��Ĺؼ����������, �ص㿼��ѡȡ����2��Ⱥ��: (1) Ⱥ����û�����Ե�Ⱥ��ṹ, ������û�й�������Ե��ϵ, ͬʱ���зḻ�ı��ͱ���; (2) Ⱥ�����Ծ���һ��ˮƽ�Ŵ��ֻ��IJ�ͬ��Ⱥ(��ˮ�������ֺ���Ⱥ), ���зḻ���Ŵ��ͱ��ͱ���, ��ͬʱ��ͬ��Ⱥ֮�����Ƶ�����Ŵ�����, ��֤Ŀ����״�ڲ�ͬ��Ⱥ�ڲ�Ҳ����һ��ˮƽ�ı��졣��������, Ҳ���Դ�ͷ������Ϊ����Ķ��ױ��ӽ�Ⱥ��, ��MAGIC (multi-parent advanced generation intercross)Ⱥ���NAM (nested association mapping)Ⱥ�塣��������Ӱ��GWAS��������λ�����Ŀ(Huang et al., 2011)��������Խ��, LDԽС, �������������ͳ��ѧ������б�֤����������Խ��, �ɱ�Խ�ߡ����, GWAS��Ҫ�ڿ���Ŀ����״�ĸ����Լ����������Ե������ȷ�����ʵ�������(Wang et al., 2020)��Ϊ�˱�֤���Ч��, ĿǰGWAS�������ձ����100��(Visscher et al., 2017; Alqudah et al., 2020)������, ˮ����GWASһ����Ҫ200-5 000������(Wang et al., 2020)������(Hordeum vulgare)��������һ����100-500��(Kumar et al., 2012)�����ڱ��ͱ���ḻ����״��1-2�����Ե���ЧӦλ�����ʱ, ��������200�����ϼ���(Wang et al., 2016, 2020); ���ڱ��Ͳ���С, �ɶ��������Ƶĸ�����״��Ҫ����������, ��ô���500�����ڶ����Ա��ͱ���Ĺ��׳���50%ʱ, 500���������Լ������ͽ��Ͷ���5%���ϵ�QTLλ��(Wang and Xu, 2019)�����Ƕ����ɵ�Ƶ��λ������Ƶ���״, Ҫ�ʵ����������������������ԡ�
2.2 Ⱥ��ṹ����
GWAS������, LD�Ķ���������Ҫ��ͨ�����Ŀ��Ⱥ����LD˥�����ٶ�, �����˽�Ⱥ������ʷ�����ǿ��, Ԥ����Ч�Ĺ���������Ҫ�ı���ܶ��Լ����������ķֱ��ʡ�Ⱥ��ṹ�ᵼ�²��������������LD, ����Ŀ����״���ػ���֮�䷢������, �Ӷ����³��ּ�����λ�㡣���, �ڽ��й�������ǰ��Ҫ����Ⱥ��ṹ����, ��Ⱥ��ṹ��ΪЭ������������ȷ�ȡ����ɷַ���(principal component analysis, PCA)��Ⱥ��ṹ������������֮һ��PCA����Ҫ���������ų�Ⱥ���е��쳣����, �Ի����ͽ�ά, �Ӷ�����Ⱥ��ṹ(Price et al., 2006; Raj et al., 2014; Wang et al., 2019)�����������EIGENSTRAT��GCTA��PLINK�������PCA (Abegaz et al., 2019)��
ͨ��PCA���Ŵ���ǽ�άͶӰ����ֱ�ӿ��ӻ�Ⱥ��ṹ, Ȼ��, ��ʱ�����������ͶӰ���겻�ܽ�������ȫ�����ȹ���(Martin et al., 2018)����PCA��ͬ, STRUCTURE������ͨ��������������ʽ����ģ�͵ķ���������������; ��ֱ�Ӵ�ģ�Ͳ����ĺ���ֲ�������ȫ�����ȹ��ơ�STRUCTURE���ñ�Ҷ˹������ȫ�����ȹ���(Pritchard et al., 2000; Falush et al., 2003; Hubisz et al., 2009); FRAPPE (Tang et al., 2005)��ADMIXTURE (Alexander et al., 2009)���������Ȼ��������ģ�Ͳ�����FRAPPEȱ���������Kֵ(������)�ķ���; ADMIXTURE��STRUCTURE��Ȼʹ����ͬ��ģ��, ��ADMIXTURE���ٶȱ�STRUCTURE�졣fastSTRUCTURE���ھ��鱴Ҷ˹���, ���ñ����������������ȫ�����ȹ���, ����ȷ������ADMIXTURE, �ٶȽ�STRUCTURE�ӿ�2��������(Raj et al., 2014)��
������о�ͬʱ����PCA����ʽ����ģ��2�ַ���������Ⱥ��ṹ, �Ա�֤����Ŀɿ���(Alqudah et al., 2016; Milner et al., 2019; Song et al., 2019; Zhang et al., 2019b)��PCA�Ľ����PCA1��PCA2�ܹ����ʹָ���֮���������졣STRUCTURE�������æ�K��K (K: ������: ��K: �÷����likelihood����, ������������Ŀɿ���)��ͼ��ȷ����������Ⱥ����������, ͨ����Ⱥ������log-likelihood�ı仯����Ҳ�ܹ�ȷ�����о�Ⱥ������Ⱥ��ṹ(Alqudah et al., 2020)��
2.3 ������������
���������ǹ��������Ļ�����Ϊ�˻�ÿɿ��ı�������, ͨ����Ҫ��������ظ��������������ӹ��������ķ�������, һ��Ҫ���������Ϊ��������, ���������о�����, ��ɢ���ݺͷ����������ض�����µ�GWAS��Ҳ���Ի�ýϺõĹ���������������Ͷ��ڹ�������ͳ�Ʒ�����ѡ������ҪӰ��(Gumpinger et al., 2018)�����ʹӴ�ͳ�ķ�����״������չ, ���ڲ����������ģ�ķ���ˮƽ�Ķ�������(����, Tieman��(2017)��zhu��(2018)ͨ����л��ȫ�������������(mGWAS)��λ���뷬��(Solanum lycopersicum)�������ǡ����Ǻͷ��Ѽ�ȶ��ִ�л�ﺬ����ص�λ��), ���п��Ŵ��������ĸ��ӱ���(Liu et al., 2019), ��ˮ����������(Huang et al., 2015)��������������(Ma et al., 2018a)��2.4 ���ӱ�����ݻ�ȡ
���ڵ��������̬��(SNP)��ǵ���Ҫ����(Griffith et al., 2008)������Ŵ������ԵĹ���, GWAS������ѡ��SNP��Ϊ����������������ǡ�Ϊ�˱�֤��λ��ȷ��, ��Ҫ������SNP��Ǹ���ΪN=�������С/LD˥�����롣����˥���ٶȼӿ�, ����SNP���������, �������ʽ���, ��λ��ȷ������(Myles et al., 2009; Sallam and Martsch, 2015; Alqudah et al., 2020)��SNPоƬ�ͻ�����������ձ�ʹ�õĻ�ȡSNP���ݵķ���, ���߸�����ȱ��(Tam et al., 2019)��SNPоƬ���ŶȺ�ȷ�ȸ�, �г�������ݷ������̺���, ��оƬ��Ҫ�����֪����λ��, �Ҷ���оƬ�۸�����������㹻������ܹ�����������͵��Ŵ�����, ���ɱ���Խϸ�, ������Դ�����, �������������ݼ����������һ���Ѷȡ�Ȼ��, ���Ų������Ŀ��ٷ�չ, ����ɱ������½�, ����ȫ�������ز������ݽ���GWAS���о������ࡣͨ��ȫ�������ز������ݲ������Լ���SNP���, ����ɸѡ���������쳣(CNV)�ʹ���/ȱʧ����(PAV)�Ƚṹ������; ��dz��ʺ���ϸ�Ƚ������ؼ��ױ����ط�Ʒ�ֺ�Ұ���͵Ļ����������ָ�����ֹ���(Li et al., 2017)��ȫ�������ز����ѹ㷺Ӧ��������(Citrullus lanatus) (Guo et al., 2019)��ƻ��(Malus domestica) (Duan et al., 2017)��ˮ��(Wang et al., 2015; Xie et al., 2015; Tong et al., 2016; Ma et al., 2019b)����(Glycine max) (Zhou et al., 2015; Fang et al., 2017)���˶�(Phaseolus vulgaris) (Wu et al., 2020)����(Gossypium hirsutum) (Du et al., 2018; Ma et al., 2018b, 2019a)��ӥ�춹(Cicer arietinum) (Thudi et al., 2016; Li et al., 2017, 2018)��ֲ���GWAS�о��С�Li��(2017)��69��ӥ�춹����ȫ�������ز���, ����ή���������λ�㾫ȷ��λ��1��100 kb��������, ��������NBS-LRR���弤ø��пָ�ṹ�����Լ�˿����/�հ��ᵰ��ø��12�������ʱ������Li��(2018)��132��ӥ�춹����ȫ�������ز���, ͨ��GWASɸѡ��38��SNPs, ������ء�ÿ��������ͿռԱȵ�6��������״��ء�Varshney��(2019)��429��ӥ�춹����ȫ�������ز���, ������900����������ͺ���صı�ǡ�
2.5 ģ�ͷ���ѡ�������
GWAS��������״��������ͨ������Logistic�ع�ģ��; ������״�����������Բ���һ������ģ��(general linear model, GLM)�ͻ������ģ��(mixed linear model, MLM)��һ������ģ����Ⱥ��ṹ����Q�����ɷַ�������ΪЭ����������㾫��; �������ģ������Ⱥ��ṹ����Q����Ե��ϵ����(kinship, K)�������������ɷַ����������Ե��ϵ����ΪЭ���������Ƽٹ����ij���(Yu et al., 2006; Yang et al., 2014)�����������״���ܶ�����Ӱ�������, �������ģ�㷺Ӧ����������״�Ĺ������������ڻ������ģ���������ڶ��(��1)��Table 1
��1
��1��ͬ�������ģ��(MLM)�����ܱȽ�
Table 1
| Method | Population structure | Kinship | Precision | Characteristic | Computational speed | Statistical power | Application |
|---|---|---|---|---|---|---|---|
| Standard MLM | P | All markers | Low | High | >100 papers | ||
| GRAMMAR | P | Approximate method | Very fast | Intermediate | Barley (200) | ||
| EMMA | P | Exact method | Intermediate | Similar to Standard MLM | >100 papers | ||
| EMMAX | P | All markers | Approximate method | High marker densities | Fast | Similar to Standard MLM | >100 papers |
| CMLM | P | Large sample sizes | Better than Standard MLM | >100 papers | |||
| FaST-LMM | P | A subset of genetic markers | Exact method | Large sample sizes | Fast | Similar to Standard MLM | Rice (200?1500) |
| GEMMA | P | Exact method | Fast | Similar to Standard MLM | Arabidopsis thaliana (190-500) | ||
| ECMLM | P | Intermediate | Better than Standard MLM | Sorghum (250-350), soybean (200-400), wheat (250-300) | |||
| GRAMMAR- Gamma | P | Approximate method | High marker densities | Fast | Similar to Standard MLM | Oilseed rape (200) | |
| SUPER | P | Trait-associated markers | Large sample size & high marker density | Fast | Better than Standard MLM | Wheat (300-400) | |
| Farm-CPU | P | A subset of genetic markers | Approximate method | Large sample size & high marker density | Fast | Better than Standard MLM | Wheat (100-1200), maize (100-5000) |
| BLINK | P | A subset of genetic markers | Approximate method | Large sample size & high marker density | Faster than FarmCPU | Better than FarmCPU |
�´��ڴ�|����CSV
�ñ��������ģ�ʹ�������������Ч�ʵ�, ����ʱ�䳤��Ϊ�����������ٶ�, ���ټ�����, EMMA�������ȳ���ͨ����������, ����������ʱ��(Kang et al., 2008)��֮��, ��̳��ֻ��ڲ�ͬ����ĸ�Чģ������Ӧ�������ӵ��������ͱ���ܶȡ����ͷ�������EMMAX (Kang et al., 2010)��GRAMMAR (Aulchenko et al., 2007)��GRAMMAR-Gamma (Svishcheva et al., 2012)��FaST-LMM (Lippert et al., 2011)��GEMMA (Zhou and Stephens, 2014)��EMMAX�ǹ��������ٶ�������һ���������㷨, �ѹ㷺Ӧ����������ˮ���ȵĸ�����״��������(Huang et al., 2016; Fang et al., 2017; Du et al., 2018; H��bner et al., 2019; Wu et al., 2020)��FaST-LMM������Ƶij������ǿ��ٶԳ��������ݼ�����GWAS�о�, ���ø÷����ɹ���������������500-1 500����ˮ��Ⱥ������Ҷ����Ҷ�нǺ����ӵ��������ϰٸ���״��ص�λ��(Xie et al., 2015; Bai et al., 2016; Chen et al., 2018; Dong et al., 2018)��������, FaST-LMM�ɹ�Ӧ����ˮ�������ѡ�С��(Triticum aestivum)������ֲ���mGWAS��TWAS (ȫת¼���������)��GWAS����չ����(Dong et al., 2015; Zhu et al., 2018; Kremling et al., 2019; Chen et al., 2020)��
����������Ȼ��������������ٶ�, ���ǶԼ��Ч���ĸ�������(Tang et al., 2016; Xiao et al., 2017)��Zhang��(2010)����������Ⱦ�����ģ��CMLM, ��ģ��ʹ�÷�����Ŵ�ЧӦ���������Ŵ�ЧӦ, �Ӷ���ͳ��Ч�����5%-15%, ���ڴ˻����Ͻ�һ���Ż���ECMLM����(Li et al., 2014)�����, ��̿�����һϵ������Ч����ģ��, ��FaST- LMM-Select (Listgarten et al., 2013)��SUPER (Wang et al., 2014)��BOLT-LMM (Loh et al., 2015)��������, �ڼ�������ٶ�����Ч����ǰ����, FarmCPU���ڹ̶�ģ�ͺ����ģ��ѭ��������������, �������Դ�����������, �����Խ��к������ܶȱ�ǵļ��(Liu et al., 2016)��FarmCPU��С�����ʹĴ��ģȺ������Լ������ںͿ�����״���QTL�ļ����з�����Ҫ����(Li et al., 2016, 2019; Kaler et al., 2017; Kusmec et al., 2017; Bhatta et al., 2018; Kidane et al., 2019; Lozada et al., 2019)��BLINK���FarmCPU�����������Ż�: �����û��ڱ�Ҷ˹�Ĺ̶�ģ���滻���ģ��; ���, ��LD��Ϣ�滻bin������BLINK�ڼ��Ч���������ٶȷ��������FarmCPU (Huang et al., 2019)��
��ǰ����Ŀ���Ѿ��ӵ�һ��״����ת��߲������ʡ������Ϳ�����ۺ���״���ձ����, ��������˶�������״���ϵĻ��ģ�ͷ���, ��Ҫ����MTMM (Korte et al., 2012)��GEMMA (mvLMMs) (Zhou and Stephens, 2014)��mtSet (Casale et al., 2015)��mvLMM (Furlotte and Eskin, 2015)�������о�����, ���ö�������״���Ϸ����IJ����ڹ�Ч�;����Ͼ����ڵ�����״������
���ڲ�ͬ���Ŵ�ѧ����ͳ��ѧ����, ӿ�ֳ��ڶ�������ģ�ͷ�����GWAS��Ҫ�ۺϿ����������������ٶȡ�ͳ��Ч����ʹ�ñ���Ե�����, ѡ����ʵķ�����������������ﵽ��������������Զ����������ij���Ⱥ��GWAS�о�, ����FaST-LMM�������������Դ��, �����ٶȿ졣���ڱ���ܶȴ��GWAS�о�, �ɲ���EMMAX�������з��������ھ��л����������������ͱ���ܶȴ��������GWAS�о�, �ɲ���SUPER��FarmCPU��BLINK�������з���, ��Щ���������ٶȿ�, �ɼ�������֪λ�㡣Ŀǰ, Ϊ��ȷ�������ȷ�ԺͿɿ���, ����GWASͬʱ���ö��ģ�������з���, �����Ƚ�ɸѡ�����Ž�(Wei et al., 2017; Peng et al., 2018; Zhang et al., 2019c)���������������ģ�ͼ���Ϊһ����������, ����ɶ���GWAS��ط�����GAPIT��TASSEL������������GAPIT������EMMAX��FaST-LMM��Farm-CPU��Blink���ڶ�ģ��, ���ҿ��Խ��л����ͺͱ�����ϡ�PCA�Լ�����������, ��������ڷ������µ�ͼƬ��ʽ����(Tang et al., 2016)��TASSEL�ṩ���û��Ѻõ�ͼ�λ�����, ������, ���Խ���SNP calling��LD�����Լ�Ⱥ��ṹ������, ���ܻ�ӭ(Bradbury et al., 2007)��
Ϊ�˿��Ƽ�����, ɸѡ������������Ĺ���λ��, ��Ҫͨ�����ؼ��������ȷ����������������ֵ����ֵ���趨ԭ�������о����֡�Ⱥ���Լ��о�Ŀ���ܲ��ɷ�(Kaler and Purcell, 2019; Alqudah et al., 2020)������, Ϊ������ض���״���Ŵ��ṹ��ͼ, �� �趨���ɵ���ֵ, ��Ϊ��ɸѡʵ����֤�ĺ�ѡλ������Ҫ�趨�ϸ���ֵ��Ŀǰ, ��Ҫ������Bonferroni������FDR (false discovery rate)�Լ��û�����(De et al., 2014; Jiang and Wang, 2018)������3�ַ�����, Bonferroni���������ϸ�, ���Ľ�����ʽΪ0.05/SNP�������������Bonferroni������, FDR����Ϊ����, �����ÿ����״��������һ��FDRֵ, ����������״�仯, ��ʽ�����û����鷽�������Ƚ�, ���������ܴ�, �ȽϺ�ʱ������, Bonferroni������FDR��ֲ��GWAS�о���ȷ����������ֵ�ij��÷�����
3 GWAS���ݷ�������
�����Ի���ƽ���������7����721��ˮ������(Li et al., 2020)ȫ�������ز�������Ϊ����˵��GWAS�о��ij������̡�һ�������, GWAS���ݷ������̰������ݱȶԡ�call SNP���������͡�����ͳ���Լ������ͱ���������(ͼ1)��ͼ1
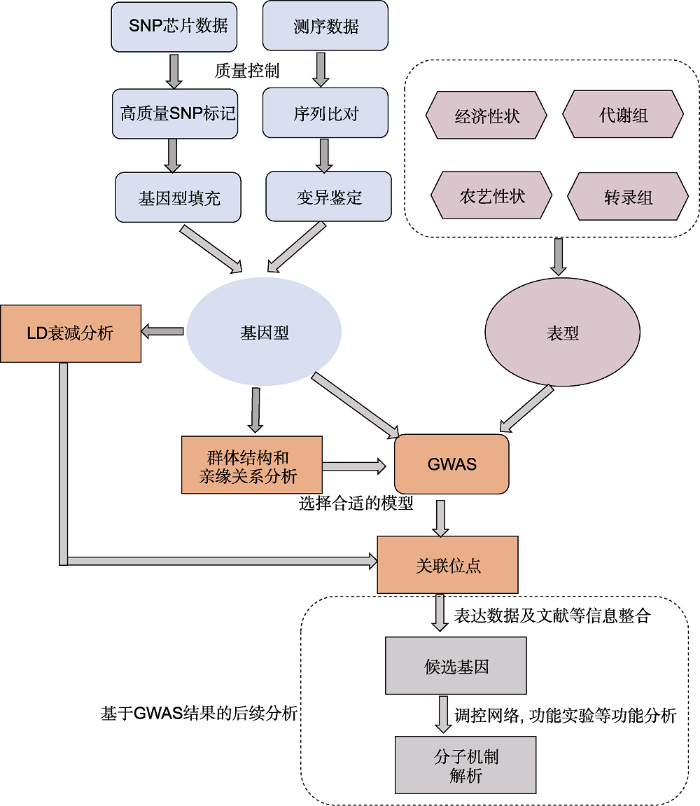 �´��ڴ�|����ԭͼZIP|����PPT
ͼ1ȫ�������������(GWAS)����
Figure 1The pipeline of genome-wide association study (GWAS)
3.1 �ز��������ʿغͱȶ�
����Trimmomatic (Bolger et al., 2014)��Fastx (3.1.1 ��������
(1) ���ݹ���:
����1: Trimmomatic
java-jar trimmomatic-0.33.jar PE -threads 16 -phred33 [sample1_R1].fastq.gz \
[sample1_R2].fastq. gz \
[sample1_clean_PE_1].fastq.gz [sample1_clean_ UP_1].fastq.gz \
[sample1_clean_PE_2].fastq.gz [sample1_clean_ UP_2].fastq.gz
ILLUMINACLIP: TruSeq3-PE.fa:2:30:3 LEADING:3 TRAILING:3 SLIDINGWINDOW:4:15 MINLEN:36
����, ����ļ�sample1_clean_PE_1.fastq.gz��sample1_clean_PE_2.fastq.gz�ǹ��˺�����˫������, sample1_clean_UP_1.fastq.gz��sample1_ clean_UP_2.fastq.gz��˫�����ݹ��˺�����������һ������, ��������һ�˸��������ݡ�
����2: Fastx
fastq_quality_filter-q 20 -p 50 -i [sample1_R1].fastq -o [sample1_R1_clean].fastq
fastq_quality_filter-q 20 -p 50 -i [sample1_R2].fastq -o [sample1_R2_clean].fastq
(2) �������
Fastqc -o [outdir/outname] --extract-f *.clean_ fastq. gz
��ע: �û��Զ����ļ���������÷����ű��, ���з���������ô˷�ʽ��ʾ��
3.1.2 ���ݱȶԼ����ͳ��
����BWA-MEM (Li et al., 2013)��Bowtie (Langmead et al., 2009)������������Ч���ݱȶԵ��ο������顣���ݱȶ��ʡ���Ⱥ��Ƕȶ����ݽ����������������ݴﵽ�����Ǽ����㹻����SNP�Ļ�����
(1) ���ݱȶ�
���ڲο������鹹������: bwa index [ref], ����ref��<�ο�����������>��
�ȶ�: bwa mem -M -t [threads] -R ��@RG\tID: [name]\tLB:[name]\tSM:[name]\tPL:illumina\tPU:[name]�� [ref] [R1_clean].fq [R2_clean].fq | samtools view -bS >[name.source].bam, ����-t��<�߳���>, -R ��@RG\tID:<��������>\tLB: <��������>\tSM: <��������>\tPL:<����ƽ̨����>\tPU:<��������>��, name.source.bam��bam��ʽ�ıȶԽ����
���ȶԽ�������ʿ�: samtools view-h [name. source].bam | samtools view-bS-q30 > [name].bam, ����name.bam�Ǹ������ıȶԽ����
���ȶԽ����������: samtools sort [name]. bam [name].sorted
���ڱȶԽ����������: samtools index [name]. sorted.bam
(2) �鿴�ȶԽ��
samtools flagstat [name].source.bam > [name]. source.mapinfo
(3) �鿴������ȺͶԻ�����ĸ��Ƕ�
����1: SOAP
soap.coverage -cvg -sam -p 5 -i [name].sam - refsingle [ref] -o [name].coverage, ����, -i�ǽ�sam��ʽ�ıȶԽ����Ϊ�����ļ�, -o��������������Ƕ��ļ���
����2: BEDTools+SAMtools
bedtools genomecov -ibam [name].sorted.bam >[name].coverage, ����-ibam��bam��ʽ������ȶԽ��, ����ļ����������Ƕȡ�
samtools depth -a [name].bam >[name].depth, ����-a��bam��ʽ�ıȶԽ��, ����ļ�������������ȡ�
3.2 ����λ������ͷ���
ʹ��GATK (McKenna et al., 2010; DePristo et al., 2011)��SAMtools (Li et al., 2011)����SNP�ͻ�����͡����һ�㱣��ȱʧ��С��0.2��mafֵ����0.05��SNP��3.2.1 ����GATK (GenomeAnalysisTK-3.8-0)���̽��б���λ������ͷ���
GATK call SNP��2��ģʽ: UnifiedGenotyper��HaplotypeCaller��
(1) GATK UnifiedGenotyper�������������:
java -Xmx15g -Djava.io.tmpdir=./tmp[i] -jar GenomeAnalysisTK.jar \
-nt $core \ #�߳���
-glm BOTH \ #����������, BOTHͬʱ���SNP��Indel
-T UnifiedGenotyper \ #�������
[-L ��[chrfile_name]��] \
-R [ref] \ #�����������
-I [name1.sorted].bam \ #��һ�������ıȶԽ��bam�ļ�
-I [name2.sorted].bam��.. \ #�ڶ��������ıȶԽ��bam�ļ�
-o [SNP.list].vcf \ #����ı���������vcf�ļ�
-metrics./all.UniGenMetrics.[i]\
-stand_call_conf 50.0 \
-stand_emit_conf 10.0 \
-dcov 1000 \
-A Coverage \
-A AlleleBalance
(2) GATK HaplotypeCaller�������������:
Step1: ����ÿ��������GVCF�ļ�
Java -Xmx30g -Djava.io.tmpdir=./tmp[i] -jar GenomeAnalysisTK.jar \
-T HaplotypeCaller \ #�������
-R [ref] \ #�����������
-I [name].sort.bam \ #����������bam��ʽ�ȶԽ��
-o [name].g.vcf \ #���gvcf�ļ�
-nct 4 \
--emitRefConfidence GVCF
Step2: ��GVCF�ļ�����Ⱥ�����λ��
java -Xmx30g -Djava.io.tmpdir=./tmp[i] -jar GenomeAnalysisTK.jar \
-T GenotypeGVCFs \ #�������
-R [ref] \ #�����������
-V [name1].g.vcf \ #��һ��������gvcf�ļ�
-V [name2].g.vcf��.. \ #�ڶ���������gvcf�ļ�
-nct 4 \
-o [out].vcf #����ı���������vcf�ļ�
3.2.2 ͨ��SAMtools���б���λ������ͷ���
bcftools mpileup [name].sorted.bam --fasta-ref [ref].fa | bcftools call -cv -o [raw].vcf, ����name. sorted.bam������������bam��ʽ�ȶԽ��, raw.vcf��vcf��ʽ��ԭʼ������������
filter variants: bcftools view [raw].vcf | misc/ vcfutils.pl varFilter > [name-final].vcf, ����raw.vcf��vcf��ʽ��ԭʼ����������, name-final.vcf�ǹ��˺������������
3.2.3 ����VCFtools��PLINK����ȱʧƵ�ʸ��Լ���Ҫ��λƵ�ʽϵ͵�SNP, ��֤���������ļ���Ч�ʺ�ͳ��ѧЧ��
����1: VCFtools (Danecek et al., 2011)����SNP����:
vcftools --vcf [vcf] [--plink] --max-missing 0.8-- maf 0.05 [--remove-indels] --out [outfile], ����vcf�DZ���������vcf�ļ�, outfile�ǹ��˺����ձ�����������
����2: PLINK (Purcell et al., 2007)����SNP����:
��vcf��ʽ�ļ�ת��ΪPLINK��ʽ: vcftools --vcf [vcf] --plink --out [outfile]
plink --file [outfile] --noweb --maf 0.05 --geno 0.1 [--mind 0.2] --out [out], ����outfile��plink��ʽ�����������ļ�, out�����ձ�����������
����ANNOVAR (Wang et al., 2010)��SNP����ע��, ��SNP�����ڻ������ϵ����λ�÷���, ������������Ρ�5'-UTR���������������ں�������3'-UTR�ͻ�������εȡ�ͬʱ, ע��SNP�Ե��ײ����Ӱ��, ��ͬ��ͻ�䡢��ͬ��ͻ�䡢����ͻ�估��ֹ��������ǰ��
3.3 Ⱥ��ṹ����Ե��ϵ��LD˥������
Ϊ�˽���Ⱥ��ṹ�ͼ�ϵ��Ե��ϵ��ȫ���������������Ӱ��, ��Ҫ����SNP��Ϣ���������Ⱥ��ṹ��Q����ͼ�ϵ��Ե����K������CDS����SNP, ����PHYLIP (http://evolution.genetics.Wa- shington.edu/phylip.htm)��MEGA (Tamura et al., 2013)��SNPphylo (Lee et al., 2014)������������չʾȺ��ṹ������������Ե��ϵ����������Ϊһ����Ԫ(����Ⱥ), �����������ղ�ͬ��Ⱥ���С�PCA����ȷ�����ɷ�������Ⱥ��ṹ, ��Ⱥ��ṹ���м���ͽ��������ɷֵ÷���Ϣ�����ڹ��������Ļ������ģ����, �Լ���Ⱥ��ṹ�����ļ����Թ�����
3.3.1 PCA����
(1) ����EIGENSOFT (Price et al., 2006)�����е�smartpca����PCA����(ͼ2):
ͼ2
 �´��ڴ�|����ԭͼZIP|����PPT
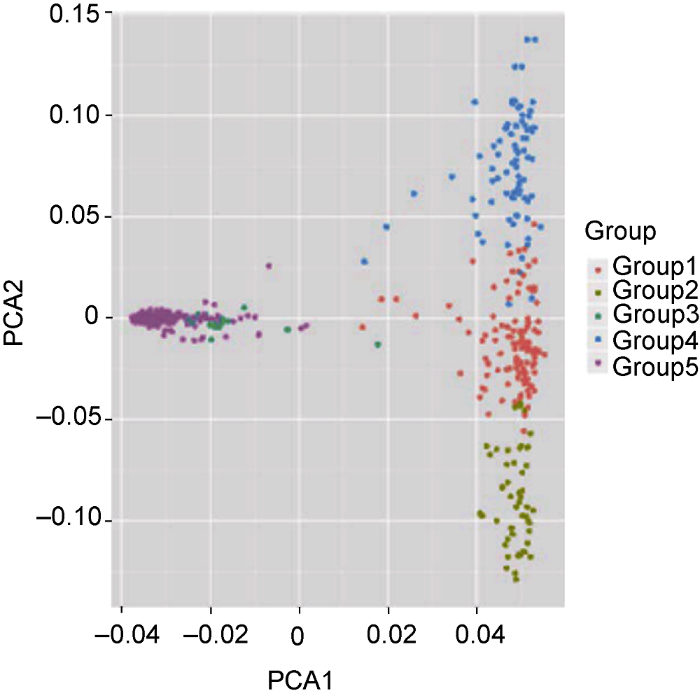
ͼ2721��ˮ�����ϵ����ɷַ���(PCA)ͼ
Figure 2The first two components from principal component analysis (PCA) of 721 rice accessions
����VCFtools��vcf�ļ�ת��Ϊ.ped��.map�ļ���
vcftools --vcf [vcf] -plink --out [name], ����vcf�����ձ���������vcf�ļ�, ����ļ���PLINK��ʽ�ı�����������
plink --file [name] --indep-pairwise 100 10 0.5 -- out [name], ����PLINK��ʽ�ı���������, ���������λ���ļ���
plink --file [name] --extract [name].prune.in -- recode --out [name].prunein, ����--file��PLINK��ʽ�ı���������, --extract����һ�������õIJ�����λ���ļ�, --out��ped��ʽ������λ������ļ���
(2) ����smartpca
EIG-master/bin/convertf -p parameter1
EIG-master/bin/smartpca -p parameter2
PCA������ӻ�: EIG-master/bin/ploteig -i [file]. evec -c 1:2 -p ??? -x -o PCA12.xtxt
parameter1��parameter2��2�������ļ�, �ļ������������ped�ļ���map�ļ������ĵ�1�����ɵĽ����file.evec��PCA����ļ�, �����������ơ���ϵ���ơ����ɷ�1��ֵ�����ɷ�2��ֵ�����ɷ�3��ֵ����Ϣ��
PCA�����ɱ���1-10�����ɷ������GWAS���������л������ؽ���, һ��ѡȡ�ܹ����ͱ�����> 5%�����ɷ����������������������ڲ�ͬ��GWAS�о�����Ҳ��ͨ��PC-Finder����Tracy-Widomͳ����ȷ�����ʵ����ɷָ���(Abegaz et al., 2019)��
3.3.2 ����ADMIXTURE����Ⱥ��ṹ�ƶ�, �˽�Ⱥ���Ŵ�����
Input file format: *.ped recoding the SNPs to a 1/2 coding
plink --file [name].prunein --recode12 --out [name].prunein.recode12
admixture --cv admixture_prunin.ped 2
admixture --cv admixture_prunin.ped 3
admixture --cv admixture_prunin.ped 4 ����10
����������ļ���admixture_prunin.[i].Q
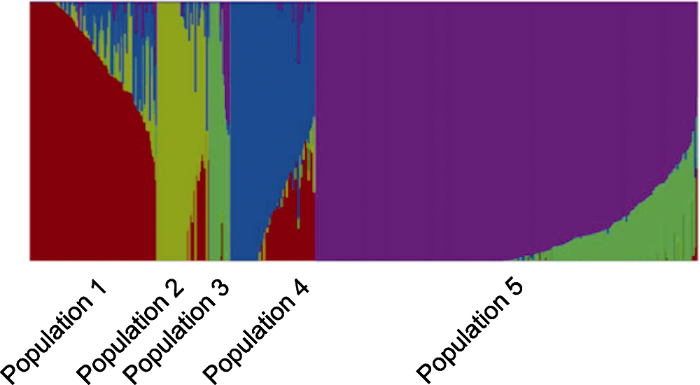
ADMIXTURE (Alexander et al., 2009)������Ŵ���Ⱥ, ÿ�д���һ������, ��ͬ��ɫƬ�εij��ȱ�ʾ��������������ij��������ռ�ı���(ͼ3)��ͼ3��ʾ������Ⱥ������Ϊ5ʱ, �������Ļ�������������ADMIXTURE��PCA�ķ������һ��, ��721��ˮ�����ϱ���Ϊ5�顣Ϊ�˱���Ⱥ��ṹ��ɵ�Ӱ��, ÿ����Ⱥ�Ĺ���������Ҫ��������(Wang et al., 2020)��
ͼ3
 �´��ڴ�|����ԭͼZIP|����PPT
ͼ3721��ˮ�����ϵ�Ⱥ��ṹ����
Figure 3Population structure analyses of 721 rice accessions
3.3.3 LD˥������
LD˥����������������PLINK��Haploview (Barrett et al., 2005)��PopLDdecay (Zhang et al., 2019a)��
����1: PLINK
plink --file [name] --r2 --ld-window 99999 -- ld-window-r2 0 --ld-window-kb 1000 --out [fileouts],
����--file�����ձ���������plink�ļ�, --outΪ���LD��ֵ��
����2: Haploview
Haploview: windows or linux, same as PLINK based on java
����3: PopLDdecay
One population: PopLDdecay [options] -InVCF [name].vcf.gz -OutStat [name].LD
Multiple populations: PopLDdecay -InVCF [name].vcf.gz -OutStat [name].LD -SubPop A.list
������ƽ�����r2˥�������ֵ��һ��ʱ��Ӧ�ľ����ΪLD��˥����, ʵ���г��ø�ֵ������Ⱥ�����Ŵ�����������������, ȷ�����������������ܶ��Լ�����GWAS����е������ź��ڻ������ѡ�����ѡȡ��Χ��
3.4 GWAS���岽��
GWAS��Ⱥ��ṹ����Ե��ϵ������ΪЭ����, ͨ���������ģ�ͽ�SNP�����������������EMMAX��GAPITΪ����˵�����������ľ��岽�衣3.4.1 ����EMMAX����GWAS����
(1) Preparing input genotype files
plink --file [name] --recode12 --transpose --out [name].emmax -noweb
results: name.emmax.tped and name. emmax.tfam
(2) Preparing input phenotype files
��������������3��, �ֱ�Ϊ����ID������ID������Iֵ�ͱ���IIֵ��ÿ��֮����tab����������ˮ������������Ϊ��, ��ʽ����:
����ID ����ID �����ڱ���ֵ
Sample_1707 Sample_1707 127
Sample_1708 Sample_1708 133
Sample_1709 Sample_1709 NA
Sample_1710 Sample_1710 130
Sample_1711 Sample_1711 131
Sample_1712 Sample_1712 123
Sample_1713 Sample_1713 139
(3) Creating Marker-Based Kinship Matrix
generate [tped_prefix].aIBS.kinf: emmax-kin-intel64 -v -s -d 10 [name].emmax
generate [tped_prefix].aBN.kinf: emmax-kin-intel64 -v -d 10 [name].emmax
IBS��BN�����ּ�����Ե��ϵ�ķ�������ѡ��һ��
(4) Run EMMAX association
����1: Adjust for covariates
����Ⱥ��ṹǿ��Ⱥ��, ��PCA����������ΪЭ����������Ⱥ��ṹ��GWAS�����Ӱ�졣
emmax-intel64 -v -d 10 -t [name].emmax -p phenofile -k [name].emmax.a[IBS,BN].kinf -c [name]. evec -o [outfile], ����, -t�ǻ����������ļ�, -p�DZ����ļ�, -k����Ե��ϵ����, -c��PCA���������
����2: No covariates
����Ⱥ��ṹ����Ⱥ��, ����PCA��Э����������Ⱥ��ṹ��
emmax-intel64 -v -d 10 -t [name].emmax -p phenofile -k [name].emmax.a[IBS,BN].kinf -o [outfile]
results: [out_prefix].reml and [out_prefix].ps
3.4.2 ����GAPIT����GWAS����
library(multtest)
library(gplots)
library(LDheatmap)
library(genetics)
library(ape)
library(EMMREML)
library(compiler)
library("scatterplot3d")
source("http://zzlab.net/GAPIT/gapit_functions.txt")
source("http://zzlab.net/GAPIT/emma.txt")
(1) Set working directory and import data
myY <- read.table("[mdp_traits.txt]", head = TRUE)
myG <- read.table("[mdp_genotype_test. hmp. Txt]", head = FALSE)
(2) Run GAPIT with CMLM
myGAPIT <- GAPIT(
Y=myY, #�����ļ�
G=myG, #�������ļ�
PCA.total=3, #ǰ3�����ɷֽ���Ⱥ��ṹ������
model=��CMLM��, #ѡ�����õĹ�������ģ��, �ɴ�"MLM"�� "CMLM"�� "MLMM"�� "SUPER"��"FarmCPU"��ģ����ѡ��һ��������
kinship.cluster=c("average", "complete", "ward"),
kinship.group=c("Mean", "Max"),
group.from=200,
group.to=1000000,
group.by=10)
����GAPIT����EMMAX���GWAS�������һ���ĵ�, �ĵ������ٰ���3��, SNPλ��(Ⱦɫ���ż�����Ⱦɫ���ϵ�λ��)��ÿһ��SNP��Ӧ��Pֵ(���������صij̶�, PֵԽС�����Խ���)��
3.5 GWAS���ɸѡ
GWAS�Ľ��ͨ����������ͼ��QQͼ��չʾ��������ͼ��ʾÿ��SNP�ڹ��������е�������ˮƽ; QQͼ��ӳ����������Ч����������ͼ(ͼ4A)��ÿ�������һ��SNP, x�����SNP�ڻ������ϵ��Ŵ�λ��, y����ʾ-log10 (P-value)����������ֵ�Ժ�ɫˮƽ��(����P=0.01)����ɫˮƽ��(����P=0.05)��ʾ, ���в���Bonferroni������������λ����y��ĸ߶ȶ�Ӧ��λ������͵Ĺ����̶�, �����̶�Խǿ, yֵԽ����LDӰ��, ��������ǿ����λ����Χ��SNPҲ����ֳ��������ɸߵ��������仯���ź�ǿ��, �Ӷ���PֵС�ĵط����ּ�塣��ֵ�㸽�������źű仯����Ⱥ���Ŵ�����ģʽ, ������һ���ɿ�λ�㡣
ͼ4
 �´��ڴ�|����ԭͼZIP|����PPT
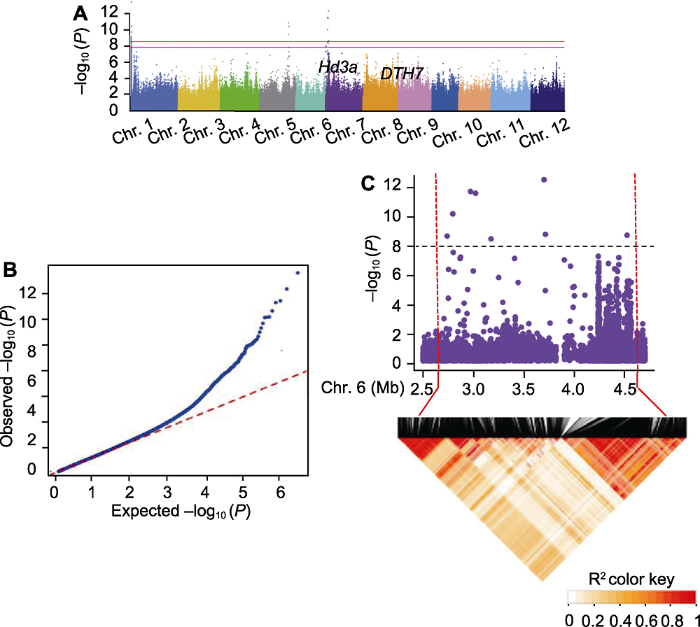
ͼ4721��ˮ�����ϳ�����ȫ�������������(GWAS)���չʾ
(A) ��������״�������������������ͼ; (B) QQͼ; (C) �ֲ�������ͼ��6��Ⱦɫ���帽����LD��ͼ��������ͼ�к�ɫ���߱����ѡ����, ��ɫ���߱�ʾ��������ֵ-log10 (P)=7.80��
Figure 4Genome-wide association study (GWAS) results of 721 rice accessions for heading date
(A) Manhattan plots of GWAS results for heading date; (B) QQ plot; (C) Local manhattan plots and LD heatmap around the peak on chromosome 6. Candidate region was labelled by red dotted line while the black dotted line indicated threshold -log10 (P)=7.80.
ͨ��ȫ��������������ȿ��Զ�λ��ijЩ��֪����Ҫ����, Ҳ�ܹ������µ�δ֪λ�㡣����EMMAXģ��, ��PCA��ǰ�������ɷ�(������>50%)ΪЭ������721��ˮ���ij����ڽ���GWAS�о������������һЩλ����֪����������λ��(ͼ4A)������, 6��Ⱦɫ���ϵ�Hd3a, 7��Ⱦɫ���ϵ�DTH7��ͬʱ, �ڱ���1��Ⱦɫ��ͷ��(Chr. 1: 1.35-1.52 M)�Լ�4��Ⱦɫ��β��(Chr. 4: 27.8-28.5 M)�ȼ�������������״�����λ��(Li et al., 2020)��
QQͼͨ���Ƚ�ÿ��SNP����Pֵ��۲�Pֵ�IJ�������GWAS��������ʿء�GWAS����ֻ��һС����SNP��������, ��˴�SNP����Pֵ��۲�PֵӦ���غϡ�QQͼ(ͼ4B)��P<10-3ʱ, Ⱥ�忪ʼ��ʾ���ܵ�ѡ��, SNP��������ֲ�, ˵�������о���ˮ���������������֮�����������ص�ѡ�����á�
����LD˥���ľ������������SNP, ͨ����2�ַ�ʽ��ȷ����ѡ���䡣(1) ����������SNP��N kb���ڵ�λ��ȷ��Ϊ�������; (2) N kb���ڵ�λ�����SNP����Ϊһ��cluster������, N��LD˥�����롣����, �������ˮ��6��Ⱦɫ�������������ص�һ�����, ���䶨λ��Hd3a����, ���ƺ�ѡ��������2.68-4.62 Mb (ͼ4C)��
GWAS��������ѡ�����ͨ�����϶����Ϣ����ѡ��ѡ���������������Ļ���ֵ�ý�����֤�������о���(1) �ź�pattern: �����ԴӸߵ��������仯; (2) ��ֵ���ڵĻ�����ע����������; (3) ����ʵ�鹦���о�����ѧ����֧��GWAS�����
4 С���չ��
������, �о���Ա����GWAS�����ڶ�ֲ�︴��������״�о��м����������ؼ�λ��, ������Щ��������λ����ܽ��Ͳ��ֱ��ͱ���, ��ȱʧ�Ŵ�����������Ȼ�ǵ�ǰ�����Ŵ�ѧ�о����ѵ㡣����, GWAS����ͳ��Ч�������Լ�������һ�������ڶ���й��ܵĵ�λ�����Ⱥ���е�Ч���������(De et al., 2014; Zhou and Huang, 2019)������ѧ���ݵĻ���Ϊ�ֲ�GWAS�IJ����ṩ�˻��ᡣ���ڻ�������GWAS (Liu et al., 2015; Jin et al., 2016; Kremling et al., 2018; Zhu et al., 2018)�����ڴ�л��ѧ��GWAS (Wen et al., 2014; Tieman et al., 2017; Wu et al., 2018; Chen et al., 2020)�ͻ��ڵ�������ѧ��GWAS (Fabres et al., 2017)����GWASδ���ķ�չ�����ο����� ԭ��˳��
������ȵ���
������������
�����ڿ�Ӱ������
DOI:10.1093/bib/bby081URLPMID:30219892 [��������: 2]

Principal components (PCs) are widely used in statistics and refer to a relatively small number of uncorrelated variables derived from an initial pool of variables, while explaining as much of the total variance as possible. Also in statistical genetics, principal component analysis (PCA) is a popular technique. To achieve optimal results, a thorough understanding about the different implementations of PCA is required and their impact on study results, compared to alternative approaches. In this review, we focus on the possibilities, limitations and role of PCs in ancestry prediction, genome-wide association studies, rare variants analyses, imputation strategies, meta-analysis and epistasis detection. We also describe several variations of classic PCA that deserve increased attention in statistical genetics applications.
DOI:10.1101/gr.094052.109URLPMID:19648217 [��������: 2]
Population stratification has long been recognized as a confounding factor in genetic association studies. Estimated ancestries, derived from multi-locus genotype data, can be used to perform a statistical correction for population stratification. One popular technique for estimation of ancestry is the model-based approach embodied by the widely applied program structure. Another approach, implemented in the program EIGENSTRAT, relies on Principal Component Analysis rather than model-based estimation and does not directly deliver admixture fractions. EIGENSTRAT has gained in popularity in part owing to its remarkable speed in comparison to structure. We present a new algorithm and a program, ADMIXTURE, for model-based estimation of ancestry in unrelated individuals. ADMIXTURE adopts the likelihood model embedded in structure. However, ADMIXTURE runs considerably faster, solving problems in minutes that take structure hours. In many of our experiments, we have found that ADMIXTURE is almost as fast as EIGENSTRAT. The runtime improvements of ADMIXTURE rely on a fast block relaxation scheme using sequential quadratic programming for block updates, coupled with a novel quasi-Newton acceleration of convergence. Our algorithm also runs faster and with greater accuracy than the implementation of an Expectation-Maximization (EM) algorithm incorporated in the program FRAPPE. Our simulations show that ADMIXTURE's maximum likelihood estimates of the underlying admixture coefficients and ancestral allele frequencies are as accurate as structure's Bayesian estimates. On real-world data sets, ADMIXTURE's estimates are directly comparable to those from structure and EIGENSTRAT. Taken together, our results show that ADMIXTURE's computational speed opens up the possibility of using a much larger set of markers in model-based ancestry estimation and that its estimates are suitable for use in correcting for population stratification in association studies.
DOI:10.3389/fgene.2016.00117URLPMID:27446200 [��������: 1]
Plant stature in temperate cereals is predominantly controlled by tillering and plant height as complex agronomic traits, representing important determinants of grain yield. This study was designed to reveal the genetic basis of tillering at five developmental stages and plant height at harvest in 218 worldwide spring barley (Hordeum vulgare L.) accessions under greenhouse conditions. The accessions were structured based on row-type classes [two- vs. six-rowed] and photoperiod response [photoperiod-sensitive (Ppd-H1) vs. reduced photoperiod sensitivity (ppd-H1)]. Phenotypic analyses of both factors revealed profound between group effects on tiller development. To further verify the row-type effect on the studied traits, Six-rowed spike 1 (vrs1) mutants and their two-rowed progenitors were examined for tiller number per plant and plant height. Here, wild-type (Vrs1) plants were significantly taller and had more tillers than mutants suggesting a negative pleiotropic effect of this row-type locus on both traits. Our genome-wide association scans further revealed highly significant associations, thereby establishing a link between the genetic control of row-type, heading time, tillering, and plant height. We further show that associations for tillering and plant height are co-localized with chromosomal segments harboring known plant stature-related phytohormone and sugar-related genes. This work demonstrates the feasibility of the GWAS approach for identifying putative candidate genes for improving plant architecture.
DOI:10.1016/j.jare.2019.10.013URLPMID:31956447 [��������: 4]
Understanding the genetic complexity of traits is an important objective of small grain temperate cereals yield and adaptation improvements. Bi-parental quantitative trait loci (QTL) linkage mapping is a powerful method to identify genetic regions that co-segregate in the trait of interest within the research population. However, recently, association or linkage disequilibrium (LD) mapping using a genome-wide association study (GWAS) became an approach for unraveling the molecular genetic basis underlying the natural phenotypic variation. Many causative allele(s)/loci have been identified using the power of this approach which had not been detected in QTL mapping populations. In barley (Hordeum vulgare L.), GWAS has been successfully applied to define the causative allele(s)/loci which can be used in the breeding crop for adaptation and yield improvement. This promising approach represents a tremendous step forward in genetic analysis and undoubtedly proved it is a valuable tool in the identification of candidate genes. In this review, we describe the recently used approach for genetic analyses (linkage mapping or association mapping), and then provide the basic genetic and statistical concepts of GWAS, and subsequently highlight the genetic discoveries using GWAS. The review explained how the candidate gene(s) can be detected using state-of-art bioinformatic tools.
DOI:10.1534/genetics.107.075614URLPMID:17660554 [��������: 1]
For pedigree-based quantitative trait loci (QTL) association analysis, a range of methods utilizing within-family variation such as transmission-disequilibrium test (TDT)-based methods have been developed. In scenarios where stratification is not a concern, methods exploiting between-family variation in addition to within-family variation, such as the measured genotype (MG) approach, have greater power. Application of MG methods can be computationally demanding (especially for large pedigrees), making genomewide scans practically infeasible. Here we suggest a novel approach for genomewide pedigree-based quantitative trait loci (QTL) association analysis: genomewide rapid association using mixed model and regression (GRAMMAR). The method first obtains residuals adjusted for family effects and subsequently analyzes the association between these residuals and genetic polymorphisms using rapid least-squares methods. At the final step, the selected polymorphisms may be followed up with the full measured genotype (MG) analysis. In a simulation study, we compared type 1 error, power, and operational characteristics of the proposed method with those of MG and TDT-based approaches. For moderately heritable (30%) traits in human pedigrees the power of the GRAMMAR and the MG approaches is similar and is much higher than that of TDT-based approaches. When using tabulated thresholds, the proposed method is less powerful than MG for very high heritabilities and pedigrees including large sibships like those observed in livestock pedigrees. However, there is little or no difference in empirical power of MG and the proposed method. In any scenario, GRAMMAR is much faster than MG and enables rapid analysis of hundreds of thousands of markers.
[��������: 1]
DOI:10.1093/bioinformatics/bth457URLPMID:15297300 [��������: 1]
UNLABELLED: Research over the last few years has revealed significant haplotype structure in the human genome. The characterization of these patterns, particularly in the context of medical genetic association studies, is becoming a routine research activity. Haploview is a software package that provides computation of linkage disequilibrium statistics and population haplotype patterns from primary genotype data in a visually appealing and interactive interface. AVAILABILITY: http://www.broad.mit.edu/mpg/haploview/ CONTACT: jcbarret@broad.mit.edu
DOI:10.3390/ijms19103237URL [��������: 1]
DOI:10.1093/bioinformatics/btu170URL [��������: 1]
Results: The value of NGS read preprocessing is demonstrated for both reference-based and reference-free tasks. Trimmomatic is shown to produce output that is at least competitive with, and in many cases superior to, that produced by other tools, in all scenarios tested.]]>
DOI:10.1093/bioinformatics/btm308URLPMID:17586829 [��������: 1]
Association analyses that exploit the natural diversity of a genome to map at very high resolutions are becoming increasingly important. In most studies, however, researchers must contend with the confounding effects of both population and family structure. TASSEL (Trait Analysis by aSSociation, Evolution and Linkage) implements general linear model and mixed linear model approaches for controlling population and family structure. For result interpretation, the program allows for linkage disequilibrium statistics to be calculated and visualized graphically. Database browsing and data importation is facilitated by integrated middleware. Other features include analyzing insertions/deletions, calculating diversity statistics, integration of phenotypic and genotypic data, imputing missing data and calculating principal components.
DOI:10.1038/nmeth.3439URLPMID:26076425 [��������: 1]
Set tests are a powerful approach for genome-wide association testing between groups of genetic variants and quantitative traits. We describe mtSet (http://github.com/PMBio/limix), a mixed-model approach that enables joint analysis across multiple correlated traits while accounting for population structure and relatedness. mtSet effectively combines the benefits of set tests with multi-trait modeling and is computationally efficient, enabling genetic analysis of large cohorts (up to 500,000 individuals) and multiple traits.
DOI:10.1111/pbi.13335URLPMID:31930656 [��������: 2]
The marriage of metabolomic approaches with genetic design has proven a powerful tool in dissecting diversity in the metabolome and has additionally enhanced our understanding of complex traits. That said, such studies have rarely been carried out in wheat. In this study, we detected 805 metabolites from wheat kernels and profiled their relative contents among 182 wheat accessions, conducting a metabolite-based genome-wide association study (mGWAS) utilizing 14 646 previously described polymorphic SNP markers. A total of 1098 mGWAS associations were detected with large effects, within which 26 candidate genes were tentatively designated for 42 loci. Enzymatic assay of two candidates indicated they could catalyse glucosylation and subsequent malonylation of various flavonoids and thereby the major flavonoid decoration pathway of wheat kernel was dissected. Moreover, numerous high-confidence genes associated with metabolite contents have been provided, as well as more subdivided metabolite networks which are yet to be explored within our data. These combined efforts presented the first step towards realizing metabolomics-associated breeding of wheat.
DOI:10.3389/fpls.2018.00612URLPMID:29868069 [��������: 1]
Rice seed storage protein (SSP) is an important source of nutrition and energy. Understanding the genetic basis of SSP content and mining favorable alleles that control it will be helpful for breeding new improved cultivars. An association analysis for SSP content was performed to identify underlying genes using 527 diverse Oryza sativa accessions grown in two environments. We identified more than 107 associations for five different traits, including the contents of albumin (Alb), globulin (Glo), prolamin (Pro), glutelin (Glu), and total SSP (Total). A total of 28 associations were located at previously reported QTLs or intervals. A lead SNP sf0709447538, associated for Glu content in the indica subpopulation in 2015, was further validated in near isogenic lines NIL(Zhenshan97) and NIL(Delong208), and the Glu phenotype had significantly difference between two NILs. The association region could be target for map-based cloning of the candidate genes. There were 13 associations in regions close to grain-quality-related genes; five lead single nucleotide polymorphisms (SNPs) were located less than 20 kb upstream from grain-quality-related genes (PG5a, Wx, AGPS2a, RP6, and, RM1). Several starch-metabolism-related genes (AGPS2a, OsACS6, PUL, GBSSII, and ISA2) were also associated with SSP content. We identified favorable alleles of functional candidate genes, such as RP6, RM1, Wx, and other four candidate genes by haplotype analysis and expression pattern. Genotypes of RP6 and RM1 with higher Pro were not identified in japonica and exhibited much higher expression levels in indica group. The lead SNP sf0601764762, repeatedly detected for Alb content in 2 years in the whole association population, was located in the Wx locus that controls the synthesis of amylose. And Alb content was significantly and negatively correlated with amylose content and the level of 2.3 kb Wx pre-mRNA examined in this study. The associations or candidate genes identified would provide new insights into the genetic basis of SSP content that will help in developing rice cultivars with improved grain nutritional quality through marker-assisted breeding.
DOI:10.1093/bioinformatics/btr330URL [��������: 1]
The variant call format (VCF) is a generic format for storing DNA polymorphism data such as SNPs, insertions, deletions and structural variants, together with rich annotations. VCF is usually stored in a compressed manner and can be indexed for fast data retrieval of variants from a range of positions on the reference genome. The format was developed for the 1000 Genomes Project, and has also been adopted by other projects such as UK10K, dbSNP and the NHLBI Exome Project. VCFtools is a software suite that implements various utilities for processing VCF files, including validation, merging, comparing and also provides a general Perl API.
[��������: 2]
DOI:10.1038/ng.806URLPMID:21478889 [��������: 1]
DOI:10.1371/journal.pgen.1007323URLPMID:29617374 [��������: 1]
As a major component of ideal plant architecture, leaf angle especially flag leaf angle (FLA) makes a large contribution to grain yield in rice. We utilized a worldwide germplasm collection to elucidate the genetic basis of FLA that would be helpful for molecular design breeding in rice. Genome-wide association studies (GWAS) identified a total of 40 and 32 QTLs for FLA in Wuhan and Hainan, respectively. Eight QTLs were commonly detected in both conditions. Of these, 2 and 3 QTLs were identified in the indica and japonica subpopulations, respectively. In addition, the candidates of 5 FLA QTLs were verified by haplotype-level association analysis. These results indicate diverse genetic bases for FLA between the indica and japonica subpopulations. Three candidates, OsbHLH153, OsbHLH173 and OsbHLH174, quickly responded to BR and IAA involved in plant architecture except for OsbHLH173, whose expression level was too low to be detected; their overexpression in plants increased rice leaf angle. Together with previous studies, it was concluded that all 6 members in bHLH subfamily 16 had the conserved function in regulating FLA in rice. A comparison with our previous GWAS for tiller angle (TA) showed only one QTL had pleiotropic effects on FLA and TA, which explained low similarity of the genetic basis between FLA and TA. An ideal plant architecture is expected to be efficiently developed by combining favorable alleles for FLA from indica with favorable alleles for TA from japonica by inter-subspecies hybridization.
URLPMID:25578276 [��������: 1]
DOI:10.1038/s41588-018-0116-xURLPMID:29736014 [��������: 2]
The ancestors of Gossypium arboreum and Gossypium herbaceum provided the A subgenome for the modern cultivated allotetraploid cotton. Here, we upgraded the G. arboreum genome assembly by integrating different technologies. We resequenced 243 G. arboreum and G. herbaceum accessions to generate a map of genome variations and found that they are equally diverged from Gossypium raimondii. Independent analysis suggested that Chinese G. arboreum originated in South China and was subsequently introduced to the Yangtze and Yellow River regions. Most accessions with domestication-related traits experienced geographic isolation. Genome-wide association study (GWAS) identified 98 significant peak associations for 11 agronomically important traits in G. arboreum. A nonsynonymous substitution (cysteine-to-arginine substitution) of GaKASIII seems to confer substantial fatty acid composition (C16:0 and C16:1) changes in cotton seeds. Resistance to fusarium wilt disease is associated with activation of GaGSTF9 expression. Our work represents a major step toward understanding the evolution of the A genome of cotton.
DOI:10.1038/s41467-017-00336-7URLPMID:28811498 [��������: 1]
Human selection has reshaped crop genomes. Here we report an apple genome variation map generated through genome sequencing of 117 diverse accessions. A comprehensive model of apple speciation and domestication along the Silk Road is proposed based on evidence from diverse genomic analyses. Cultivated apples likely originate from Malus sieversii in Kazakhstan, followed by intensive introgressions from M. sylvestris. M. sieversii in Xinjiang of China turns out to be an
URLPMID:28676813 [��������: 1]
URLPMID:12930761 [��������: 1]
DOI:10.1186/s13059-017-1289-9URLPMID:28838319 [��������: 2]
BACKGROUND: Soybean (Glycine max [L.] Merr.) is one of the most important oil and protein crops. Ever-increasing soybean consumption necessitates the improvement of varieties for more efficient production. However, both correlations among different traits and genetic interactions among genes that affect a single trait pose a challenge to soybean breeding. RESULTS: To understand the genetic networks underlying phenotypic correlations, we collected 809 soybean accessions worldwide and phenotyped them for two years at three locations for 84 agronomic traits. Genome-wide association studies identified 245 significant genetic loci, among which 95 genetically interacted with other loci. We determined that 14 oil synthesis-related genes are responsible for fatty acid accumulation in soybean and function in line with an additive model. Network analyses demonstrated that 51 traits could be linked through the linkage disequilibrium of 115 associated loci and these links reflect phenotypic correlations. We revealed that 23 loci, including the known Dt1, E2, E1, Ln, Dt2, Fan, and Fap loci, as well as 16 undefined associated loci, have pleiotropic effects on different traits. CONCLUSIONS: This study provides insights into the genetic correlation among complex traits and will facilitate future soybean functional studies and breeding through molecular design.
URLPMID:25724382 [��������: 1]
DOI:10.1093/nar/gkm967URLPMID:18006570 [��������: 1]
ORegAnno is an open-source, open-access database and literature curation system for community-based annotation of experimentally identified DNA regulatory regions, transcription factor binding sites and regulatory variants. The current release comprises 30 145 records curated from 922 publications and describing regulatory sequences for over 3853 genes and 465 transcription factors from 19 species. A new feature called the 'publication queue' allows users to input relevant papers from scientific literature as targets for annotation. The queue contains 4438 gene regulation papers entered by experts and another 54 351 identified by text-mining methods. Users can enter or 'check out' papers from the queue for manual curation using a series of user-friendly annotation pages. A typical record entry consists of species, sequence type, sequence, target gene, binding factor, experimental outcome and one or more lines of experimental evidence. An evidence ontology was developed to describe and categorize these experiments. Records are cross-referenced to Ensembl or Entrez gene identifiers, PubMed and dbSNP and can be visualized in the Ensembl or UCSC genome browsers. All data are freely available through search pages, XML data dumps or web services at: http://www.oreganno.org.
DOI:10.1007/978-1-4939-8618-7_5URLPMID:30421401 [��������: 1]
Many traits, such as height, the response to a given drug, or the susceptibility to certain diseases are presumably co-determined by genetics. Especially in the field of medicine, it is of major interest to identify genetic aberrations that alter an individual's risk to develop a certain phenotypic trait. Addressing this question requires the availability of comprehensive, high-quality genetic datasets. The technological advancements and the decreasing cost of genotyping in the last decade led to an increase in such datasets. Parallel to and in line with this technological progress, an analysis framework under the name of genome-wide association studies was developed to properly collect and analyze these data. Genome-wide association studies aim at finding statistical dependencies-or associations-between a trait of interest and point-mutations in the DNA. The statistical models used to detect such associations are diverse, spanning the whole range from the frequentist to the Bayesian setting.Since genetic datasets are inherently high-dimensional, the search for associations poses not only a statistical but also a computational challenge. As a result, a variety of toolboxes and software packages have been developed, each implementing different statistical methods while using various optimizations and mathematical techniques to enhance the computations.This chapter is devoted to the discussion of widely used methods and tools in genome-wide association studies. We present the different statistical models and the assumptions on which they are based, explain peculiarities of the data that have to be accounted for and, most importantly, introduce commonly used tools and software packages for the different tasks in a genome-wide association study, complemented with examples for their application.
URLPMID:31676863 [��������: 1]
[��������: 1]
DOI:10.1038/ncomms7258URLPMID:25651972 [��������: 1]
Exploitation of heterosis is one of the most important applications of genetics in agriculture. However, the genetic mechanisms of heterosis are only partly understood, and a global view of heterosis from a representative number of hybrid combinations is lacking. Here we develop an integrated genomic approach to construct a genome map for 1,495 elite hybrid rice varieties and their inbred parental lines. We investigate 38 agronomic traits and identify 130 associated loci. In-depth analyses of the effects of heterozygous genotypes reveal that there are only a few loci with strong overdominance effects in hybrids, but a strong correlation is observed between the yield and the number of superior alleles. While most parental inbred lines have only a small number of superior alleles, high-yielding hybrid varieties have several. We conclude that the accumulation of numerous rare superior alleles with positive dominance is an important contributor to the heterotic phenomena.
DOI:10.1038/nature19760URLPMID:27602511 [��������: 1]
Increasing grain yield is a long-term goal in crop breeding to meet the demand for global food security. Heterosis, when a hybrid shows higher performance for a trait than both parents, offers an important strategy for crop breeding. To examine the genetic basis of heterosis for yield in rice, here we generate, sequence and record the phenotypes of 10,074 F2 lines from 17 representative hybrid rice crosses. We classify modern hybrid rice varieties into three groups, representing different hybrid breeding systems. Although we do not find any heterosis-associated loci shared across all lines, within each group, a small number of genomic loci from female parents explain a large proportion of the yield advantage of hybrids over their male parents. For some of these loci, we find support for partial dominance of heterozygous locus for yield-related traits and better-parent heterosis for overall performance when all of the grain-yield traits are considered together. These results inform on the genomic architecture of heterosis and rice hybrid breeding.
DOI:10.1038/ng.1018URLPMID:22138690 [��������: 1]
A high-density haplotype map recently enabled a genome-wide association study (GWAS) in a population of indica subspecies of Chinese rice landraces. Here we extend this methodology to a larger and more diverse sample of 950 worldwide rice varieties, including the Oryza sativa indica and Oryza sativa japonica subspecies, to perform an additional GWAS. We identified a total of 32 new loci associated with flowering time and with ten grain-related traits, indicating that the larger sample increased the power to detect trait-associated variants using GWAS. To characterize various alleles and complex genetic variation, we developed an analytical framework for haplotype-based de novo assembly of the low-coverage sequencing data in rice. We identified candidate genes for 18 associated loci through detailed annotation. This study shows that the integrated approach of sequence-based GWAS and functional genome annotation has the potential to match complex traits to their causal polymorphisms in rice.
DOI:10.1111/j.1755-0998.2009.02591.xURLPMID:21564903 [��������: 1]
Genetic clustering algorithms require a certain amount of data to produce informative results. In the common situation that individuals are sampled at several locations, we show how sample group information can be used to achieve better results when the amount of data is limited. New models are developed for the structure program, both for the cases of admixture and no admixture. These models work by modifying the prior distribution for each individual's population assignment. The new prior distributions allow the proportion of individuals assigned to a particular cluster to vary by location. The models are tested on simulated data, and illustrated using microsatellite data from the CEPH Human Genome Diversity Panel. We demonstrate that the new models allow structure to be detected at lower levels of divergence, or with less data, than the original structure models or principal components methods, and that they are not biased towards detecting structure when it is not present. These models are implemented in a new version of structure which is freely available online at http://pritch.bsd.uchicago.edu/structure.html.
[��������: 1]
[��������: 1]
DOI:10.1038/srep18936URLPMID:26729541 [��������: 1]
Gene expression variation largely contributes to phenotypic diversity and constructing pan-transcriptome is considered necessary for species with complex genomes. However, the regulation mechanisms and functional consequences of pan-transcriptome is unexplored systematically. By analyzing RNA-seq data from 368 maize diverse inbred lines, we identified almost one-third nuclear genes under expression presence and absence variation, which tend to play regulatory roles and are likely regulated by distant eQTLs. The ePAV was directly used as
DOI:10.1186/s12864-019-5992-7URLPMID:31357925 [��������: 1]
BACKGROUND: Selection of an appropriate statistical significance threshold in genome-wide association studies is critical to differentiate true positives from false positives and false negatives. Different multiple testing comparison methods have been developed to determine the significance threshold; however, these methods may be overly conservative and may lead to an increase in false negatives. Here, we developed an empirical formula to determine the statistical significance threshold that is based on the marker-based heritability of the trait. To develop a formula for a significance threshold, we used 45 simulated traits in soybean, maize, and rice that varied in both broad sense heritability and the number of QTLs. RESULTS: A formula to determine a significance threshold was developed based on a regression equation that used one independent variable, marker-based heritability, and one response variable, - log10 (P)-values. For all species, the threshold -log10 (P)-values increased as both marker-based and broad-sense heritability increased. Higher broad sense heritability in these crops resulted in higher significant threshold values. Among crop species, maize, with a lower linkage disequilibrium pattern, had higher significant threshold values as compared to soybean and rice. CONCLUSIONS: Our formula was less conservative and identified more true positive associations than the false discovery rate and Bonferroni correction methods.
[��������: 1]
DOI:10.1038/ng.548URLPMID:20208533 [��������: 1]
Although genome-wide association studies (GWASs) have identified numerous loci associated with complex traits, imprecise modeling of the genetic relatedness within study samples may cause substantial inflation of test statistics and possibly spurious associations. Variance component approaches, such as efficient mixed-model association (EMMA), can correct for a wide range of sample structures by explicitly accounting for pairwise relatedness between individuals, using high-density markers to model the phenotype distribution; but such approaches are computationally impractical. We report here a variance component approach implemented in publicly available software, EMMA eXpedited (EMMAX), that reduces the computational time for analyzing large GWAS data sets from years to hours. We apply this method to two human GWAS data sets, performing association analysis for ten quantitative traits from the Northern Finland Birth Cohort and seven common diseases from the Wellcome Trust Case Control Consortium. We find that EMMAX outperforms both principal component analysis and genomic control in correcting for sample structure.
DOI:10.1534/genetics.107.080101URLPMID:18385116 [��������: 1]
Genomewide association mapping in model organisms such as inbred mouse strains is a promising approach for the identification of risk factors related to human diseases. However, genetic association studies in inbred model organisms are confronted by the problem of complex population structure among strains. This induces inflated false positive rates, which cannot be corrected using standard approaches applied in human association studies such as genomic control or structured association. Recent studies demonstrated that mixed models successfully correct for the genetic relatedness in association mapping in maize and Arabidopsis panel data sets. However, the currently available mixed-model methods suffer from computational inefficiency. In this article, we propose a new method, efficient mixed-model association (EMMA), which corrects for population structure and genetic relatedness in model organism association mapping. Our method takes advantage of the specific nature of the optimization problem in applying mixed models for association mapping, which allows us to substantially increase the computational speed and reliability of the results. We applied EMMA to in silico whole-genome association mapping of inbred mouse strains involving hundreds of thousands of SNPs, in addition to Arabidopsis and maize data sets. We also performed extensive simulation studies to estimate the statistical power of EMMA under various SNP effects, varying degrees of population structure, and differing numbers of multiple measurements per strain. Despite the limited power of inbred mouse association mapping due to the limited number of available inbred strains, we are able to identify significantly associated SNPs, which fall into known QTL or genes identified through previous studies while avoiding an inflation of false positives. An R package implementation and webserver of our EMMA method are publicly available.
DOI:10.1111/pbi.13062URLPMID:30575264 [��������: 1]
The Ethiopian plateau hosts thousands of durum wheat (Triticum turgidum subsp. durum) farmer varieties (FV) with high adaptability and breeding potential. To harness their unique allelic diversity, we produced a large nested association mapping (NAM) population intercrossing fifty Ethiopian FVs with an international elite durum wheat variety (Asassa). The Ethiopian NAM population (EtNAM) is composed of fifty interconnected bi-parental families, totalling 6280 recombinant inbred lines (RILs) that represent both a powerful quantitative trait loci (QTL) mapping tool, and a large pre-breeding panel. Here, we discuss the molecular and phenotypic diversity of the EtNAM founder lines, then we use an array featuring 13 000 single nucleotide polymorphisms (SNPs) to characterize a subset of 1200 EtNAM RILs from 12 families. Finally, we test the usefulness of the population by mapping phenology traits and plant height using a genome wide association (GWA) approach. EtNAM RILs showed high allelic variation and a genetic makeup combining genetic diversity from Ethiopian FVs with the international durum wheat allele pool. EtNAM SNP data were projected on the fully sequenced AB genome of wild emmer wheat, and were used to estimate pairwise linkage disequilibrium (LD) measures that reported an LD decay distance of 7.4 Mb on average, and balanced founder contributions across EtNAM families. GWA analyses identified 11 genomic loci individually affecting up to 3 days in flowering time and more than 1.6 cm in height. We argue that the EtNAM is a powerful tool to support the production of new durum wheat varieties targeting local and global agriculture.
URLPMID:22902788 [��������: 1]
URLPMID:29539638 [��������: 1]
DOI:10.1534/g3.119.400549URLPMID:31337639 [��������: 1]
Modern improvement of complex traits in agricultural species relies on successful associations of heritable molecular variation with observable phenotypes. Historically, this pursuit has primarily been based on easily measurable genetic markers. The recent advent of new technologies allows assaying and quantifying biological intermediates (hereafter endophenotypes) which are now readily measurable at a large scale across diverse individuals. The usefulness of endophenotypes for delineating the regulatory landscape of the genome and genetic dissection of complex trait variation remains underexplored in plants. The work presented here illustrated the utility of a large-scale (299-genotype and seven-tissue) gene expression resource to dissect traits across multiple levels of biological organization. Using single-tissue- and multi-tissue-based transcriptome-wide association studies (TWAS), we revealed that about half of the functional variation acts through altered transcript abundance for maize kernel traits, including 30 grain carotenoid abundance traits, 20 grain tocochromanol abundance traits, and 22 field-measured agronomic traits. Comparing the efficacy of TWAS with genome-wide association studies (GWAS) and an ensemble approach that combines both GWAS and TWAS, we demonstrated that results of TWAS in combination with GWAS increase the power to detect known genes and aid in prioritizing likely causal genes. Using a variance partitioning approach in the largely independent maize Nested Association Mapping (NAM) population, we also showed that the most strongly associated genes identified by combining GWAS and TWAS explain more heritable variance for a majority of traits than the heritability captured by the random genes and the genes identified by GWAS or TWAS alone. This not only improves the ability to link genes to phenotypes, but also highlights the phenotypic consequences of regulatory variation in plants.
[��������: 1]
DOI:10.1038/s41477-017-0007-7URLPMID:29150689 [��������: 1]
Phenotypic plasticity describes the phenotypic variation of a trait when a genotype is exposed to different environments. Understanding the genetic control of phenotypic plasticity in crops such as maize is of paramount importance for maintaining and increasing yields in a world experiencing climate change. Here, we report the results of genome-wide association analyses of multiple phenotypes and two measures of phenotypic plasticity in a maize nested association mapping (US-NAM) population grown in multiple environments and genotyped with ~2.5 million single-nucleotide polymorphisms. We show that across all traits the candidate genes for mean phenotype values and plasticity measures form structurally and functionally distinct groups. Such independent genetic control suggests that breeders will be able to select semi-independently for mean phenotype values and plasticity, thereby generating varieties with both high mean phenotype values and levels of plasticity that are appropriate for the target performance environments.
DOI:10.1186/gb-2009-10-3-r25URLPMID:19261174 [��������: 1]
Bowtie is an ultrafast, memory-efficient alignment program for aligning short DNA sequence reads to large genomes. For the human genome, Burrows-Wheeler indexing allows Bowtie to align more than 25 million reads per CPU hour with a memory footprint of approximately 1.3 gigabytes. Bowtie extends previous Burrows-Wheeler techniques with a novel quality-aware backtracking algorithm that permits mismatches. Multiple processor cores can be used simultaneously to achieve even greater alignment speeds. Bowtie is open source (http://bowtie.cbcb.umd.edu).
DOI:10.1186/1471-2164-15-162URLPMID:24571581 [��������: 1]
BACKGROUND: Phylogenetic trees are widely used for genetic and evolutionary studies in various organisms. Advanced sequencing technology has dramatically enriched data available for constructing phylogenetic trees based on single nucleotide polymorphisms (SNPs). However, massive SNP data makes it difficult to perform reliable analysis, and there has been no ready-to-use pipeline to generate phylogenetic trees from these data. RESULTS: We developed a new pipeline, SNPhylo, to construct phylogenetic trees based on large SNP datasets. The pipeline may enable users to construct a phylogenetic tree from three representative SNP data file formats. In addition, in order to increase reliability of a tree, the pipeline has steps such as removing low quality data and considering linkage disequilibrium. A maximum likelihood method for the inference of phylogeny is also adopted in generation of a tree in our pipeline. CONCLUSIONS: Using SNPhylo, users can easily produce a reliable phylogenetic tree from a large SNP data file. Thus, this pipeline can help a researcher focus more on interpretation of the results of analysis of voluminous data sets, rather than manipulations necessary to accomplish the analysis.
[��������: 1]
DOI:10.1007/s00122-019-03426-wURLPMID:31555889 [��������: 1]
KEY MESSAGE: Genetic relationships between the phenotypic means and plasticities of kernel size and weight revealed the common genetic control of these traits in maize. Kernel size and weight are crucial components of grain yield in maize, and phenotypic plasticity in these traits facilitates adaptations to changing environments. Elucidating the genetic architecture of the mean phenotypic values and plasticities of kernel size and weight may be essential for breeding climate-robust maize varieties. Here, a maize nested association mapping (CN-NAM) population and association panel were grown in different environments. A joint linkage analysis and genome-wide association mapping were performed for five kernel size and weight phenotypic traits and two phenotypic plasticity measures. The mean phenotypes and plasticities were significantly correlated. The overall results of quantitative trait locus (QTL) and candidate gene analyses indicated moderate and high levels of common genetic control for the two traits. Furthermore, the mean phenotypes or plasticities of the hundred-kernel weight and volume were commonly regulated to a high degree. One pleiotropic locus on chromosome 10 simultaneously controlled the mean phenotypic values and plasticities of kernel size and weight. Therefore, the plasticity of kernel size and weight might be indirectly selected during maize breeding; however, selecting for high or low plasticity in combination with high or low mean phenotypic values of kernel size and weight traits may be difficult.
DOI:10.1093/bioinformatics/btr509URLPMID:21903627 [��������: 1]
MOTIVATION: Most existing methods for DNA sequence analysis rely on accurate sequences or genotypes. However, in applications of the next-generation sequencing (NGS), accurate genotypes may not be easily obtained (e.g. multi-sample low-coverage sequencing or somatic mutation discovery). These applications press for the development of new methods for analyzing sequence data with uncertainty. RESULTS: We present a statistical framework for calling SNPs, discovering somatic mutations, inferring population genetical parameters and performing association tests directly based on sequencing data without explicit genotyping or linkage-based imputation. On real data, we demonstrate that our method achieves comparable accuracy to alternative methods for estimating site allele count, for inferring allele frequency spectrum and for association mapping. We also highlight the necessity of using symmetric datasets for finding somatic mutations and confirm that for discovering rare events, mismapping is frequently the leading source of errors. AVAILABILITY: http://samtools.sourceforge.net. CONTACT: hengli@broadinstitute.org.
arXiv: 1303.
[��������: 1]
DOI:10.1186/s12915-014-0073-5URL [��������: 1]
DOI:10.1007/s11427-019-1682-6URLPMID:32303966 [��������: 3]
Genotyping and phenotyping large natural populations provide opportunities for population genomic analysis and genome-wide association studies (GWAS). Several rice populations have been re-sequenced in the past decade; however, many major Chinese rice cultivars were not included in these studies. Here, we report large-scale genomic and phenotypic datasets for a collection mainly comprised of 1,275 rice accessions of widely planted cultivars and parental hybrid rice lines from China. The population was divided into three indica/Xian and three japonica/Geng phylogenetic subgroups that correlate strongly with their geographic or breeding origins. We acquired a total of 146 phenotypic datasets for 29 agronomic traits under multi-environments for different subpopulations. With GWAS, we identified a total of 143 significant association loci, including three newly identified candidate genes or alleles that control heading date or amylose content. Our genotypic analysis of agronomically important genes in the population revealed that many favorable alleles are underused in elite accessions, suggesting they may be used to provide improvements in future breeding efforts. Our study provides useful resources for rice genetics research and breeding.
DOI:10.3389/fpls.2017.00359URLPMID:28367154 [��������: 3]
Ascochyta blight (AB) is a fungal disease that can significantly reduce chickpea production in Australia and other regions of the world. In this study, 69 chickpea genotypes were sequenced using whole genome re-sequencing (WGRS) methods. They included 48 Australian varieties differing in their resistance ranking to AB, 16 advanced breeding lines from the Australian chickpea breeding program, four landraces, and one accession representing the wild chickpea species Cicer reticulatum. More than 800,000 single nucleotide polymorphisms (SNPs) were identified. Population structure analysis revealed relatively narrow genetic diversity amongst recently released Australian varieties and two groups of varieties separated by the level of AB resistance. Several regions of the chickpea genome were under positive selection based on Tajima's D test. Both Fst genome- scan and genome-wide association studies (GWAS) identified a 100 kb region (AB4.1) on chromosome 4 that was significantly associated with AB resistance. The AB4.1 region co-located to a large QTL interval of 7 Mb approximately 30 Mb identified previously in three different mapping populations which were genotyped at relatively low density with SSR or SNP markers. The AB4.1 region was validated by GWAS in an additional collection of 132 advanced breeding lines from the Australian chickpea breeding program, genotyped with approximately 144,000 SNPs. The reduced level of nucleotide diversity and long extent of linkage disequilibrium also suggested the AB4.1 region may have gone through selective sweeps probably caused by selection of the AB resistance trait in breeding. In total, 12 predicted genes were located in the AB4.1 QTL region, including those annotated as: NBS-LRR receptor-like kinase, wall-associated kinase, zinc finger protein, and serine/threonine protein kinases. One significant SNP located in the conserved catalytic domain of a NBS-LRR receptor-like kinase led to amino acid substitution. Transcriptional analysis using qPCR showed that some predicted genes were significantly induced in resistant lines after inoculation compared to non-inoculated plants. This study demonstrates the power of combining WGRS data with relatively simple traits to rapidly develop
DOI:10.3389/fpls.2018.00190URLPMID:29515606 [��������: 2]
Drought tolerance is a complex trait that involves numerous genes. Identifying key causal genes or linked molecular markers can facilitate the fast development of drought tolerant varieties. Using a whole-genome resequencing approach, we sequenced 132 chickpea varieties and advanced breeding lines and found more than 144,000 single nucleotide polymorphisms (SNPs). We measured 13 yield and yield-related traits in three drought-prone environments of Western Australia. The genotypic effects were significant for all traits, and many traits showed highly significant correlations, ranging from 0.83 between grain yield and biomass to -0.67 between seed weight and seed emergence rate. To identify candidate genes, the SNP and trait data were incorporated into the SUPER genome-wide association study (GWAS) model, a modified version of the linear mixed model. We found that several SNPs from auxin-related genes, including auxin efflux carrier protein (PIN3), p-glycoprotein, and nodulin MtN21/EamA-like transporter, were significantly associated with yield and yield-related traits under drought-prone environments. We identified four genetic regions containing SNPs significantly associated with several different traits, which was an indication of pleiotropic effects. We also investigated the possibility of incorporating the GWAS results into a genomic selection (GS) model, which is another approach to deal with complex traits. Compared to using all SNPs, application of the GS model using subsets of SNPs significantly associated with the traits under investigation increased the prediction accuracies of three yield and yield-related traits by more than twofold. This has important implication for implementing GS in plant breeding programs.
URLPMID:21892150 [��������: 1]
URLPMID:23619783 [��������: 1]
DOI:10.1016/j.molp.2015.01.016URLPMID:25620769 [��������: 1]
The temperate-tropical division of early maize germplasms to different agricultural environments was arguably the greatest adaptation process associated with the success and near ubiquitous importance of global maize production. Deciphering this history is challenging, but new insight has been gained from examining 558 529 single nucleotide polymorphisms, expression data of 28 769 genes, and 662 traits collected from 368 diverse temperate and tropical maize inbred lines in this study. This is a new attempt to systematically exploit the mechanisms of the adaptation process in maize. Our results indicate that divergence between tropical and temperate lines apparently occurred 3400-6700 years ago. Seven hundred and one genomic selection signals and transcriptomic variants including 2700 differentially expressed individual genes and 389 rewired co-expression network genes were identified. These candidate signals were found to be functionally related to stress responses, and most were associated with directionally selected traits, which may have been an advantage under widely varying environmental conditions faced by maize as it was migrated away from its domestication center. Our study also clearly indicates that such stress adaptation could involve evolution of protein-coding sequences as well as transcriptome-level regulatory changes. The latter process may be a more flexible and dynamic way for maize to adapt to environmental changes along its short evolutionary history.
URLPMID:30368955 [��������: 1]
DOI:10.1371/journal.pgen.1005767URLPMID:26828793 [��������: 1]
False positives in a Genome-Wide Association Study (GWAS) can be effectively controlled by a fixed effect and random effect Mixed Linear Model (MLM) that incorporates population structure and kinship among individuals to adjust association tests on markers; however, the adjustment also compromises true positives. The modified MLM method, Multiple Loci Linear Mixed Model (MLMM), incorporates multiple markers simultaneously as covariates in a stepwise MLM to partially remove the confounding between testing markers and kinship. To completely eliminate the confounding, we divided MLMM into two parts: Fixed Effect Model (FEM) and a Random Effect Model (REM) and use them iteratively. FEM contains testing markers, one at a time, and multiple associated markers as covariates to control false positives. To avoid model over-fitting problem in FEM, the associated markers are estimated in REM by using them to define kinship. The P values of testing markers and the associated markers are unified at each iteration. We named the new method as Fixed and random model Circulating Probability Unification (FarmCPU). Both real and simulated data analyses demonstrated that FarmCPU improves statistical power compared to current methods. Additional benefits include an efficient computing time that is linear to both number of individuals and number of markers. Now, a dataset with half million individuals and half million markers can be analyzed within three days.
DOI:10.1038/ng.3190URLPMID:25642633 [��������: 1]
Linear mixed models are a powerful statistical tool for identifying genetic associations and avoiding confounding. However, existing methods are computationally intractable in large cohorts and may not optimize power. All existing methods require time cost O(MN(2)) (where N is the number of samples and M is the number of SNPs) and implicitly assume an infinitesimal genetic architecture in which effect sizes are normally distributed, which can limit power. Here we present a far more efficient mixed-model association method, BOLT-LMM, which requires only a small number of O(MN) time iterations and increases power by modeling more realistic, non-infinitesimal genetic architectures via a Bayesian mixture prior on marker effect sizes. We applied BOLT-LMM to 9 quantitative traits in 23,294 samples from the Women's Genome Health Study (WGHS) and observed significant increases in power, consistent with simulations. Theory and simulations show that the boost in power increases with cohort size, making BOLT-LMM appealing for genome-wide association studies in large cohorts.
DOI:10.3389/fpls.2019.01337URLPMID:31736994 [��������: 1]
Snow mold is a yield-limiting disease of wheat in the Pacific Northwest (PNW) region of the US, where there is prolonged snow cover. The objectives of this study were to identify genomic regions associated with snow mold tolerance in a diverse panel of PNW winter wheat lines in a genome-wide association study (GWAS) and to evaluate the usefulness of genomic selection (GS) for snow mold tolerance. An association mapping panel (AMP; N = 458 lines) was planted in Mansfield and Waterville, WA in 2017 and 2018 and genotyped using the Illumina((R)) 90K single nucleotide polymorphism (SNP) array. GWAS identified 100 significant markers across 17 chromosomes, where SNPs on chromosomes 5A and 5B coincided with major freezing tolerance and vernalization loci. Increased number of favorable alleles was related to improved snow mold tolerance. Independent predictions using the AMP as a training population (TP) to predict snow mold tolerance of breeding lines evaluated between 2015 and 2018 resulted in a mean accuracy of 0.36 across models and marker sets. Modeling nonadditive effects improved accuracy even in the absence of a close genetic relatedness between the TP and selection candidates. Selecting lines based on genomic estimated breeding values and tolerance scores resulted in a 24% increase in tolerance. The identified genomic regions associated with snow mold tolerance demonstrated the genetic complexity of this trait and the difficulty in selecting tolerant lines using markers. GS was validated and showed potential for use in PNW winter wheat for selecting on complex traits such tolerance to snow mold.
URLPMID:30065732 [��������: 1]
DOI:10.1111/pbi.13013URLPMID:30220108 [��������: 1]
Upland cotton (Gossypium hirsutum) is the world's largest source of natural fibre and dominates the global textile industry. Hybrid cotton varieties exhibit strong heterosis that confers high fibre yields, yet the genome-wide effects of artificial selection that have influenced Upland cotton during its breeding history are poorly understood. Here, we resequenced Upland cotton genomes and constructed a variation map of an intact breeding pedigree comprising seven elite and 19 backbone parents. Compared to wild accessions, the 26 pedigree accessions underwent strong artificial selection during domestication that has resulted in reduced genetic diversity but stronger linkage disequilibrium and higher extents of selective sweeps. In contrast to the backbone parents, the elite parents have acquired significantly improved agronomic traits, with an especially pronounced increase in the lint percentage. Notably, identify by descent (IBD) tracking revealed that the elite parents inherited abundant beneficial trait segments and loci from the backbone parents and our combined analyses led to the identification of a core genomic segment which was inherited in the elite lines from the parents Zhong 7263 and Ejing 1 and that was strongly associated with lint percentage. Additionally, SNP correlation analysis of this core segment showed that a non-synonymous SNP (A-to-G) site in a gene encoding the cell wall-associated receptor-like kinase 3 (GhWAKL3) protein was highly correlated with increased lint percentage. Our results substantially increase the valuable genomics resources available for future genetic and functional genomics studies of cotton and reveal insights that will facilitate yield increases in the molecular breeding of cotton.
DOI:10.1371/journal.pgen.1008191URLPMID:31150378 [��������: 1]
Increasing agricultural productivity is one of the most important goals of plant science research and imperative to meet the needs of a rapidly growing population. Rice (Oryza sativa L.) is one of the most important staple crops worldwide. Grain size is both a major determinant of grain yield in rice and a target trait for domestication and artificial breeding. Here, a genome-wide association study of grain length and grain width was performed using 996,722 SNP markers in 270 rice accessions. Five and four quantitative trait loci were identified for grain length and grain width, respectively. In particular, the novel grain size gene OsSNB was identified from qGW7, and further results showed that OsSNB negatively regulated grain size. Most notably, knockout mutant plants by CRISPR/Cas9 technology showed increased grain length, width, and weight, while overexpression of OsSNB yielded the opposite. Sequencing of this gene from the promoter to the 3'-untranslated region in 168 rice accessions from a wide geographic range identified eight haplotypes. Furthermore, Hap 3 has the highest grain width discovered in japonica subspecies. Compared to other haplotypes, Hap 3 has a 225 bp insertion in the promoter. Based on the difference between Hap 3 and other haplotypes, OsSNB_Indel2 was designed as a functional marker for the improvement of rice grain width. This could be directly used to assist selection toward an improvement of grain width. These findings suggest OsSNB as useful for further improvements in yield characteristics in most cultivars.
DOI:10.1038/s41588-018-0119-7URLPMID:29736016 [��������: 1]
Upland cotton is the most important natural-fiber crop. The genomic variation of diverse germplasms and alleles underpinning fiber quality and yield should be extensively explored. Here, we resequenced a core collection comprising 419 accessions with 6.55-fold coverage depth and identified approximately 3.66 million SNPs for evaluating the genomic variation. We performed phenotyping across 12 environments and conducted genome-wide association study of 13 fiber-related traits. 7,383 unique SNPs were significantly associated with these traits and were located within or near 4,820 genes; more associated loci were detected for fiber quality than fiber yield, and more fiber genes were detected in the D than the A subgenome. Several previously undescribed causal genes for days to flowering, fiber length, and fiber strength were identified. Phenotypic selection for these traits increased the frequency of elite alleles during domestication and breeding. These results provide targets for molecular selection and genetic manipulation in cotton improvement.
DOI:10.1002/gepi.22103URLPMID:29288582 [��������: 1]
Population substructure can lead to confounding in tests for genetic association, and failure to adjust properly can result in spurious findings. Here we address this issue of confounding by considering the impact of global ancestry (average ancestry across the genome) and local ancestry (ancestry at a specific chromosomal location) on regression parameters and relative power in ancestry-adjusted and -unadjusted models. We examine theoretical expectations under different scenarios for population substructure; applying different regression models, verifying and generalizing using simulations, and exploring the findings in real-world admixed populations. We show that admixture does not lead to confounding when the trait locus is tested directly in a single admixed population. However, if there is more complex population structure or a marker locus in linkage disequilibrium (LD) with the trait locus is tested, both global and local ancestry can be confounders. Additionally, we show the genotype parameters of adjusted and unadjusted models all provide tests for LD between the marker and trait locus, but in different contexts. The local ancestry adjusted model tests for LD in the ancestral populations, while tests using the unadjusted and the global ancestry adjusted models depend on LD in the admixed population(s), which may be enriched due to different ancestral allele frequencies. Practically, this implies that global-ancestry adjustment should be used for screening, but local-ancestry adjustment may better inform fine mapping and provide better effect estimates at trait loci.
DOI:10.1101/gr.107524.110URLPMID:20644199 [��������: 1]
Next-generation DNA sequencing (NGS) projects, such as the 1000 Genomes Project, are already revolutionizing our understanding of genetic variation among individuals. However, the massive data sets generated by NGS--the 1000 Genome pilot alone includes nearly five terabases--make writing feature-rich, efficient, and robust analysis tools difficult for even computationally sophisticated individuals. Indeed, many professionals are limited in the scope and the ease with which they can answer scientific questions by the complexity of accessing and manipulating the data produced by these machines. Here, we discuss our Genome Analysis Toolkit (GATK), a structured programming framework designed to ease the development of efficient and robust analysis tools for next-generation DNA sequencers using the functional programming philosophy of MapReduce. The GATK provides a small but rich set of data access patterns that encompass the majority of analysis tool needs. Separating specific analysis calculations from common data management infrastructure enables us to optimize the GATK framework for correctness, stability, and CPU and memory efficiency and to enable distributed and shared memory parallelization. We highlight the capabilities of the GATK by describing the implementation and application of robust, scale-tolerant tools like coverage calculators and single nucleotide polymorphism (SNP) calling. We conclude that the GATK programming framework enables developers and analysts to quickly and easily write efficient and robust NGS tools, many of which have already been incorporated into large-scale sequencing projects like the 1000 Genomes Project and The Cancer Genome Atlas.
DOI:10.1038/s41588-018-0266-xURLPMID:30420647 [��������: 1]
Genebanks hold comprehensive collections of cultivars, landraces and crop wild relatives of all major food crops, but their detailed characterization has so far been limited to sparse core sets. The analysis of genome-wide genotyping-by-sequencing data for almost all barley accessions of the German ex situ genebank provides insights into the global population structure of domesticated barley and points out redundancies and coverage gaps in one of the world's major genebanks. Our large sample size and dense marker data afford great power for genome-wide association scans. We detect known and novel loci underlying morphological traits differentiating barley genepools, find evidence for convergent selection for barbless awns in barley and rice and show that a major-effect resistance locus conferring resistance to bymovirus infection has been favored by traditional farmers. This study outlines future directions for genomics-assisted genebank management and the utilization of germplasm collections for linking natural variation to human selection during crop evolution.
DOI:10.1105/tpc.109.068437URLPMID:19654263 [��������: 1]
The goal of many plant scientists' research is to explain natural phenotypic variation in terms of simple changes in DNA sequence. Traditionally, linkage mapping has been the most commonly employed method to reach this goal: experimental crosses are made to generate a family with known relatedness, and attempts are made to identify cosegregation of genetic markers and phenotypes within this family. In vertebrate systems, association mapping (also known as linkage disequilibrium mapping) is increasingly being adopted as the mapping method of choice. Association mapping involves searching for genotype-phenotype correlations in unrelated individuals and often is more rapid and cost-effective than traditional linkage mapping. We emphasize here that linkage and association mapping are complementary approaches and are more similar than is often assumed. Unlike in vertebrates, where controlled crosses can be expensive or impossible (e.g., in humans), the plant scientific community can exploit the advantages of both controlled crosses and association mapping to increase statistical power and mapping resolution. While the time and money required for the collection of genotype data were critical considerations in the past, the increasing availability of inexpensive DNA sequencing and genotyping methods should prompt researchers to shift their attention to experimental design. This review provides thoughts on finding the optimal experimental mix of association mapping using unrelated individuals and controlled crosses to identify the genes underlying phenotypic variation.
DOI:10.3389/fpls.2018.01196URL [��������: 1]
DOI:10.1038/ng1847URLPMID:16862161 [��������: 2]
Population stratification--allele frequency differences between cases and controls due to systematic ancestry differences-can cause spurious associations in disease studies. We describe a method that enables explicit detection and correction of population stratification on a genome-wide scale. Our method uses principal components analysis to explicitly model ancestry differences between cases and controls. The resulting correction is specific to a candidate marker's variation in frequency across ancestral populations, minimizing spurious associations while maximizing power to detect true associations. Our simple, efficient approach can easily be applied to disease studies with hundreds of thousands of markers.
URLPMID:10835412 [��������: 1]
We describe a model-based clustering method for using multilocus genotype data to infer population structure and assign individuals to populations. We assume a model in which there are K populations (where K may be unknown), each of which is characterized by a set of allele frequencies at each locus. Individuals in the sample are assigned (probabilistically) to populations, or jointly to two or more populations if their genotypes indicate that they are admixed. Our model does not assume a particular mutation process, and it can be applied to most of the commonly used genetic markers, provided that they are not closely linked. Applications of our method include demonstrating the presence of population structure, assigning individuals to populations, studying hybrid zones, and identifying migrants and admixed individuals. We show that the method can produce highly accurate assignments using modest numbers of loci-e.g. , seven microsatellite loci in an example using genotype data from an endangered bird species. The software used for this article is available from http://www.stats.ox.ac.uk/ approximately pritch/home. html.
DOI:10.1086/519795URLPMID:17701901 [��������: 1]
Whole-genome association studies (WGAS) bring new computational, as well as analytic, challenges to researchers. Many existing genetic-analysis tools are not designed to handle such large data sets in a convenient manner and do not necessarily exploit the new opportunities that whole-genome data bring. To address these issues, we developed PLINK, an open-source C/C++ WGAS tool set. With PLINK, large data sets comprising hundreds of thousands of markers genotyped for thousands of individuals can be rapidly manipulated and analyzed in their entirety. As well as providing tools to make the basic analytic steps computationally efficient, PLINK also supports some novel approaches to whole-genome data that take advantage of whole-genome coverage. We introduce PLINK and describe the five main domains of function: data management, summary statistics, population stratification, association analysis, and identity-by-descent estimation. In particular, we focus on the estimation and use of identity-by-state and identity-by-descent information in the context of population-based whole-genome studies. This information can be used to detect and correct for population stratification and to identify extended chromosomal segments that are shared identical by descent between very distantly related individuals. Analysis of the patterns of segmental sharing has the potential to map disease loci that contain multiple rare variants in a population-based linkage analysis.
DOI:10.1534/genetics.114.164350URLPMID:24700103 [��������: 2]
Tools for estimating population structure from genetic data are now used in a wide variety of applications in population genetics. However, inferring population structure in large modern data sets imposes severe computational challenges. Here, we develop efficient algorithms for approximate inference of the model underlying the STRUCTURE program using a variational Bayesian framework. Variational methods pose the problem of computing relevant posterior distributions as an optimization problem, allowing us to build on recent advances in optimization theory to develop fast inference tools. In addition, we propose useful heuristic scores to identify the number of populations represented in a data set and a new hierarchical prior to detect weak population structure in the data. We test the variational algorithms on simulated data and illustrate using genotype data from the CEPH-Human Genome Diversity Panel. The variational algorithms are almost two orders of magnitude faster than STRUCTURE and achieve accuracies comparable to those of ADMIXTURE. Furthermore, our results show that the heuristic scores for choosing model complexity provide a reasonable range of values for the number of populations represented in the data, with minimal bias toward detecting structure when it is very weak. Our algorithm, fastSTRUCTURE, is freely available online at http://pritchardlab.stanford.edu/structure.html.
DOI:10.1007/s10709-015-9848-zURLPMID:26041397 [��������: 1]
A multi-parent advanced generation inter-cross (MAGIC) derived from 11 founder lines in faba bean was used in this study to identify quantitative trait loci (QTL) for frost tolerance traits using the association mapping method with 156 SNP markers. This MAGIC population consists of a set of 189 genotypes from the Gottingen Winter Bean Population. The association panel was tested in two different experiments, i.e. a frost and a hardening experiment. Six morphological traits, leaf fatty acid composition, relative water content in shoots were scored in this study. The genotypes presented a large genetic variation for all traits that were highly heritable after frost and after hardening. High phenotypic significant correlations were established between traits. The principal coordinates analysis resulted in no clear structure in the current population. Association mapping was performed using a general linear model and mixed linear model with kinship. A False discovery rate of 0.20 (and 0.05) was used to test the significance of marker-trait association. As a result, many putative QTLs for 13 morphological and physiological traits were detected using both models. The results reveal that QTL mapping by association analysis is a powerful method of detecting the alleles associated with frost tolerance in the winter faba bean which can be used in accelerating breeding programs.
DOI:10.1007/s00122-019-03333-0URLPMID:30982110 [��������: 1]
KEY MESSAGE: A genome-wide associated study identified six novel QTLs for lint percentage. Two candidate genes underlying this trait were also detected. Increasing lint percentage (LP) is a core goal of cotton breeding. To better understand the genetic basis of LP, a genome-wide association study (GWAS) was conducted using 276 upland cotton accessions planted in multiple environments and genotyped with a CottonSNP63K array. After filtering, 10,660 high-quality single-nucleotide polymorphisms (SNPs) were retained. Population structure, principal component and neighbor-joining phylogenetic tree analyses divided the accessions into two subpopulations. These results along with linkage disequilibrium decay indicated accessions were not highly structured and exhibited weak relatedness. GWAS uncovered 23 polymorphic SNPs and 15 QTLs significantly associated with LP, with six new QTLs identified. Two candidate genes, Gh_D05G0313 and Gh_D05G1124, both contained one significant SNP, highly expressed during ovule and fiber development stages, implying that the two genes may act as the most promising regulators of LP. Furthermore, the phenotypic value of LP was found to be positively correlated with the number of favorable SNP alleles. These favorable alleles for LP identified in the study may be useful for improving lint yield.
DOI:10.1038/ng.2410URLPMID:22983301 [��������: 1]
The variance component tests used in genome-wide association studies (GWAS) including large sample sizes become computationally exhaustive when the number of genetic markers is over a few hundred thousand. We present an extremely fast variance components-based two-step method, GRAMMAR-Gamma, developed as an analytical approximation within a framework of the score test approach. Using simulated and real human GWAS data sets, we show that this method provides unbiased estimates of the SNP effect and has a power close to that of the likelihood ratio test-based method. The computational complexity of our method is close to its theoretical minimum, that is, to the complexity of the analysis that ignores genetic structure. The running time of our method linearly depends on sample size, whereas this dependency is quadratic for other existing methods. Simulations suggest that GRAMMAR-Gamma may be used for association testing in whole-genome resequencing studies of large human cohorts.
DOI:10.1038/s41576-019-0127-1URLPMID:31068683 [��������: 1]
Genome-wide association studies (GWAS) involve testing genetic variants across the genomes of many individuals to identify genotype-phenotype associations. GWAS have revolutionized the field of complex disease genetics over the past decade, providing numerous compelling associations for human complex traits and diseases. Despite clear successes in identifying novel disease susceptibility genes and biological pathways and in translating these findings into clinical care, GWAS have not been without controversy. Prominent criticisms include concerns that GWAS will eventually implicate the entire genome in disease predisposition and that most association signals reflect variants and genes with no direct biological relevance to disease. In this Review, we comprehensively assess the benefits and limitations of GWAS in human populations and discuss the relevance of performing more GWAS.
DOI:10.1093/molbev/mst197URLPMID:24132122 [��������: 1]
We announce the release of an advanced version of the Molecular Evolutionary Genetics Analysis (MEGA) software, which currently contains facilities for building sequence alignments, inferring phylogenetic histories, and conducting molecular evolutionary analysis. In version 6.0, MEGA now enables the inference of timetrees, as it implements the RelTime method for estimating divergence times for all branching points in a phylogeny. A new Timetree Wizard in MEGA6 facilitates this timetree inference by providing a graphical user interface (GUI) to specify the phylogeny and calibration constraints step-by-step. This version also contains enhanced algorithms to search for the optimal trees under evolutionary criteria and implements a more advanced memory management that can double the size of sequence data sets to which MEGA can be applied. Both GUI and command-line versions of MEGA6 can be downloaded from www.megasoftware.net free of charge.
DOI:10.1002/gepi.20064URLPMID:15712363 [��������: 1]
The genome of an admixed individual represents a mixture of alleles from different ancestries. In the United States, the two largest minority groups, African-Americans and Hispanics, are both admixed. An understanding of the admixture proportion at an individual level (individual admixture, or IA) is valuable for both population geneticists and epidemiologists who conduct case-control association studies in these groups. Here we present an extension of a previously described frequentist (maximum likelihood or ML) approach to estimate individual admixture that allows for uncertainty in ancestral allele frequencies. We compare this approach both to prior partial likelihood based methods as well as more recently described Bayesian MCMC methods. Our full ML method demonstrates increased robustness when compared to an existing partial ML approach. Simulations also suggest that this frequentist estimator achieves similar efficiency, measured by the mean squared error criterion, as Bayesian methods but requires just a fraction of the computational time to produce point estimates, allowing for extensive analysis (e.g., simulations) not possible by Bayesian methods. Our simulation results demonstrate that inclusion of ancestral populations or their surrogates in the analysis is required by any method of IA estimation to obtain reasonable results.
[��������: 2]
DOI:10.1186/s12870-015-0690-3URLPMID:26822060 [��������: 1]
BACKGROUND: Chickpea (Cicer arietinum L.) is the second most important grain legume cultivated by resource poor farmers in South Asia and Sub-Saharan Africa. In order to harness the untapped genetic potential available for chickpea improvement, we re-sequenced 35 chickpea genotypes representing parental lines of 16 mapping populations segregating for abiotic (drought, heat, salinity), biotic stresses (Fusarium wilt, Ascochyta blight, Botrytis grey mould, Helicoverpa armigera) and nutritionally important (protein content) traits using whole genome re-sequencing approach. RESULTS: A total of 192.19 Gb data, generated on 35 genotypes of chickpea, comprising 973.13 million reads, with an average sequencing depth of ~10 X for each line. On an average 92.18 % reads from each genotype were aligned to the chickpea reference genome with 82.17 % coverage. A total of 2,058,566 unique single nucleotide polymorphisms (SNPs) and 292,588 Indels were detected while comparing with the reference chickpea genome. Highest number of SNPs were identified on the Ca4 pseudomolecule. In addition, copy number variations (CNVs) such as gene deletions and duplications were identified across the chickpea parental genotypes, which were minimum in PI 489777 (1 gene deletion) and maximum in JG 74 (1,497). A total of 164,856 line specific variations (144,888 SNPs and 19,968 Indels) with the highest percentage were identified in coding regions in ICC 1496 (21 %) followed by ICCV 97105 (12 %). Of 539 miscellaneous variations, 339, 138 and 62 were inter-chromosomal variations (CTX), intra-chromosomal variations (ITX) and inversions (INV) respectively. CONCLUSION: Genome-wide SNPs, Indels, CNVs, PAVs, and miscellaneous variations identified in different mapping populations are a valuable resource in genetic research and helpful in locating genes/genomic segments responsible for economically important traits. Further, the genome-wide variations identified in the present study can be used for developing high density SNP arrays for genetics and breeding applications.
DOI:10.1126/science.aal1556URLPMID:28126817 [��������: 2]
Modern commercial tomato varieties are substantially less flavorful than heirloom varieties. To understand and ultimately correct this deficiency, we quantified flavor-associated chemicals in 398 modern, heirloom, and wild accessions. A subset of these accessions was evaluated in consumer panels, identifying the chemicals that made the most important contributions to flavor and consumer liking. We found that modern commercial varieties contain significantly lower amounts of many of these important flavor chemicals than older varieties. Whole-genome sequencing and a genome-wide association study permitted identification of genetic loci that affect most of the target flavor chemicals, including sugars, acids, and volatiles. Together, these results provide an understanding of the flavor deficiencies in modern commercial varieties and the information necessary for the recovery of good flavor through molecular breeding.
DOI:10.1186/s12284-016-0129-yURLPMID:27757948 [��������: 1]
BACKGROUND: Chloroplast genome variations have been detected, despite its overall conserved structure, which has been valuable for plant population genetics and evolutionary studies. Here, we described chloroplast variation architecture of 383 rice accessions from diverse regions and different ecotypes, in order to mine the rice chloroplast genome variation architecture and phylogenetic. RESULTS: A total of 3677 variations across the chloroplast genome were identified with an average density of 27.33 per kb, in which wild rice showing a higher variation density than cultivated groups. Chloroplast genome nucleotide diversity investigation indicated a high degree of diversity in wild rice than in cultivated rice. Genetic distance estimation revealed that African rice showed a low level of breeding and connectivity with the Asian rice, suggesting the big distinction of them. Population structure and principal component analysis revealed the existence of clear clustering of African and Asian rice, as well as the indica and japonica in Asian cultivated rice. Phylogenetic analysis based on maximum likelihood and Bayesian inference methods and the population splits test suggested and supported the independent origins of indica and japonica within Asian cultivated rice. In addition, the African cultivated rice was thought to be domesticated differently from Asian cultivated rice. CONCLUSIONS: The chloroplast genome variation architecture in Asian and African rice are different, as well as within Asian or African rice. Wild rice and cultivated rice also have distinct nucleotide diversity or genetic distance. In chloroplast level, the independent origins of indica and japonica within Asian cultivated rice were suggested and the African cultivated rice was thought to be domesticated differently from Asian cultivated rice. These results will provide more candidate evidence for the further rice chloroplast genomic and evolution studies.
DOI:10.1038/s41588-019-0401-3URLPMID:31036963 [��������: 1]
We report a map of 4.97 million single-nucleotide polymorphisms of the chickpea from whole-genome resequencing of 429 lines sampled from 45 countries. We identified 122 candidate regions with 204 genes under selection during chickpea breeding. Our data suggest the Eastern Mediterranean as the primary center of origin and migration route of chickpea from the Mediterranean/Fertile Crescent to Central Asia, and probably in parallel from Central Asia to East Africa (Ethiopia) and South Asia (India). Genome-wide association studies identified 262 markers and several candidate genes for 13 traits. Our study establishes a foundation for large-scale characterization of germplasm and population genomics, and a resource for trait dissection, accelerating genetic gains in future chickpea breeding.
DOI:10.1016/j.ajhg.2011.11.029URLPMID:22243964 [��������: 1]
The past five years have seen many scientific and biological discoveries made through the experimental design of genome-wide association studies (GWASs). These studies were aimed at detecting variants at genomic loci that are associated with complex traits in the population and, in particular, at detecting associations between common single-nucleotide polymorphisms (SNPs) and common diseases such as heart disease, diabetes, auto-immune diseases, and psychiatric disorders. We start by giving a number of quotes from scientists and journalists about perceived problems with GWASs. We will then briefly give the history of GWASs and focus on the discoveries made through this experimental design, what those discoveries tell us and do not tell us about the genetics and biology of complex traits, and what immediate utility has come out of these studies. Rather than giving an exhaustive review of all reported findings for all diseases and other complex traits, we focus on the results for auto-immune diseases and metabolic diseases. We return to the perceived failure or disappointment about GWASs in the concluding section.
DOI:10.1016/j.ajhg.2017.06.005URLPMID:28686856 [��������: 1]
Application of the experimental design of genome-wide association studies (GWASs) is now 10 years old (young), and here we review the remarkable range of discoveries it has facilitated in population and complex-trait genetics, the biology of diseases, and translation toward new therapeutics. We predict the likely discoveries in the next 10 years, when GWASs will be based on millions of samples with array data imputed to a large fully sequenced reference panel and on hundreds of thousands of samples with whole-genome sequencing data.
DOI:10.1016/j.molp.2016.04.018URLPMID:27179918 [��������: 1]
Low-coverage whole-genome sequencing is an effective strategy for genome-wide association studies in humans, due to the availability of large reference panels for genotype imputation. However, it is unclear whether this strategy can be utilized in other species without reference panels. Using simulations, we show that this approach is even more relevant in inbred species such as rice (Oryza sativa L.), which are effectively haploid, allowing easy haplotype construction and imputation-based genotype calling, even without the availability of large reference panels. We sequenced 203 rice varieties with well-characterized phenotypes from the United States Department of Agriculture Rice Mini-Core Collection at an average depth of 1.5x and used the data for mapping three traits. For the first two traits, amylose content and seed length, our approach leads to direct identification of the previously identified causal SNPs in the major-effect loci. For the third trait, pericarp color, an important trait underwent selection during domestication, we identified a new major-effect locus. Although known loci can explain color variation in the varieties of two main subspecies of Asian domesticated rice, japonica and indica, the new locus identified is unique to another domesticated rice subgroup, aus, and together with existing loci, can fully explain the major variation in pericarp color in aus. Our discovery of a unique genetic basis of white pericarp in aus provides an example of convergent evolution during rice domestication and suggests that aus may have a domestication history independent of japonica and indica.
DOI:10.1093/nar/gkq603URLPMID:20601685 [��������: 1]
High-throughput sequencing platforms are generating massive amounts of genetic variation data for diverse genomes, but it remains a challenge to pinpoint a small subset of functionally important variants. To fill these unmet needs, we developed the ANNOVAR tool to annotate single nucleotide variants (SNVs) and insertions/deletions, such as examining their functional consequence on genes, inferring cytogenetic bands, reporting functional importance scores, finding variants in conserved regions, or identifying variants reported in the 1000 Genomes Project and dbSNP. ANNOVAR can utilize annotation databases from the UCSC Genome Browser or any annotation data set conforming to Generic Feature Format version 3 (GFF3). We also illustrate a 'variants reduction' protocol on 4.7 million SNVs and indels from a human genome, including two causal mutations for Miller syndrome, a rare recessive disease. Through a stepwise procedure, we excluded variants that are unlikely to be causal, and identified 20 candidate genes including the causal gene. Using a desktop computer, ANNOVAR requires approximately 4 min to perform gene-based annotation and approximately 15 min to perform variants reduction on 4.7 million variants, making it practical to handle hundreds of human genomes in a day. ANNOVAR is freely available at http://www.openbioinformatics.org/annovar/.
DOI:10.1016/j.semcancer.2018.04.008URLPMID:29727703 [��������: 1]
Genome-wide association studies (GWAS) detect common genetic variants associated with complex disorders. With their comprehensive coverage of common single nucleotide polymorphisms and comparatively low cost, GWAS are an attractive tool in the clinical and commercial genetic testing. This review introduces the pipeline of statistical methods used in GWAS analysis, from data quality control, association tests, population structure control, interaction effects and results visualization, through to post-GWAS validation methods and related issues.
URLPMID:30858595 [��������: 1]
DOI:10.1007/s00122-019-03473-3URLPMID:31720701 [��������: 4]
Genome-wide association studies (GWAS), genetic surveys of the whole genome to detect variants associated with a trait in natural populations, are a powerful approach for dissecting complex traits. This genetic mapping approach has been applied in rice over the last 10 years. During the last decade, GWAS was used to identify the loci underlying tens of rice traits, and several important genes were detected in GWAS and further confirmed in follow-up functional experiments. In this review, we present an overview of the whole process in a typical GWAS, including population design, genotyping, phenotyping and analysis methods. Recent advances in rice GWAS are also provided, including several examples of the functional characterization of candidate genes. The possible breakthroughs of rice GWAS in the next decade are discussed with regard to their application in breeding, the consideration of epistatic interactions and in-depth functional annotations of DNA elements and genetic variants throughout the rice genome.
DOI:10.1371/journal.pone.0107684URLPMID:25247812 [��������: 1]
Genome-Wide Association Studies shed light on the identification of genes underlying human diseases and agriculturally important traits. This potential has been shadowed by false positive findings. The Mixed Linear Model (MLM) method is flexible enough to simultaneously incorporate population structure and cryptic relationships to reduce false positives. However, its intensive computational burden is prohibitive in practice, especially for large samples. The newly developed algorithm, FaST-LMM, solved the computational problem, but requires that the number of SNPs be less than the number of individuals to derive a rank-reduced relationship. This restriction potentially leads to less statistical power when compared to using all SNPs. We developed a method to extract a small subset of SNPs and use them in FaST-LMM. This method not only retains the computational advantage of FaST-LMM, but also remarkably increases statistical power even when compared to using the entire set of SNPs. We named the method SUPER (Settlement of MLM Under Progressively Exclusive Relationship) and made it available within an implementation of the GAPIT software package.
DOI:10.1016/j.molp.2015.02.014URLPMID:25747843 [��������: 1]
Chlorophyll content is one of the most important physiological traits as it is closely related to leaf photosynthesis and crop yield potential. So far, few genes have been reported to be involved in natural variation of chlorophyll content in rice (Oryza sativa) and the extent of variations explored is very limited. We conducted a genome-wide association study (GWAS) using a diverse worldwide collection of 529 O. sativa accessions. A total of 46 significant association loci were identified. Three F2 mapping populations with parents selected from the association panel were tested for validation of GWAS signals. We clearly demonstrated that Grain number, plant height, and heading date7 (Ghd7) was a major locus for natural variation of chlorophyll content at the heading stage by combining evidence from near-isogenic lines and transgenic plants. The enhanced expression of Ghd7 decreased the chlorophyll content, mainly through down-regulating the expression of genes involved in the biosynthesis of chlorophyll and chloroplast. In addition, Narrow leaf1 (NAL1) corresponded to one significant association region repeatedly detected over two years. We revealed a high degree of polymorphism in the 5' UTR and four non-synonymous SNPs in the coding region of NAL1, and observed diverse effects of the major haplotypes. The loci or candidate genes identified would help to fine-tune and optimize the antenna size of canopies in rice breeding.
DOI:10.1186/s12864-017-4160-1URLPMID:29115920 [��������: 1]
DOI:10.1038/ncomms4438URLPMID:24633423 [��������: 1]
DOI:10.1038/s41588-019-0546-0URLPMID:31873299 [��������: 2]
We conducted a large-scale genome-wide association study evaluation of 683 common bean accessions, including landraces and breeding lines, grown over 3 years and in four environments across China, ranging in latitude from 18.23 degrees to 45.75 degrees N, with different planting dates and abiotic or biotic stresses. A total of 505 loci were associated with yield components, of which seed size, flowering time and harvest maturity traits were stable across years and environments. Some loci aligned with candidate genes controlling these traits. Yield components were observed to have strong associations with a gene-rich region on the long arm of chromosome 1. Manipulation of seed size, through selection of seed length versus seed width and height, was deemed possible, providing a genome-based means to select for important yield components. This study shows that evaluation of large germplasm collections across north-south geographic clines is useful in the detection of marker associations that determine grain yield in pulses.
DOI:10.1016/j.molp.2017.08.012URLPMID:28866081 [��������: 1]
DOI:10.1016/j.molp.2016.12.008URLPMID:28039028 [��������: 2]
Genome-wide association study (GWAS) has become a widely accepted strategy for decoding genotype-phenotype associations in many species thanks to advances in next-generation sequencing (NGS) technologies. Maize is an ideal crop for GWAS and significant progress has been made in the last decade. This review summarizes current GWAS efforts in maize functional genomics research and discusses future prospects in the omics era. The general goal of GWAS is to link genotypic variations to corresponding differences in phenotype using the most appropriate statistical model in a given population. The current review also presents perspectives for optimizing GWAS design and analysis. GWAS analysis of data from RNA, protein, and metabolite-based omics studies is discussed, along with new models and new population designs that will identify causes of phenotypic variation that have been hidden to date. The joint and continuous efforts of the whole community will enhance our understanding of maize quantitative traits and boost crop molecular breeding designs.
DOI:10.1073/pnas.1515919112URLPMID:26358652 [��������: 2]
Intensive rice breeding over the past 50 y has dramatically increased productivity especially in the indica subspecies, but our knowledge of the genomic changes associated with such improvement has been limited. In this study, we analyzed low-coverage sequencing data of 1,479 rice accessions from 73 countries, including landraces and modern cultivars. We identified two major subpopulations, indica I (IndI) and indica II (IndII), in the indica subspecies, which corresponded to the two putative heterotic groups resulting from independent breeding efforts. We detected 200 regions spanning 7.8% of the rice genome that had been differentially selected between IndI and IndII, and thus referred to as breeding signatures. These regions included large numbers of known functional genes and loci associated with important agronomic traits revealed by genome-wide association studies. Grain yield was positively correlated with the number of breeding signatures in a variety, suggesting that the number of breeding signatures in a line may be useful for predicting agronomic potential and the selected loci may provide targets for rice improvement.
DOI:10.1371/journal.pgen.1004573URLPMID:25211220 [��������: 1]
Association mapping is a powerful approach for dissecting the genetic architecture of complex quantitative traits using high-density SNP markers in maize. Here, we expanded our association panel size from 368 to 513 inbred lines with 0.5 million high quality SNPs using a two-step data-imputation method which combines identity by descent (IBD) based projection and k-nearest neighbor (KNN) algorithm. Genome-wide association studies (GWAS) were carried out for 17 agronomic traits with a panel of 513 inbred lines applying both mixed linear model (MLM) and a new method, the Anderson-Darling (A-D) test. Ten loci for five traits were identified using the MLM method at the Bonferroni-corrected threshold -log10 (P) >5.74 (alpha=1). Many loci ranging from one to 34 loci (107 loci for plant height) were identified for 17 traits using the A-D test at the Bonferroni-corrected threshold -log10 (P) >7.05 (alpha=0.05) using 556809 SNPs. Many known loci and new candidate loci were only observed by the A-D test, a few of which were also detected in independent linkage analysis. This study indicates that combining IBD based projection and KNN algorithm is an efficient imputation method for inferring large missing genotype segments. In addition, we showed that the A-D test is a useful complement for GWAS analysis of complex quantitative traits. Especially for traits with abnormal phenotype distribution, controlled by moderate effect loci or rare variations, the A-D test balances false positives and statistical power. The candidate SNPs and associated genes also provide a rich resource for maize genetics and breeding.
DOI:10.1038/ng.3596URLPMID:27322545 [��������: 1]
A genome-wide association study (GWAS) can be a powerful tool for the identification of genes associated with agronomic traits in crop species, but it is often hindered by population structure and the large extent of linkage disequilibrium. In this study, we identified agronomically important genes in rice using GWAS based on whole-genome sequencing, followed by the screening of candidate genes based on the estimated effect of nucleotide polymorphisms. Using this approach, we identified four new genes associated with agronomic traits. Some genes were undetectable by standard SNP analysis, but we detected them using gene-based association analysis. This study provides fundamental insights relevant to the rapid identification of genes associated with agronomic traits using GWAS and will accelerate future efforts aimed at crop improvement.
DOI:10.1016/j.copbio.2006.02.003URLPMID:16504497 [��������: 1]
Association mapping, a high-resolution method for mapping quantitative trait loci based on linkage disequilibrium, holds great promise for the dissection of complex genetic traits. The recent assembly and characterization of maize association mapping panels, development of improved statistical methods, and successful association of candidate genes have begun to realize the power of candidate-gene association mapping. Although the complexity of the maize genome poses several significant challenges to the application of association mapping, the ongoing genome sequencing project will ultimately allow for a thorough genome-wide examination of nucleotide polymorphism-trait association.
DOI:10.1038/ng1702URLPMID:16380716 [��������: 1]
As population structure can result in spurious associations, it has constrained the use of association studies in human and plant genetics. Association mapping, however, holds great promise if true signals of functional association can be separated from the vast number of false signals generated by population structure. We have developed a unified mixed-model approach to account for multiple levels of relatedness simultaneously as detected by random genetic markers. We applied this new approach to two samples: a family-based sample of 14 human families, for quantitative gene expression dissection, and a sample of 277 diverse maize inbred lines with complex familial relationships and population structure, for quantitative trait dissection. Our method demonstrates improved control of both type I and type II error rates over other methods. As this new method crosses the boundary between family-based and structured association samples, it provides a powerful complement to currently available methods for association mapping.
DOI:10.1093/bioinformatics/bty875URLPMID:30321304 [��������: 1]
MOTIVATION: Linkage disequilibrium (LD) decay is of great interest in population genetic studies. However, no tool is available now to do LD decay analysis from variant call format (VCF) files directly. In addition, generation of pair-wise LD measurements for whole genome SNPs usually resulting in large storage wasting files. RESULTS: We developed PopLDdecay, an open source software, for LD decay analysis from VCF files. It is fast and is able to handle large number of variants from sequencing data. It is also storage saving by avoiding exporting pair-wise results of LD measurements. Subgroup analyses are also supported. AVAILABILITY AND IMPLEMENTATION: PopLDdecay is freely available at https://github.com/BGI-shenzhen/PopLDdecay.
DOI:10.3390/ijms20235915URL [��������: 1]
DOI:10.1186/s12864-016-3041-3URLPMID:27581193 [��������: 1]
BACKGROUND: Maize breeding germplasm used in Southwest China has high complexity because of the diverse ecological features of this area. In this study, the population structure, genetic diversity, and linkage disequilibrium decay distance of 362 important inbred lines collected from the breeding program of Southwest China were characterized using the MaizeSNP50 BeadChip with 56,110 single nucleotide polymorphisms (SNPs). RESULTS: With respect to population structure, two (Tropical and Temperate), three (Tropical, Stiff Stalk and non-Stiff Stalk), four [Tropical, group A germplasm derived from modern U.S. hybrids (PA), group B germplasm derived from modern U.S. hybrids (PB) and Reid] and six (Tropical, PB, Reid, Iowa Stiff Stalk Synthetic, PA and North) subgroups were identified. With increasing K value, the Temperate group showed pronounced hierarchical structure with division into further subgroups. The Genetic Diversity of each group was also estimated, and the Tropical group was more diverse than the Temperate group. Seven low-genetic-diversity and one high-genetic-diversity regions were collectively identified in the Temperate, Tropical groups, and the entire panel. SNPs with significant variation in allele frequency between the Tropical and Temperate groups were also evaluated. Among them, a region located at 130 Mb on Chromosome 2 showed the highest genetic diversity, including both number of SNPs with significant variation and the ratio of significant SNPs to total SNPs. Linkage disequilibrium decay distance in the Temperate group was greater (2.5-3 Mb) than that in the entire panel (0.5-0.75 Mb) and the Tropical group (0.25-0.5 Mb). A large region at 30-120 Mb of Chromosome 7 was concluded to be a region conserved during the breeding process by comparison between S37, which was considered a representative tropical line in Southwest China, and its 30 most similar derived lines. CONCLUSIONS: For the panel covered most of widely used inbred lines in Southwest China, this work representatively not only illustrates the foundation and evolution trend of maize breeding resource as a theoretical reference for the improvement of heterosis, but also provides plenty of information for genetic researches such as genome-wide association study and marker-assisted selection in the future.
DOI:10.3389/fpls.2019.00100URLPMID:30804969 [��������: 1]
DOI:10.1038/ng.546URLPMID:20208535 [��������: 1]
Mixed linear model (MLM) methods have proven useful in controlling for population structure and relatedness within genome-wide association studies. However, MLM-based methods can be computationally challenging for large datasets. We report a compression approach, called 'compressed MLM', that decreases the effective sample size of such datasets by clustering individuals into groups. We also present a complementary approach, 'population parameters previously determined' (P3D), that eliminates the need to re-compute variance components. We applied these two methods both independently and combined in selected genetic association datasets from human, dog and maize. The joint implementation of these two methods markedly reduced computing time and either maintained or improved statistical power. We used simulations to demonstrate the usefulness in controlling for substructure in genetic association datasets for a range of species and genetic architectures. We have made these methods available within an implementation of the software program TASSEL.
DOI:10.1038/NMETH.2848URL [��������: 2]
Multivariate linear mixed models (mvLMMs) are powerful tools for testing associations between single-nucleotide polymorphisms and multiple correlated phenotypes while controlling for population stratification in genome-wide association studies. We present efficient algorithms in the genome-wide efficient mixed model association (GEMMA) software for fitting mvLMMs and computing likelihood ratio tests. These algorithms offer improved computation speed, power and P-value calibration over existing methods, and can deal with more than two phenotypes.
DOI:10.1016/j.molp.2018.11.010URLPMID:30543995 [��������: 1]
DOI:10.1038/nbt.3096URLPMID:25643055 [��������: 1]
Understanding soybean (Glycine max) domestication and improvement at a genetic level is important to inform future efforts to further improve a crop that provides the world's main source of oilseed. We detect 230 selective sweeps and 162 selected copy number variants by analysis of 302 resequenced wild, landrace and improved soybean accessions at >11x depth. A genome-wide association study using these new sequences reveals associations between 10 selected regions and 9 domestication or improvement traits, and identifies 13 previously uncharacterized loci for agronomic traits including oil content, plant height and pubescence form. Combined with previous quantitative trait loci (QTL) information, we find that, of the 230 selected regions, 96 correlate with reported oil QTLs and 21 contain fatty acid biosynthesis genes. Moreover, we observe that some traits and loci are associated with geographical regions, which shows that soybean populations are structured geographically. This study provides resources for genomics-enabled improvements in soybean breeding.
DOI:10.1016/j.cell.2017.12.019URLPMID:29328914 [��������: 3]
Humans heavily rely on dozens of domesticated plant species that have been further improved through intensive breeding. To evaluate how breeding changed the tomato fruit metabolome, we have generated and analyzed a dataset encompassing genomes, transcriptomes, and metabolomes from hundreds of tomato genotypes. The combined results illustrate how breeding globally altered fruit metabolite content. Selection for alleles of genes associated with larger fruits altered metabolite profiles as a consequence of linkage with nearby genes. Selection of five major loci reduced the accumulation of anti-nutritional steroidal glycoalkaloids in ripened fruits, rendering the fruit more edible. Breeding for pink tomatoes modified the content of over 100 metabolites. The introgression of resistance genes from wild relatives in cultivars also resulted in major and unexpected metabolic changes. The study reveals a multi-omics view of the metabolic breeding history of tomato, as well as provides insights into metabolome-assisted breeding and plant biology.
Principals about principal components in statistical genetics
2
2019
... ���ɷַ���(principal component analysis, PCA)��Ⱥ��ṹ������������֮һ.PCA����Ҫ���������ų�Ⱥ���е��쳣����, �Ի����ͽ�ά, �Ӷ�����Ⱥ��ṹ(
... PCA�����ɱ���1-10�����ɷ������GWAS���������л������ؽ���, һ��ѡȡ�ܹ����ͱ�����> 5%�����ɷ�����������������.���ڲ�ͬ��GWAS�о�����Ҳ��ͨ��PC-Finder����Tracy-Widomͳ����ȷ�����ʵ����ɷָ���(
Fast model- based estimation of ancestry in unrelated individuals
2
2009
... ͨ��PCA���Ŵ���ǽ�άͶӰ����ֱ�ӿ��ӻ�Ⱥ��ṹ, Ȼ��, ��ʱ�����������ͶӰ���겻�ܽ�������ȫ�����ȹ���(
... ADMIXTURE (
The genetic architecture of barley plant stature
1
2016
... ������о�ͬʱ����PCA����ʽ����ģ��2�ַ���������Ⱥ��ṹ, �Ա�֤����Ŀɿ���(
GWAS: fast-forwarding gene identification and characterization in temperate cereals: lessons from barley��a review
4
2020
... ��������Ӱ��GWAS��������λ�����Ŀ(
... ������о�ͬʱ����PCA����ʽ����ģ��2�ַ���������Ⱥ��ṹ, �Ա�֤����Ŀɿ���(
... ���ڵ��������̬��(SNP)��ǵ���Ҫ����(
... Ϊ�˿��Ƽ�����, ɸѡ������������Ĺ���λ��, ��Ҫͨ�����ؼ��������ȷ����������������ֵ.��ֵ���趨ԭ�������о����֡�Ⱥ���Լ��о�Ŀ���ܲ��ɷ�(
Genomewide rapid association using mixed model and regression, a fast and simple method for genomewide pedigree-based quantitative trait loci association analysis
1
2007
... �ñ��������ģ�ʹ�������������Ч�ʵ�, ����ʱ�䳤.Ϊ�����������ٶ�, ���ټ�����, EMMA�������ȳ���ͨ����������, ����������ʱ��(
Genome-wide association analysis reveals different genetic control in panicle architecture between Indica and Japonica rice
1
2016
... �ñ��������ģ�ʹ�������������Ч�ʵ�, ����ʱ�䳤.Ϊ�����������ٶ�, ���ټ�����, EMMA�������ȳ���ͨ����������, ����������ʱ��(
Haploview, analysis and visualization of LD and haplotype maps
1
2005
... LD˥����������������PLINK��Haploview (
Genome-wide association study reveals novel genomic regions associated with 10 grain minerals in synthetic hexaploid wheat
1
2018
... ����������Ȼ��������������ٶ�, ���ǶԼ��Ч���ĸ�������(
Trimmomatic, a flexible trimmer for Illumina sequence data
1
2014
... ����Trimmomatic (
TASSEL: software for association mapping of complex traits in diverse samples
1
2007
... ���ڲ�ͬ���Ŵ�ѧ����ͳ��ѧ����, ӿ�ֳ��ڶ�������ģ�ͷ���.GWAS��Ҫ�ۺϿ����������������ٶȡ�ͳ��Ч����ʹ�ñ���Ե�����, ѡ����ʵķ���.������������ﵽ��������������Զ����������ij���Ⱥ��GWAS�о�, ����FaST-LMM�������������Դ��, �����ٶȿ�.���ڱ���ܶȴ��GWAS�о�, �ɲ���EMMAX�������з���.���ھ��л����������������ͱ���ܶȴ��������GWAS�о�, �ɲ���SUPER��FarmCPU��BLINK�������з���, ��Щ���������ٶȿ�, �ɼ�������֪λ��.Ŀǰ, Ϊ��ȷ�������ȷ�ԺͿɿ���, ����GWASͬʱ���ö��ģ�������з���, �����Ƚ�ɸѡ�����Ž�(
Efficient set tests for the genetic analysis of correlated traits
1
2015
... ��ǰ����Ŀ���Ѿ��ӵ�һ��״����ת��߲������ʡ������Ϳ�����ۺ���״���ձ����, ��������˶�������״���ϵĻ��ģ�ͷ���, ��Ҫ����MTMM (
Metabolite-based genome-wide association study enables dissection of the flavonoid decoration pathway of wheat kernels
2
2020
... �ñ��������ģ�ʹ�������������Ч�ʵ�, ����ʱ�䳤.Ϊ�����������ٶ�, ���ټ�����, EMMA�������ȳ���ͨ����������, ����������ʱ��(
... ������, �о���Ա����GWAS�����ڶ�ֲ�︴��������״�о��м����������ؼ�λ��, ������Щ��������λ����ܽ��Ͳ��ֱ��ͱ���, ��ȱʧ�Ŵ�����������Ȼ�ǵ�ǰ�����Ŵ�ѧ�о����ѵ�.����, GWAS����ͳ��Ч�������Լ�������һ�������ڶ���й��ܵĵ�λ�����Ⱥ���е�Ч���������(
Genetic basis of variation in rice seed storage protein (Albumin, Globulin, Prolamin, and Glutelin) content revealed by genome-wide association analysis
1
2018
... �ñ��������ģ�ʹ�������������Ч�ʵ�, ����ʱ�䳤.Ϊ�����������ٶ�, ���ټ�����, EMMA�������ȳ���ͨ����������, ����������ʱ��(
The variant call format and VCFtools
1
2011
... ����1: VCFtools (
Bioinformatics challenges in genome-wide association studies (GWAS)
2
2014
... Ϊ�˿��Ƽ�����, ɸѡ������������Ĺ���λ��, ��Ҫͨ�����ؼ��������ȷ����������������ֵ.��ֵ���趨ԭ�������о����֡�Ⱥ���Լ��о�Ŀ���ܲ��ɷ�(
... ������, �о���Ա����GWAS�����ڶ�ֲ�︴��������״�о��м����������ؼ�λ��, ������Щ��������λ����ܽ��Ͳ��ֱ��ͱ���, ��ȱʧ�Ŵ�����������Ȼ�ǵ�ǰ�����Ŵ�ѧ�о����ѵ�.����, GWAS����ͳ��Ч�������Լ�������һ�������ڶ���й��ܵĵ�λ�����Ⱥ���е�Ч���������(
A framework for variation discovery and genotyping using next-generation DNA sequencing data
1
2011
... ʹ��GATK (
Genome-wide association studies reveal that members of bHLH subfamily 16 share a conserved function in regulating flag leaf angle in rice ( Oryza sativa)
1
2018
... �ñ��������ģ�ʹ�������������Ч�ʵ�, ����ʱ�䳤.Ϊ�����������ٶ�, ���ټ�����, EMMA�������ȳ���ͨ����������, ����������ʱ��(
Spatiotemporal distribution of phenolamides and the genetics of natural variation of hydroxycinnamoyl spermidine in rice
1
2015
... �ñ��������ģ�ʹ�������������Ч�ʵ�, ����ʱ�䳤.Ϊ�����������ٶ�, ���ټ�����, EMMA�������ȳ���ͨ����������, ����������ʱ��(
Resequencing of 243 diploid cotton accessions based on an updated A genome identifies the genetic basis of key agronomic traits
2
2018
... ȫ�������ز����ѹ㷺Ӧ��������(Citrullus lanatus) (
... �ñ��������ģ�ʹ�������������Ч�ʵ�, ����ʱ�䳤.Ϊ�����������ٶ�, ���ټ�����, EMMA�������ȳ���ͨ����������, ����������ʱ��(
Genome re-sequencing reveals the history of apple and supports a two-stage model for fruit enlargement
1
2017
... ȫ�������ز����ѹ㷺Ӧ��������(Citrullus lanatus) (
A concise review on multi-omics data integration for terroir analysis in Vitis vinifera
1
2017
... ������, �о���Ա����GWAS�����ڶ�ֲ�︴��������״�о��м����������ؼ�λ��, ������Щ��������λ����ܽ��Ͳ��ֱ��ͱ���, ��ȱʧ�Ŵ�����������Ȼ�ǵ�ǰ�����Ŵ�ѧ�о����ѵ�.����, GWAS����ͳ��Ч�������Լ�������һ�������ڶ���й��ܵĵ�λ�����Ⱥ���е�Ч���������(
Inference of population structure using multilocus genotype data: linked loci and correlated allele frequencies
1
2003
... ͨ��PCA���Ŵ���ǽ�άͶӰ����ֱ�ӿ��ӻ�Ⱥ��ṹ, Ȼ��, ��ʱ�����������ͶӰ���겻�ܽ�������ȫ�����ȹ���(
Genome-wide association studies dissect the genetic networks underlying agronomical traits in soybean
2
2017
... ȫ�������ز����ѹ㷺Ӧ��������(Citrullus lanatus) (
... �ñ��������ģ�ʹ�������������Ч�ʵ�, ����ʱ�䳤.Ϊ�����������ٶ�, ���ټ�����, EMMA�������ȳ���ͨ����������, ����������ʱ��(
Efficient multiple-trait association and estimation of genetic correlation using the matrix-variate linear mixed model
1
2015
... ��ǰ����Ŀ���Ѿ��ӵ�һ��״����ת��߲������ʡ������Ϳ�����ۺ���״���ձ����, ��������˶�������״���ϵĻ��ģ�ͷ���, ��Ҫ����MTMM (
ORegAnno: an open- access community-driven resource for regulatory annotation
1
2008
... ���ڵ��������̬��(SNP)��ǵ���Ҫ����(
Methods and tools in genome-wide association studies
1
2018
... ���������ǹ��������Ļ���.Ϊ�˻�ÿɿ��ı�������, ͨ����Ҫ��������ظ��������������.�ӹ��������ķ�������, һ��Ҫ���������Ϊ��������, ���������о�����, ��ɢ���ݺͷ����������ض�����µ�GWAS��Ҳ���Ի�ýϺõĹ������.�������Ͷ��ڹ�������ͳ�Ʒ�����ѡ������ҪӰ��(
Resequencing of 414 cultivated and wild watermelon accessions identifies selection for fruit quality traits
1
2019
... ȫ�������ز����ѹ㷺Ӧ��������(Citrullus lanatus) (
BLINK: a package for the next level of genome- wide association studies with both individuals and markers in the millions
1
2019
... ����������Ȼ��������������ٶ�, ���ǶԼ��Ч���ĸ�������(
Genomic analysis of hybrid rice varieties reveals numerous superior alleles that contribute to heterosis
1
2015
... ���������ǹ��������Ļ���.Ϊ�˻�ÿɿ��ı�������, ͨ����Ҫ��������ظ��������������.�ӹ��������ķ�������, һ��Ҫ���������Ϊ��������, ���������о�����, ��ɢ���ݺͷ����������ض�����µ�GWAS��Ҳ���Ի�ýϺõĹ������.�������Ͷ��ڹ�������ͳ�Ʒ�����ѡ������ҪӰ��(
Genomic architecture of heterosis for yield traits in rice
1
2016
... �ñ��������ģ�ʹ�������������Ч�ʵ�, ����ʱ�䳤.Ϊ�����������ٶ�, ���ټ�����, EMMA�������ȳ���ͨ����������, ����������ʱ��(
Genome-wide association study of flowering time and grain yield traits in a worldwide collection of rice germplasm
1
2011
... ��������Ӱ��GWAS��������λ�����Ŀ(
Inferring weak population structure with the assistance of sample group information
1
2009
... ͨ��PCA���Ŵ���ǽ�άͶӰ����ֱ�ӿ��ӻ�Ⱥ��ṹ, Ȼ��, ��ʱ�����������ͶӰ���겻�ܽ�������ȫ�����ȹ���(
Sunflower pan-genome analysis shows that hybridization altered gene content and disease resistance
1
2019
... �ñ��������ģ�ʹ�������������Ч�ʵ�, ����ʱ�䳤.Ϊ�����������ٶ�, ���ټ�����, EMMA�������ȳ���ͨ����������, ����������ʱ��(
Recent developments in statistical methods for GWAS and high-throughput sequencing association studies of complex traits
1
2018
... Ϊ�˿��Ƽ�����, ɸѡ������������Ĺ���λ��, ��Ҫͨ�����ؼ��������ȷ����������������ֵ.��ֵ���趨ԭ�������о����֡�Ⱥ���Լ��о�Ŀ���ܲ��ɷ�(
Maize pan-transcriptome provides novel insights into genome complexity and quantitative trait variation
1
2016
... ������, �о���Ա����GWAS�����ڶ�ֲ�︴��������״�о��м����������ؼ�λ��, ������Щ��������λ����ܽ��Ͳ��ֱ��ͱ���, ��ȱʧ�Ŵ�����������Ȼ�ǵ�ǰ�����Ŵ�ѧ�о����ѵ�.����, GWAS����ͳ��Ч�������Լ�������һ�������ڶ���й��ܵĵ�λ�����Ⱥ���е�Ч���������(
Estimation of a significance threshold for genome-wide association studies
1
2019
... Ϊ�˿��Ƽ�����, ɸѡ������������Ĺ���λ��, ��Ҫͨ�����ؼ��������ȷ����������������ֵ.��ֵ���趨ԭ�������о����֡�Ⱥ���Լ��о�Ŀ���ܲ��ɷ�(
Genome-wide association mapping of canopy wilting in diverse soybean genotypes
1
2017
... ����������Ȼ��������������ٶ�, ���ǶԼ��Ч���ĸ�������(
Variance component model to account for sample structure in genome-wide association studies
1
2010
... �ñ��������ģ�ʹ�������������Ч�ʵ�, ����ʱ�䳤.Ϊ�����������ٶ�, ���ټ�����, EMMA�������ȳ���ͨ����������, ����������ʱ��(
Efficient control of population structure in model organism association mapping
1
2008
... �ñ��������ģ�ʹ�������������Ч�ʵ�, ����ʱ�䳤.Ϊ�����������ٶ�, ���ټ�����, EMMA�������ȳ���ͨ����������, ����������ʱ��(
A large nested association mapping population for breeding and quantitative trait locus mapping in Ethiopian durum wheat
1
2019
... ����������Ȼ��������������ٶ�, ���ǶԼ��Ч���ĸ�������(
A mixed-model approach for genome-wide association studies of correlated traits in structured populations
1
2012
... ��ǰ����Ŀ���Ѿ��ӵ�һ��״����ת��߲������ʡ������Ϳ�����ۺ���״���ձ����, ��������˶�������״���ϵĻ��ģ�ͷ���, ��Ҫ����MTMM (
Dysregulation of expression correlates with rare-allele burden and fitness loss in maize
1
2018
... ������, �о���Ա����GWAS�����ڶ�ֲ�︴��������״�о��м����������ؼ�λ��, ������Щ��������λ����ܽ��Ͳ��ֱ��ͱ���, ��ȱʧ�Ŵ�����������Ȼ�ǵ�ǰ�����Ŵ�ѧ�о����ѵ�.����, GWAS����ͳ��Ч�������Լ�������һ�������ڶ���й��ܵĵ�λ�����Ⱥ���е�Ч���������(
Transcriptome-wide association supplements genome-wide association in Zea mays
1
2019
... �ñ��������ģ�ʹ�������������Ч�ʵ�, ����ʱ�䳤.Ϊ�����������ٶ�, ���ټ�����, EMMA�������ȳ���ͨ����������, ����������ʱ��(
Genomic resources for improving food legume crops
1
2012
... ��������Ӱ��GWAS��������λ�����Ŀ(
Distinct genetic architectures for phenotype means and plasticities in Zea mays
1
2017
... ����������Ȼ��������������ٶ�, ���ǶԼ��Ч���ĸ�������(
Ultrafast and memory-efficient alignment of short DNA sequences to the human genome
1
2009
... ����BWA-MEM (
SNPhylo: a pipeline to construct a phylogenetic tree from huge SNP data
1
2014
... Ϊ�˽���Ⱥ��ṹ�ͼ�ϵ��Ե��ϵ��ȫ���������������Ӱ��, ��Ҫ����SNP��Ϣ���������Ⱥ��ṹ��Q����ͼ�ϵ��Ե����K����.����CDS����SNP, ����PHYLIP (http://evolution.genetics.Wa- shington.edu/phylip.htm)��MEGA (
Numerous genetic loci identified for drought tolerance in the maize nested association mapping populations
1
2016
... ����������Ȼ��������������ٶ�, ���ǶԼ��Ч���ĸ�������(
Genetic architecture of phenotypic means and plasticities of kernel size and weight in maize
1
2019
... ����������Ȼ��������������ٶ�, ���ǶԼ��Ч���ĸ�������(
A statistical framework for SNP calling, mutation discovery, association mapping and population genetical parameter estimation from sequencing data
1
2011
... ʹ��GATK (
Aligning sequence reads, clone sequences and assembly contigs with BWA-MEM
1
2013
... ����BWA-MEM (
Enrichment of statistical power for genome-wide association studies
1
2014
... ����������Ȼ��������������ٶ�, ���ǶԼ��Ч���ĸ�������(
Analysis of genetic architecture and favorable allele usage of agronomic traits in a large collection of Chinese rice accessions
3
2020
... ȫ�������������(genome-wide association study, GWAS)��һ��ͨ������ȫ�������Ŵ��������ͱ������������������λ����״��ص��Ŵ�λ��, ��Ⱥ��ˮƽ�Ͻ�����״�Ŵ������ķ���.Ӱ��GWAS�Ĺؼ�����֮һ��Ⱥ��ˮƽ����������ƽ��(linkage disequilibrium, LD).�����Ǵ��LD����Ҫ����(
... �����Ի���ƽ���������7����721��ˮ������(
... ͨ��ȫ��������������ȿ��Զ�λ��ijЩ��֪����Ҫ����, Ҳ�ܹ������µ�δ֪λ��.����EMMAXģ��, ��PCA��ǰ�������ɷ�(������>50%)ΪЭ������721��ˮ���ij����ڽ���GWAS�о�.���������һЩλ����֪����������λ��(
Genome analysis identified novel candidate genes for Ascochyta blight resistance in chickpea using whole genome re-sequencing data
3
2017
... ���ڵ��������̬��(SNP)��ǵ���Ҫ����(
... ȫ�������ز����ѹ㷺Ӧ��������(Citrullus lanatus) (
... )��ֲ���GWAS�о���.
Investigating drought tolerance in chickpea using genome-wide association mapping and genomic selection based on whole-genome resequencing data
2
2018
... ȫ�������ز����ѹ㷺Ӧ��������(Citrullus lanatus) (
... ��69��ӥ�춹����ȫ�������ز���, ����ή���������λ�㾫ȷ��λ��1��100 kb��������, ��������NBS-LRR���弤ø��пָ�ṹ�����Լ�˿����/�հ��ᵰ��ø��12�������ʱ������.
FaST linear mixed models for genome-wide association studies
1
2011
... �ñ��������ģ�ʹ�������������Ч�ʵ�, ����ʱ�䳤.Ϊ�����������ٶ�, ���ټ�����, EMMA�������ȳ���ͨ����������, ����������ʱ��(
FaST-LMM- Select for addressing confounding from spatial structure and rare variants
1
2013
... ����������Ȼ��������������ٶ�, ���ǶԼ��Ч���ĸ�������(
Genomic, transcriptomic, and phenomic variation reveals the complex adaptation of modern maize breeding
1
2015
... ������, �о���Ա����GWAS�����ڶ�ֲ�︴��������״�о��м����������ؼ�λ��, ������Щ��������λ����ܽ��Ͳ��ֱ��ͱ���, ��ȱʧ�Ŵ�����������Ȼ�ǵ�ǰ�����Ŵ�ѧ�о����ѵ�.����, GWAS����ͳ��Ч�������Լ�������һ�������ڶ���й��ܵĵ�λ�����Ⱥ���е�Ч���������(
Crop genome-wide association study: a harvest of biological relevance
1
2019
... ���������ǹ��������Ļ���.Ϊ�˻�ÿɿ��ı�������, ͨ����Ҫ��������ظ��������������.�ӹ��������ķ�������, һ��Ҫ���������Ϊ��������, ���������о�����, ��ɢ���ݺͷ����������ض�����µ�GWAS��Ҳ���Ի�ýϺõĹ������.�������Ͷ��ڹ�������ͳ�Ʒ�����ѡ������ҪӰ��(
Iterative usage of fixed and random effect models for powerful and efficient genome-wide association studies
1
2016
... ����������Ȼ��������������ٶ�, ���ǶԼ��Ч���ĸ�������(
Efficient Bayesian mixed-model analysis increases association power in large cohorts
1
2015
... ����������Ȼ��������������ٶ�, ���ǶԼ��Ч���ĸ�������(
Genetic dissection of snow mold tolerance in US Pacific Northwest winter wheat through genome-wide association study and genomic selection
1
2019
... ����������Ȼ��������������ٶ�, ���ǶԼ��Ч���ĸ�������(
Genome-wide association study of haploid male fertility in maize ( Zea mays L.)
1
2018a
... ���������ǹ��������Ļ���.Ϊ�˻�ÿɿ��ı�������, ͨ����Ҫ��������ظ��������������.�ӹ��������ķ�������, һ��Ҫ���������Ϊ��������, ���������о�����, ��ɢ���ݺͷ����������ض�����µ�GWAS��Ҳ���Ի�ýϺõĹ������.�������Ͷ��ڹ�������ͳ�Ʒ�����ѡ������ҪӰ��(
Resequencing core accessions of a pedigree identifies derivation of genomic segments and key agronomic trait loci during cotton improvement
1
2019a
... ȫ�������ز����ѹ㷺Ӧ��������(Citrullus lanatus) (
A novel rice grain size gene OsSNB was identified by genome-wide association study in natural population
1
2019b
... ȫ�������ز����ѹ㷺Ӧ��������(Citrullus lanatus) (
Resequencing a core collection of upland cotton identifies genomic variation and loci influencing fiber quality and yield
1
2018b
... ȫ�������ز����ѹ㷺Ӧ��������(Citrullus lanatus) (
Properties of global- and local- ancestry adjustments in genetic association tests in admixed populations
1
2018
... ͨ��PCA���Ŵ���ǽ�άͶӰ����ֱ�ӿ��ӻ�Ⱥ��ṹ, Ȼ��, ��ʱ�����������ͶӰ���겻�ܽ�������ȫ�����ȹ���(
The genome analysis toolkit: a MapReduce framework for analyzing next-generation DNA sequencing data
1
2010
... ʹ��GATK (
Genebank genomics highlights the diversity of a global barley collection
1
2019
... ������о�ͬʱ����PCA����ʽ����ģ��2�ַ���������Ⱥ��ṹ, �Ա�֤����Ŀɿ���(
Association mapping: critical considerations shift from genotyping to experimental design
1
2009
... ���ڵ��������̬��(SNP)��ǵ���Ҫ����(
Genome-wide association studies of free amino acid levels by six multi-locus models in bread wheat
1
2018
... ���ڲ�ͬ���Ŵ�ѧ����ͳ��ѧ����, ӿ�ֳ��ڶ�������ģ�ͷ���.GWAS��Ҫ�ۺϿ����������������ٶȡ�ͳ��Ч����ʹ�ñ���Ե�����, ѡ����ʵķ���.������������ﵽ��������������Զ����������ij���Ⱥ��GWAS�о�, ����FaST-LMM�������������Դ��, �����ٶȿ�.���ڱ���ܶȴ��GWAS�о�, �ɲ���EMMAX�������з���.���ھ��л����������������ͱ���ܶȴ��������GWAS�о�, �ɲ���SUPER��FarmCPU��BLINK�������з���, ��Щ���������ٶȿ�, �ɼ�������֪λ��.Ŀǰ, Ϊ��ȷ�������ȷ�ԺͿɿ���, ����GWASͬʱ���ö��ģ�������з���, �����Ƚ�ɸѡ�����Ž�(
Principal components analysis corrects for stratification in genome-wide association studies
2
2006
... ���ɷַ���(principal component analysis, PCA)��Ⱥ��ṹ������������֮һ.PCA����Ҫ���������ų�Ⱥ���е��쳣����, �Ի����ͽ�ά, �Ӷ�����Ⱥ��ṹ(
... (1) ����EIGENSOFT (
Inference of population structure using multilocus genotype data
1
2000
... ͨ��PCA���Ŵ���ǽ�άͶӰ����ֱ�ӿ��ӻ�Ⱥ��ṹ, Ȼ��, ��ʱ�����������ͶӰ���겻�ܽ�������ȫ�����ȹ���(
PLINK: a tool set for whole-ge- nome association and population-based linkage analyses
1
2007
... ����2: PLINK (
fastSTRUCTURE: variational inference of population structure in large SNP data sets
2
2014
... ���ɷַ���(principal component analysis, PCA)��Ⱥ��ṹ������������֮һ.PCA����Ҫ���������ų�Ⱥ���е��쳣����, �Ի����ͽ�ά, �Ӷ�����Ⱥ��ṹ(
... ͨ��PCA���Ŵ���ǽ�άͶӰ����ֱ�ӿ��ӻ�Ⱥ��ṹ, Ȼ��, ��ʱ�����������ͶӰ���겻�ܽ�������ȫ�����ȹ���(
Association mapping for frost tolerance using multi-parent advanced generation inter-cross (MAGIC) population in faba bean ( Vicia faba L.)
1
2015
... ���ڵ��������̬��(SNP)��ǵ���Ҫ����(
Dissection of the genetic variation and candidate genes of lint percentage by a genome-wide association study in upland cotton
1
2019
... ������о�ͬʱ����PCA����ʽ����ģ��2�ַ���������Ⱥ��ṹ, �Ա�֤����Ŀɿ���(
Rapid variance components-based method for whole-genome association analysis
1
2012
... �ñ��������ģ�ʹ�������������Ч�ʵ�, ����ʱ�䳤.Ϊ�����������ٶ�, ���ټ�����, EMMA�������ȳ���ͨ����������, ����������ʱ��(
Benefits and limitations of genome-wide association studies
1
2019
... ���ڵ��������̬��(SNP)��ǵ���Ҫ����(
MEGA6: molecular evolutionary genetics analysis version 6.0
1
2013
... Ϊ�˽���Ⱥ��ṹ�ͼ�ϵ��Ե��ϵ��ȫ���������������Ӱ��, ��Ҫ����SNP��Ϣ���������Ⱥ��ṹ��Q����ͼ�ϵ��Ե����K����.����CDS����SNP, ����PHYLIP (http://evolution.genetics.Wa- shington.edu/phylip.htm)��MEGA (
Estimation of individual admixture: analytical and study design considerations
1
2005
... ͨ��PCA���Ŵ���ǽ�άͶӰ����ֱ�ӿ��ӻ�Ⱥ��ṹ, Ȼ��, ��ʱ�����������ͶӰ���겻�ܽ�������ȫ�����ȹ���(
GAPIT Version 2: an enhanced integrated tool for genomic association and prediction
2
2016
... ����������Ȼ��������������ٶ�, ���ǶԼ��Ч���ĸ�������(
... ���ڲ�ͬ���Ŵ�ѧ����ͳ��ѧ����, ӿ�ֳ��ڶ�������ģ�ͷ���.GWAS��Ҫ�ۺϿ����������������ٶȡ�ͳ��Ч����ʹ�ñ���Ե�����, ѡ����ʵķ���.������������ﵽ��������������Զ����������ij���Ⱥ��GWAS�о�, ����FaST-LMM�������������Դ��, �����ٶȿ�.���ڱ���ܶȴ��GWAS�о�, �ɲ���EMMAX�������з���.���ھ��л����������������ͱ���ܶȴ��������GWAS�о�, �ɲ���SUPER��FarmCPU��BLINK�������з���, ��Щ���������ٶȿ�, �ɼ�������֪λ��.Ŀǰ, Ϊ��ȷ�������ȷ�ԺͿɿ���, ����GWASͬʱ���ö��ģ�������з���, �����Ƚ�ɸѡ�����Ž�(
Whole genome re-sequencing reveals genome-wide variations among parental lines of 16 mapping populations in chickpea ( Cicer arietinum L.)
1
2016
... ȫ�������ز����ѹ㷺Ӧ��������(Citrullus lanatus) (
A chemical genetic roadmap to improved tomato flavor
2
2017
... ���������ǹ��������Ļ���.Ϊ�˻�ÿɿ��ı�������, ͨ����Ҫ��������ظ��������������.�ӹ��������ķ�������, һ��Ҫ���������Ϊ��������, ���������о�����, ��ɢ���ݺͷ����������ض�����µ�GWAS��Ҳ���Ի�ýϺõĹ������.�������Ͷ��ڹ�������ͳ�Ʒ�����ѡ������ҪӰ��(
... ������, �о���Ա����GWAS�����ڶ�ֲ�︴��������״�о��м����������ؼ�λ��, ������Щ��������λ����ܽ��Ͳ��ֱ��ͱ���, ��ȱʧ�Ŵ�����������Ȼ�ǵ�ǰ�����Ŵ�ѧ�о����ѵ�.����, GWAS����ͳ��Ч�������Լ�������һ�������ڶ���й��ܵĵ�λ�����Ⱥ���е�Ч���������(
Rice chloroplast genome variation architecture and phylogenetic dissection in diverse Oryza species assessed by whole-genome resequencing
1
2016
... ȫ�������ز����ѹ㷺Ӧ��������(Citrullus lanatus) (
Resequencing of 429 chickpea accessions from 45 countries provides insights into genome diversity, domestication and agronomic traits
1
2019
... ȫ�������ز����ѹ㷺Ӧ��������(Citrullus lanatus) (
Five years of GWAS discovery
1
2012
... ȫ�������������(genome-wide association study, GWAS)��һ��ͨ������ȫ�������Ŵ��������ͱ������������������λ����״��ص��Ŵ�λ��, ��Ⱥ��ˮƽ�Ͻ�����״�Ŵ������ķ���.Ӱ��GWAS�Ĺؼ�����֮һ��Ⱥ��ˮƽ����������ƽ��(linkage disequilibrium, LD).�����Ǵ��LD����Ҫ����(
10 years of GWAS discovery, biology, function, and translation
1
2017
... ��������Ӱ��GWAS��������λ�����Ŀ(
The power of inbreeding: NGS-based GWAS of rice reveals convergent evolution during rice domestication
1
2016
... ��������Ӱ��GWAS��������λ�����Ŀ(
ANNOVAR: functional annotation of genetic variants from high-throughput sequencing data
1
2010
... ����ANNOVAR (
Statistical methods for genome-wide association studies
1
2019
... ���ɷַ���(principal component analysis, PCA)��Ⱥ��ṹ������������֮һ.PCA����Ҫ���������ų�Ⱥ���е��쳣����, �Ի����ͽ�ά, �Ӷ�����Ⱥ��ṹ(
Statistical power in genome-wide association studies and quantitative trait locus mapping
1
2019
... ��������Ӱ��GWAS��������λ�����Ŀ(
Advances in genome-wide association studies of complex traits in rice
4
2020
... ��������Ӱ��GWAS��������λ�����Ŀ(
... ).����, ˮ����GWASһ����Ҫ200-5 000������(
... ,
... ADMIXTURE (
A SUPER powerful method for genome wide association study
1
2014
... ����������Ȼ��������������ٶ�, ���ǶԼ��Ч���ĸ�������(
Genetic architecture of natural variation in rice chlorophyll content revealed by a genome-wide association study
1
2015
... ȫ�������ز����ѹ㷺Ӧ��������(Citrullus lanatus) (
Genome-wide association mapping of resistance to a Brazilian isolate of Sclerotinia sclerotiorum in soybean genotypes mostly from Brazil
1
2017
... ���ڲ�ͬ���Ŵ�ѧ����ͳ��ѧ����, ӿ�ֳ��ڶ�������ģ�ͷ���.GWAS��Ҫ�ۺϿ����������������ٶȡ�ͳ��Ч����ʹ�ñ���Ե�����, ѡ����ʵķ���.������������ﵽ��������������Զ����������ij���Ⱥ��GWAS�о�, ����FaST-LMM�������������Դ��, �����ٶȿ�.���ڱ���ܶȴ��GWAS�о�, �ɲ���EMMAX�������з���.���ھ��л����������������ͱ���ܶȴ��������GWAS�о�, �ɲ���SUPER��FarmCPU��BLINK�������з���, ��Щ���������ٶȿ�, �ɼ�������֪λ��.Ŀǰ, Ϊ��ȷ�������ȷ�ԺͿɿ���, ����GWASͬʱ���ö��ģ�������з���, �����Ƚ�ɸѡ�����Ž�(
Metabolome-based genome-wide association study of maize kernel leads to novel biochemical insights
1
2014
... ������, �о���Ա����GWAS�����ڶ�ֲ�︴��������״�о��м����������ؼ�λ��, ������Щ��������λ����ܽ��Ͳ��ֱ��ͱ���, ��ȱʧ�Ŵ�����������Ȼ�ǵ�ǰ�����Ŵ�ѧ�о����ѵ�.����, GWAS����ͳ��Ч�������Լ�������һ�������ڶ���й��ܵĵ�λ�����Ⱥ���е�Ч���������(
Resequencing of 683 common bean genotypes identifies yield component trait associations across a north-south cline
2
2020
... ȫ�������ز����ѹ㷺Ӧ��������(Citrullus lanatus) (
... �ñ��������ģ�ʹ�������������Ч�ʵ�, ����ʱ�䳤.Ϊ�����������ٶ�, ���ټ�����, EMMA�������ȳ���ͨ����������, ����������ʱ��(
Mapping the Arabidopsis metabolic landscape by untargeted metabolomics at different environmental conditions
1
2018
... ������, �о���Ա����GWAS�����ڶ�ֲ�︴��������״�о��м����������ؼ�λ��, ������Щ��������λ����ܽ��Ͳ��ֱ��ͱ���, ��ȱʧ�Ŵ�����������Ȼ�ǵ�ǰ�����Ŵ�ѧ�о����ѵ�.����, GWAS����ͳ��Ч�������Լ�������һ�������ڶ���й��ܵĵ�λ�����Ⱥ���е�Ч���������(
Genome-wide association studies in maize: praise and stargaze
2
2017
... ȫ�������������(genome-wide association study, GWAS)��һ��ͨ������ȫ�������Ŵ��������ͱ������������������λ����״��ص��Ŵ�λ��, ��Ⱥ��ˮƽ�Ͻ�����״�Ŵ������ķ���.Ӱ��GWAS�Ĺؼ�����֮һ��Ⱥ��ˮƽ����������ƽ��(linkage disequilibrium, LD).�����Ǵ��LD����Ҫ����(
... ����������Ȼ��������������ٶ�, ���ǶԼ��Ч���ĸ�������(
Breeding signatures of rice improvement revealed by a genomic variation map from a large germplasm collection
2
2015
... ȫ�������ز����ѹ㷺Ӧ��������(Citrullus lanatus) (
... �ñ��������ģ�ʹ�������������Ч�ʵ�, ����ʱ�䳤.Ϊ�����������ٶ�, ���ټ�����, EMMA�������ȳ���ͨ����������, ����������ʱ��(
Genome wide association studies using a new nonparametric model reveal the genetic architecture of 17 agronomic traits in an enlarged maize association panel
1
2014
... GWAS��������״��������ͨ������Logistic�ع�ģ��; ������״�����������Բ���һ������ģ��(general linear model, GLM)�ͻ������ģ��(mixed linear model, MLM).һ������ģ����Ⱥ��ṹ����Q�����ɷַ�������ΪЭ����������㾫��; �������ģ������Ⱥ��ṹ����Q����Ե��ϵ����(kinship, K)�������������ɷַ����������Ե��ϵ����ΪЭ���������Ƽٹ����ij���(
Genome-wide association study using whole- genome sequencing rapidly identifies new genes influencing agronomic traits in rice
1
2016
... GWAS�ѹ㷺Ӧ���ڽ������ͱ�����Ŵ�����, ��������ͱ�����ص�λ��, ��Ϊ���ܻ����о��ṩ��ѡ����/λ��, ��Ϊ����Ӧ���ṩ���ӱ��.�� GWASҲ����һ����ȱ��, ��Ⱥ��ṹ��ɵļ�����, �Ŵ����������λ��ЧӦ��ڸǵ�.Ϊ�˽����Щ����, �о�����Ҫ����������IJ���: ��һ�����㷨��, ͨ���ڹ�������ģ���п�����Ե��ϵ��Ⱥ��ṹ��Ӱ��, �Թ����������У��; ������ڹ���Ⱥ����, ѡȡ��Ե��ϵ��Ⱥ��ṹ������, ���DZ��ͱ���ḻ��Ⱥ��(
Genetic association mapping and genome organization of maize
1
2006
... ȫ�������������(genome-wide association study, GWAS)��һ��ͨ������ȫ�������Ŵ��������ͱ������������������λ����״��ص��Ŵ�λ��, ��Ⱥ��ˮƽ�Ͻ�����״�Ŵ������ķ���.Ӱ��GWAS�Ĺؼ�����֮һ��Ⱥ��ˮƽ����������ƽ��(linkage disequilibrium, LD).�����Ǵ��LD����Ҫ����(
A unified mixed-model method for association mapping that accounts for multiple levels of relatedness
1
2006
... GWAS��������״��������ͨ������Logistic�ع�ģ��; ������״�����������Բ���һ������ģ��(general linear model, GLM)�ͻ������ģ��(mixed linear model, MLM).һ������ģ����Ⱥ��ṹ����Q�����ɷַ�������ΪЭ����������㾫��; �������ģ������Ⱥ��ṹ����Q����Ե��ϵ����(kinship, K)�������������ɷַ����������Ե��ϵ����ΪЭ���������Ƽٹ����ij���(
PopLDdecay, a fast and effective tool for linkage disequilibrium decay analysis based on variant call format files
1
2019a
... LD˥����������������PLINK��Haploview (
A combined linkage and GWAS analysis identifies QTLs linked to soybean seed protein and oil content
1
2019b
... ������о�ͬʱ����PCA����ʽ����ģ��2�ַ���������Ⱥ��ṹ, �Ա�֤����Ŀɿ���(
Characterizing the population structure and genetic diversity of maize breeding germplasm in Southwest China using genome- wide SNP markers
1
2016
... ȫ�������������(genome-wide association study, GWAS)��һ��ͨ������ȫ�������Ŵ��������ͱ������������������λ����״��ص��Ŵ�λ��, ��Ⱥ��ˮƽ�Ͻ�����״�Ŵ������ķ���.Ӱ��GWAS�Ĺؼ�����֮һ��Ⱥ��ˮƽ����������ƽ��(linkage disequilibrium, LD).�����Ǵ��LD����Ҫ����(
Editorial: the applications of new multi-locus GWAS methodologies in the genetic dissection of complex traits
1
2019c
... ���ڲ�ͬ���Ŵ�ѧ����ͳ��ѧ����, ӿ�ֳ��ڶ�������ģ�ͷ���.GWAS��Ҫ�ۺϿ����������������ٶȡ�ͳ��Ч����ʹ�ñ���Ե�����, ѡ����ʵķ���.������������ﵽ��������������Զ����������ij���Ⱥ��GWAS�о�, ����FaST-LMM�������������Դ��, �����ٶȿ�.���ڱ���ܶȴ��GWAS�о�, �ɲ���EMMAX�������з���.���ھ��л����������������ͱ���ܶȴ��������GWAS�о�, �ɲ���SUPER��FarmCPU��BLINK�������з���, ��Щ���������ٶȿ�, �ɼ�������֪λ��.Ŀǰ, Ϊ��ȷ�������ȷ�ԺͿɿ���, ����GWASͬʱ���ö��ģ�������з���, �����Ƚ�ɸѡ�����Ž�(
Mixed linear model approach adapted for genome-wide association studies
1
2010
... ����������Ȼ��������������ٶ�, ���ǶԼ��Ч���ĸ�������(
Efficient multivariate linear mixed model algorithms for genome-wide association studies
2
2014
... �ñ��������ģ�ʹ�������������Ч�ʵ�, ����ʱ�䳤.Ϊ�����������ٶ�, ���ټ�����, EMMA�������ȳ���ͨ����������, ����������ʱ��(
... ��ǰ����Ŀ���Ѿ��ӵ�һ��״����ת��߲������ʡ������Ϳ�����ۺ���״���ձ����, ��������˶�������״���ϵĻ��ģ�ͷ���, ��Ҫ����MTMM (
Genome-wide association studies in rice: how to solve the low power problems?
1
2019
... ������, �о���Ա����GWAS�����ڶ�ֲ�︴��������״�о��м����������ؼ�λ��, ������Щ��������λ����ܽ��Ͳ��ֱ��ͱ���, ��ȱʧ�Ŵ�����������Ȼ�ǵ�ǰ�����Ŵ�ѧ�о����ѵ�.����, GWAS����ͳ��Ч�������Լ�������һ�������ڶ���й��ܵĵ�λ�����Ⱥ���е�Ч���������(
Resequencing 302 wild and cultivated accessions identifies genes related to domestication and improvement in soybean
1
2015
... ȫ�������ز����ѹ㷺Ӧ��������(Citrullus lanatus) (
Rewiring of the fruit metabolome in tomato breeding
3
2018
... ���������ǹ��������Ļ���.Ϊ�˻�ÿɿ��ı�������, ͨ����Ҫ��������ظ��������������.�ӹ��������ķ�������, һ��Ҫ���������Ϊ��������, ���������о�����, ��ɢ���ݺͷ����������ض�����µ�GWAS��Ҳ���Ի�ýϺõĹ������.�������Ͷ��ڹ�������ͳ�Ʒ�����ѡ������ҪӰ��(
... �ñ��������ģ�ʹ�������������Ч�ʵ�, ����ʱ�䳤.Ϊ�����������ٶ�, ���ټ�����, EMMA�������ȳ���ͨ����������, ����������ʱ��(
... ������, �о���Ա����GWAS�����ڶ�ֲ�︴��������״�о��м����������ؼ�λ��, ������Щ��������λ����ܽ��Ͳ��ֱ��ͱ���, ��ȱʧ�Ŵ�����������Ȼ�ǵ�ǰ�����Ŵ�ѧ�о����ѵ�.����, GWAS����ͳ��Ч�������Լ�������һ�������ڶ���й��ܵĵ�λ�����Ⱥ���е�Ч���������(
