Spatial variation and controlling factors of temperature sensitivity of soil respiration in forest ecosystems across China
Jia-Jia ZHENG1,2, Song-Yu HUANG1,2, Xin JIA,1,2,3,*, Yun TIAN1,3, Yu MU1,2, Peng LIU1,2, Tian-Shan ZHA1,2,31School of Soil and Water Conservation, Beijing Forestry University, Beijing 100083, China 2Yanchi Ecology Research Station of Mau Us Desert, Beijing 100083, China 3Key Laboratory of State Forestry and Grassland Administration on Soil and Water Conservation, Beijing Forestry University, Beijing 100083, China
National Natural Science Foundation of China(31670708) National Natural Science Foundation of China(31670710) National Natural Science Foundation of China(31901366) Fundamental Research Funds for the Central Universities(2015ZCQ-SB-02)
Abstract Aims Our objective was to determine the spatial variation of the temperature sensitivity of soil respiration (Q10) and it’s controlling factors in forest ecosystems across China. Methods Based on published papers, the field measurement data of soil respiration were collected to build the dataset of annual Q10 in forest ecosystems across China. Further, the spatial variation and the drivers of Q10 in different forest types were analyzed. Important findings The results showed that 1) Q10 ranges from 1.09 to 6.24, with a mean value (± standard error) of 2.37 (± 0.04) and no significant difference among different forest types; 2) When all forest types were considered, Q10 increased with increasing latitude, altitude, soil organic carbon content (SOC) and soil total nitrogen content (TN), but decreased with increasing longitude, mean annual temperature (MAT) and mean annual precipitation (MAP). Climate (MAT, MAP) and soil (SOC, TN) factors together explained 32.8% variations in Q10. MAT and SOC were considered as the primary factors driving the spatial variation of Q10. 3) Q10 of different forest types responded differently to climate and soil factors. Q10 decreased with the increase of MAP in the deciduous needleleaf forest (DNF), while Q10 showed no significant correlation with MAP in other forest types. Q10 increased with the increase of TN in evergreen broadleaved forest (EBF), deciduous broadleaved forest (DBF), evergreen needleleaf forest (ENF), and the sensitivity of Q10 to TN was the highest in EBF and the lowest in ENF. Although Q10 showed concentrated distribution trend, more attention should be paid to the large range of variation in future C budget studies. The primary driving factors and the response to environmental factors of Q10 varied among forest types. Under the scenario of future climate change, Q10 may vary divergently among different forest types. Therefore, the divergent responses of key parameters of carbon cycle in different forest types to climate change should also be considered in future carbon-climate models. Keywords:soil respiration;temperature sensitivity;carbon cycle;CO2 flux;soil carbon flux
PDF (2321KB)元数据多维度评价相关文章导出EndNote|Ris|Bibtex收藏本文 引用本文 郑甲佳, 黄松宇, 贾昕, 田赟, 牟钰, 刘鹏, 查天山. 中国森林生态系统土壤呼吸温度敏感性空间变异特征及影响因素. 植物生态学报, 2020, 44(6): 687-698. DOI: 10.17521/cjpe.2019.0300 ZHENG Jia-Jia, HUANG Song-Yu, JIA Xin, TIAN Yun, MU Yu, LIU Peng, ZHA Tian-Shan. Spatial variation and controlling factors of temperature sensitivity of soil respiration in forest ecosystems across China. Chinese Journal of Plant Ecology, 2020, 44(6): 687-698. DOI: 10.17521/cjpe.2019.0300
以往关于Q10空间变异影响因素的研究往往忽略了不同影响因素间的交互作用, 各因素对Q10的直接和间接影响, 以及不同类型生态系统Q10对气候和土壤因素的响应差异, 从而可能造成结果的不确定性。众多研究发现温度和水分之间存在交互作用, 即温度对土壤呼吸的影响随水分条件的变化而变化(Lellei-Kovács et al., 2011; Wang et al., 2014; Liu et al., 2016)。Liu等(2017)通过整合文献数据, 发现年平均气温(MAT)和年降水量(MAP)不仅可以直接影响Q10, 还可以通过土壤理化性质和微生物群落间接影响Q10。Chen和Tian (2005)发现Q10在三类生物区系间对温度的响应不同, 其对温度变化的敏感性在寒带最高, 其次是温带, 而在热带和亚热带最低。近年来, 在不同生态系统中土壤呼吸观测数据不断积累, 这为通过整合分析检验在区域尺度上Q10的空间变异特征及其影响因素创造了条件。
Table 1 表1 表1中国森林生态系统年尺度土壤呼吸温度敏感性(Q10)数据集的相关信息 Table 1Supporting information of the dataset of annual temperature sensitivity of soil respiration (Q10) in forest ecosystems across China
年平均气温(℃), 年降水量(mm), 年蒸发散(mm), 干燥指数(mm·mm-1), 试验地当年平均气温(℃), 试验地当年降水量(mm) Mean annual temperature (℃), mean annual precipitation (mm), annual evapotranspiration (mm), aridity index (mm·mm-1), mean annual temperature of study sites (℃), mean annual precipitation of study sites (mm)
植被因素 Vegetation factor
林分类型, 林龄(a), 叶面积指数(m2·m-2) Stand type, stand age (a), leaf area index (m2·m-2)
土壤温湿度 Soil temperature and moisture
测量期间平均土壤温度(℃), 测量期间土壤温度振幅(℃), 测量期间土壤体积含水率(m3·m-3), 测量期间土壤质量含水率(%) Mean soil temperature during measurement (℃), soil temperature amplitude during measurement (℃), Soil volumetric water content during measurement (m3·m-3), soil mass water content during measurement (%)
土壤呼吸温度敏感性 Temperature sensitivity of soil respiration
土壤呼吸温度敏感性(Q10), Van’t Hoff方程的决定系数(R2) Temperature sensitivity of soil respiration (Q10), the determination coefficient of Van’t Hoff equation (R2)
观测方法信息 Measurement method information
开始测量日期, 结束测量日期, CO2测定方法(碱溶液吸收法, 气象色谱法, 红外法), 气室方法(静态密闭气室法, 动态密闭气室法、自动开闭气室法) Start date of measurement, end date of measurement, CO2 measurement method (Alkali solution absorption, Gas chromatography, Infrared method), chamber method (Static closed chamber, Dynamic closed chamber, Automatic opening and closing chamber)
Fig. 1Spatial distribution of study sites included in the dataset of annual temperature sensitivity of soil respiration (Q10) in forest ecosystems across China. DBF, deciduous broadleaf forest; DNF, deciduous needleleaf forest; EBF, evergreen broadleaf forest; ENF, evergreen needleleaf forest; MF, mixed forest.
实线表示平均值, 虚线表示中位数, 红色曲线为分布曲线。 Fig. 2Frequency distributions of the temperature sensitivity of soil respiration (Q10)(A) and coefficient of determination of Van’t Hoff equation (R2)(B).
The solid line represents the mean value, the dashed line represents the median value, and the red curve is the distribution curve.
n为样本量, 相同的字母表示组间均值无显著差异(α = 0.05)。 Fig. 3Temperature sensitivity of soil respiration (Q10)(mean ± SE) in different forest types.
n, the sample size; the same letter represents no significant difference in mean values between groups (α = 0.05). DBF, deciduous broadleaf forest; DNF, deciduous needleleaf forest; EBF, evergreen broadleaf forest; ENF, evergreen needleleaf forest; MF, mixed forest.
2.2 Q10的影响因素
中国森林生态系统土壤呼吸Q10随纬度(R2 = 0.048, p < 0.01)和海拔(R2 = 0.21, p < 0.01)的增加而增大, 随经度(R2 = 0.021, p < 0.01)的增加而减小(图4A-4C)。协方差分析表明Q10受森林类型和经度交互作用的影响(协方差分析(ANCOVA), Lon, F1,398 = 9.03, p < 0.01; 林分类型(Stand type), F4,398 = 3.21, p < 0.01; Lon × Stand type, F4,398 = 4.78, p < 0.01)。回归分析也表明, 地理因素对Q10的影响在不同森林类型的生态系统中有差异(附录II)。在DBF、ENF、MF中Q10随纬度的增加而增大, 而在DNF和EBF中Q10不随纬度变化; 在DNF、EBF、ENF中Q10随经度的增加而减小, 而在DBF和MF中Q10不随经度变化; 在5种森林类型中Q10均随海拔增加而增大, 但DNF中Q10随海拔增加而增大的幅度高于其他森林类型。
箭头旁边的数字是标准化路径系数γ, 实线箭头和虚线箭头分别代表模型中的正负效应。模型中所有路径均是显著的(p < 0.01), R2 (粗体数字)表示有关变量的共同解释度, χ2 = 1.39, df = 1, p = 0.24, RMSEA = 0.032。 Fig. 5Structural equation model (A) and standardized total effect (B) of the effect of climatic and soil factors on spatial variation in the temperature sensitivity of soil respiration (Q10).
Numbers beside arrows are standardized path coefficients (γ), the solid and dashed arrows represent the positive and negative effects in a fitted structural equation model, respectively. All paths in this model are significant (p < 0.01). R2 (bold number) values represent the proportion of variance explainable by each variable in the model, χ2 = 1.39, df = 1, p = 0.24, RMSEA = 0.032. MAP, mean annual precipitation; MAT, mean annual temperature; SOC, soil organic carbon content; TN, soil total nitrogen content.
Table 2 表2 表2土壤呼吸温度敏感性(Q10)与气候(MAT、MAP)和土壤因素(SOC、TN)的多元线性回归 Table 2Multiple linear regression of the temperature sensitivity of soil respiration (Q10) with climate (MAT, MAP) and soil factors (SOC, TN)
Supplement II Line regression equation between the temperature sensitivity of soil respiration (Q10) and controlling factors among different forest types
Bond-LambertyB, BaileyVL, ChenM, GoughCM, VargasR (2018). Globally rising soil heterotrophic respiration over recent decades Nature, 560, 80-83. DOI:10.1038/s41586-018-0358-xURLPMID:30068952 [本文引用: 2] Global soils store at least twice as much carbon as Earth's atmosphere(1,2). The global soil-to-atmosphere (or total soil respiration, RS) carbon dioxide (CO2) flux is increasing(3,4), but the degree to which climate change will stimulate carbon losses from soils as a result of heterotrophic respiration (RH) remains highly uncertain(5-8). Here we use an updated global soil respiration database(9) to show that the observed soil surface RH:RS ratio increased significantly, from 0.54 to 0.63, between 1990 and 2014 (P = 0.009). Three additional lines of evidence provide support for this finding. By analysing two separate global gross primary production datasets(10,11), we find that the ratios of both RH and RS to gross primary production have increased over time. Similarly, significant increases in RH are observed against the longest available solar-induced chlorophyll fluorescence global dataset, as well as gross primary production computed by an ensemble of global land models. We also show that the ratio of night-time net ecosystem exchange to gross primary production is rising across the FLUXNET2015(12) dataset. All trends are robust to sampling variability in ecosystem type, disturbance, methodology, CO2 fertilization effects and mean climate. Taken together, our findings provide observational evidence that global RH is rising, probably in response to environmental changes, consistent with meta-analyses(13-16) and long-term experiments(17). This suggests that climate-driven losses of soil carbon are currently occurring across many ecosystems, with a detectable and sustained trend emerging at the global scale.
Bond-LambertyB, ThomsonA (2010). Temperature-associated increases in the global soil respiration record Nature, 464, 579-582. DOI:10.1038/nature08930URLPMID:20336143 [本文引用: 3] Soil respiration, R(S), the flux of microbially and plant-respired carbon dioxide (CO(2)) from the soil surface to the atmosphere, is the second-largest terrestrial carbon flux. However, the dynamics of R(S) are not well understood and the global flux remains poorly constrained. Ecosystem warming experiments, modelling analyses and fundamental biokinetics all suggest that R(S) should change with climate. This has been difficult to confirm observationally because of the high spatial variability of R(S), inaccessibility of the soil medium and the inability of remote-sensing instruments to measure R(S) on large scales. Despite these constraints, it may be possible to discern climate-driven changes in regional or global R(S) values in the extant four-decade record of R(S) chamber measurements. Here we construct a database of worldwide R(S) observations matched with high-resolution historical climate data and find a previously unknown temporal trend in the R(S) record after accounting for mean annual climate, leaf area, nitrogen deposition and changes in CO(2) measurement technique. We find that the air temperature anomaly (the deviation from the 1961-1990 mean) is significantly and positively correlated with changes in R(S). We estimate that the global R(S) in 2008 (that is, the flux integrated over the Earth's land surface over 2008) was 98 +/- 12 Pg C and that it increased by 0.1 Pg C yr(-1) between 1989 and 2008, implying a global R(S) response to air temperature (Q(10)) of 1.5. An increasing global R(S) value does not necessarily constitute a positive feedback to the atmosphere, as it could be driven by higher carbon inputs to soil rather than by mobilization of stored older carbon. The available data are, however, consistent with an acceleration of the terrestrial carbon cycle in response to global climate change.
CanadellJG, RaupachMR (2008). Managing forests for climate change mitigation Science, 320, 1456-1457. DOI:10.1126/science.1155458URLPMID:18556550 [本文引用: 1] Forests currently absorb billions of tons of CO2 globally every year, an economic subsidy worth hundreds of billions of dollars if an equivalent sink had to be created in other ways. Concerns about the permanency of forest carbon stocks, difficulties in quantifying stock changes, and the threat of environmental and socioeconomic impacts of large-scale reforestation programs have limited the uptake of forestry activities in climate policies. With political will and the involvement of tropical regions, forests can contribute to climate change protection through carbon sequestration as well as offering economic, environmental, and sociocultural benefits. A key opportunity in tropical regions is the reduction of carbon emissions from deforestation and degradation.
CDIAC (Carbon Dioxide Information Analysis Center, Oak Ridge National Laboratory) (2016). Updated fossil fuel CO2 emissions estimates. http://cdiac.essdive.lbl.gov/. Cited: 2017-02-12. URL [本文引用: 1]
ChenH, TianHQ (2005). Does a general temperature-dependent Q10 model of soil respiration exist at biome and global scale? Journal of Integrative Plant Biology, 47, 1288-1302. DOI:10.1111/jipb.2005.47.issue-11URL [本文引用: 3]
Curiel YusteJ, JanssensIA, CarraraA, CeulemansR (2004). Annual Q10 of soil respiration reflects plant phenological patterns as well as temperature sensitivity Global Change Biology, 10, 161-169. [本文引用: 2]
DavidsonEA, BelkE, BooneRD (1998). Soil water content and temperature as independent or confounded factors controlling soil respiration in a temperate mixed hardwood forest Global Change Biology, 4, 217-227.
DavidsonEA, JanssensIA, LuoYQ (2006). On the variability of respiration in terrestrial ecosystems: moving beyond Q10 Global Change Biology, 12, 154-164. [本文引用: 1]
DavidsonEA, SavageK, VerchotLV, NavarroR (2002). Minimizing artifacts and biases in chamber-based measurements of soil respiration Agricultural and Forest Meteorology, 113, 21-37. [本文引用: 1]
FangC, SmithP, MoncrieffJB, SmithJU (2005). Similar response of labile and resistant soil organic matter pools to changes in temperature Nature, 433, 57-59. DOI:10.1038/nature03138URLPMID:15635408 [本文引用: 1] Our understanding of the relationship between the decomposition of soil organic matter (SOM) and soil temperature affects our predictions of the impact of climate change on soil-stored carbon. One current opinion is that the decomposition of soil labile carbon is sensitive to temperature variation whereas resistant components are insensitive. The resistant carbon or organic matter in mineral soil is then assumed to be unresponsive to global warming. But the global pattern and magnitude of the predicted future soil carbon stock will mainly rely on the temperature sensitivity of these resistant carbon pools. To investigate this sensitivity, we have incubated soils under changing temperature. Here we report that SOM decomposition or soil basal respiration rate was significantly affected by changes in SOM components associated with soil depth, sampling method and incubation time. We find, however, that the temperature sensitivity for SOM decomposition was not affected, suggesting that the temperature sensitivity for resistant organic matter pools does not differ significantly from that of labile pools, and that both types of SOM will therefore respond similarly to global warming.
FengJG, WangJS, SongYJ, ZhuB (2018). Patterns of soil respiration and its temperature sensitivity in grassland ecosystems across China Biogeosciences, 15, 5329-5341. [本文引用: 1]
FiererN, ColmanBP, SchimelJP, JacksonRB (2006). Predicting the temperature dependence of microbial respiration in soil: a continental-scale analysis Global Biogeochemical Cycles, 20, GB3026. DOI: 10.1029/2005GB002644. [本文引用: 1]
FoereidB, WardDS, MahowaldN, PatersonE, LehmannJ (2014). The sensitivity of carbon turnover in the Community Land Model to modified assumptions about soil processes Earth System Dynamics, 5, 211-221. [本文引用: 1]
G?rden?sAI, ?grenGI, BirdJA, ClarholmM, HallinS, InesonP, K?ttererT, KnickerH, NilssonSI, N?sholmT, OglejS, PaustianK, PerssonT, StendahlJ (2011). Knowledge gaps in soil carbon and nitrogen interactions: from molecular to global scale Soil Biology & Biochemistry, 43, 702-717. [本文引用: 1]
GengY, WangYH, YangK, WangSP, ZengH, BaumannF, KuehnP, ScholtenT, HeJS (2012). Soil respiration in Tibetan alpine grasslands: belowground biomass and soil moisture, but not soil temperature, best explain the large-scale patterns PLOS ONE, 7, e34968. DOI: 10.1371/journal.pone.0031968. DOI:10.1371/journal.pone.0034968URLPMID:22509373 [本文引用: 1] The Tibetan Plateau is an essential area to study the potential feedback effects of soils to climate change due to the rapid rise in its air temperature in the past several decades and the large amounts of soil organic carbon (SOC) stocks, particularly in the permafrost. Yet it is one of the most under-investigated regions in soil respiration (Rs) studies. Here, Rs rates were measured at 42 sites in alpine grasslands (including alpine steppes and meadows) along a transect across the Tibetan Plateau during the peak growing season of 2006 and 2007 in order to test whether: (1) belowground biomass (BGB) is most closely related to spatial variation in Rs due to high root biomass density, and (2) soil temperature significantly influences spatial pattern of Rs owing to metabolic limitation from the low temperature in cold, high-altitude ecosystems. The average daily mean Rs of the alpine grasslands at peak growing season was 3.92 micromol CO(2) m(-2) s(-1), ranging from 0.39 to 12.88 micromol CO(2) m(-2) s(-1), with average daily mean Rs of 2.01 and 5.49 micromol CO(2) m(-2) s(-1) for steppes and meadows, respectively. By regression tree analysis, BGB, aboveground biomass (AGB), SOC, soil moisture (SM), and vegetation type were selected out of 15 variables examined, as the factors influencing large-scale variation in Rs. With a structural equation modelling approach, we found only BGB and SM had direct effects on Rs, while other factors indirectly affecting Rs through BGB or SM. Most (80%) of the variation in Rs could be attributed to the difference in BGB among sites. BGB and SM together accounted for the majority (82%) of spatial patterns of Rs. Our results only support the first hypothesis, suggesting that models incorporating BGB and SM can improve Rs estimation at regional scale.
GiardinaCP, RyanMG (2000). Evidence that decomposition rates of organic carbon in mineral soil do not vary with temperature Nature, 404, 858-861. DOI:10.1038/35009076URLPMID:10786789 [本文引用: 1] It has been suggested that increases in temperature can accelerate the decomposition of organic carbon contained in forest mineral soil (Cs), and, therefore, that global warming should increase the release of soil organic carbon to the atmosphere. These predictions assume, however, that decay constants can be accurately derived from short-term laboratory incubations of soil or that in situ incubations of fresh litter accurately represent the temperature sensitivity of Cs decomposition. But our limited understanding of the biophysical factors that control Cs decomposition rates, and observations of only minor increases in Cs decomposition rate with temperature in longer-term forest soil heating experiments and in latitudinal comparisons of Cs decomposition rates bring these predictions into question. Here we have compiled Cs decomposition data from 82 sites on five continents. We found that Cs decomposition rates were remarkably constant across a global-scale gradient in mean annual temperature. These data suggest that Cs decomposition rates for forest soils are not controlled by temperature limitations to microbial activity, and that increased temperature alone will not stimulate the decomposition of forest-derived carbon in mineral soil.
JiaX, ZhaXT, WuB, ZhangYQ, ChenWJ, WangXP, YuHQ, HeGM (2013). Temperature response of soil respiration in a Chinese pine plantation: hysteresis and seasonal vs. diel Q10 PLOS ONE, 8, e57858. DOI: 10.1371/journal.pone.0057858. [本文引用: 2]
KlimekB, ChoczyńskiΜ, JuszkiewiczA (2009). Scots pine (Pinus sylvestris L.) roots and soil moisture did not affect soil thermal sensitivity European Journal of Soil Biology, 45, 442-447. [本文引用: 1]
KnappAK, HooverDL, WilcoxKR, AvolioML, KoernerSE, La PierreKJ, LoikME, LuoY, SalaOE, SmithMD (2015). Characterizing differences in precipitation regimes of extreme wet and dry years: implications for climate change experiments Global Change Biology, 21, 2624-2633. DOI:10.1111/gcb.12888URLPMID:25652911 [本文引用: 1] 60% for dry years and to >150% for wet years in arid regions (MAP99th percentile of all events); these occurred twice as often in extreme wet years compared to average years. In contrast, these large precipitation events were rare in extreme dry years. Less important for distinguishing extreme wet from dry years were mean event size and frequency, or the number of dry days between events. However, extreme dry years were distinguished from average years by an increase in the number of dry days between events. These precipitation regime attributes consistently differed between extreme wet and dry years across 12 major terrestrial ecoregions from around the world, from deserts to the tropics. Thus, we recommend that climate change experiments and model simulations incorporate these differences in key precipitation regime attributes, as well as amount into treatments. This will allow experiments to more realistically simulate extreme precipitation years and more accurately assess the ecological consequences.]]>
Lellei-KovácsE, Kovács-LángE, Botta-DukátZ, KalaposT, EmmettB, BeierC (2011). Thresholds and interactive effects of soil moisture on the temperature response of soil respiration European Journal of Soil Biology, 47, 247-255. [本文引用: 1]
LentonTM, HuntingfordC (2003). Global terrestrial carbon storage and uncertainties in its temperature sensitivity examined with a simple model Global Change Biology, 9, 1333-1352. [本文引用: 2]
LiJQ, NieM, PendallE, ReichPB, PeiJM, NohNJ, ZhuT, LiB, FangCM (2019). Biogeographic variation in temperature sensitivity of decomposition in forest soils Global Change Biology, 26, 1873-1885. URLPMID:31518470 [本文引用: 5]
LiJQ, PeiJM, PendallE, FangCM, NieM (2020). Spatial heterogeneity of temperature sensitivity of soil respiration: a global analysis of field observations Soil Biology & Biochemistry, 141, 107675. DOI: 10.1016/j.soilbio.2019.107675. DOI:10.1016/j.soilbio.2019.107675URL [本文引用: 4]
LiuY, HeNP, ZhuJX, LiX, YuGR, NiuSL, SunXM, WenXF (2017). Regional variation in the temperature sensitivity of soil organic matter decomposition in China’s forests and grasslands Global Change Biology, 23, 3393-3402. DOI:10.1111/gcb.13613URLPMID:28055123 [本文引用: 3] How to assess the temperature sensitivity (Q10 ) of soil organic matter (SOM) decomposition and its regional variation with high accuracy is one of the largest uncertainties in determining the intensity and direction of the global carbon (C) cycle in response to climate change. In this study, we collected a series of soils from 22 forest sites and 30 grassland sites across China to explore regional variation in Q10 and its underlying mechanisms. We conducted a novel incubation experiment with periodically changing temperature (5-30 degrees C), while continuously measuring soil microbial respiration rates. The results showed that Q10 varied significantly across different ecosystems, ranging from 1.16 to 3.19 (mean 1.63). Q10 was ordered as follows: alpine grasslands (2.01) > temperate grasslands (1.81) > tropical forests (1.59) > temperate forests (1.55) > subtropical forests (1.52). The Q10 of grasslands (1.90) was significantly higher than that of forests (1.54). Furthermore, Q10 significantly increased with increasing altitude and decreased with increasing longitude. Environmental variables and substrate properties together explained 52% of total variation in Q10 across all sites. Overall, pH and soil electrical conductivity primarily explained spatial variation in Q10 . The general negative relationships between Q10 and substrate quality among all ecosystem types supported the C quality temperature (CQT) hypothesis at a large scale, which indicated that soils with low quality should have higher temperature sensitivity. Furthermore, alpine grasslands, which had the highest Q10 , were predicted to be more sensitive to climate change under the scenario of global warming.
LiuYC, LiuSR, WanSQ, WangJX, LuanJW, WangH (2016). Differential responses of soil respiration to soil warming and experimental throughfall reduction in a transitional oak forest in central China Agricultural and Forest Meteorology, 226-227, 186-198. DOI:10.1016/j.agrformet.2016.06.003URL [本文引用: 1]
LuF, HuHF, SunWJ, LuF, HuH, SunW, ZhuJ, LiuG, ZouW, ZhangQ, ShiP, LiuX, WuX, ZhangL, WeiX, DaiL, ZhangK, SunY, XueS, ZhangW, XiongD, DengL, LiuB, ZhouL, ZhangC, ZhengX, CaoJ, HuangY, HeN, ZhouG, BaiY, XieZ, TangZ, WuB, FangJ, LiuG, YuG (2018). Effects of national ecological restoration projects on carbon sequestration in China from 2001 to 2010 Proceeding of the National Academy of Science of the United States of America, 115, 4039-4044. [本文引用: 1]
MahechaMD, ReichsteinM, CarvalhaisN, LasslopG, LangeH, SeneviratneS, VargasR, AmmannC, ArainMA, CescattiA, JanssensIA, MigliavaccaM, MontagnaniL, RichardsonAD (2010). Global convergence in the temperature sensitivity of respiration at ecosystem level Science, 329, 838-840. DOI:10.1126/science.1189587URLPMID:20603495 [本文引用: 1] The respiratory release of carbon dioxide (CO(2)) from the land surface is a major flux in the global carbon cycle, antipodal to photosynthetic CO(2) uptake. Understanding the sensitivity of respiratory processes to temperature is central for quantifying the climate-carbon cycle feedback. We approximated the sensitivity of terrestrial ecosystem respiration to air temperature (Q(10)) across 60 FLUXNET sites with the use of a methodology that circumvents confounding effects. Contrary to previous findings, our results suggest that Q(10) is independent of mean annual temperature, does not differ among biomes, and is confined to values around 1.4 +/- 0.1. The strong relation between photosynthesis and respiration, by contrast, is highly variable among sites. The results may partly explain a less pronounced climate-carbon cycle feedback than suggested by current carbon cycle climate models.
MoinetGYK, HuntJE, KirschbaumMUF, MorcomCP, MidwoodAJ, MillardP (2018). The temperature sensitivity of soil organic matter decomposition is constrained by microbial access to substrates Soil Biology & Biochemistry, 116, 333-339. [本文引用: 1]
OlssonBA, HanssonK, PerssonT, BeukerE, HelmisaariHS (2012). Heterotrophic respiration and nitrogen mineralisation in soils of Norway spruce, scots pine and silver birch stands in contrasting climates Forest Ecology & Management, 269, 197-205. [本文引用: 1]
PengSS, PiaoSL, WangT, SunJY, ShenZH (2009). Temperature sensitivity of soil respiration in different ecosystems in China Soil Biology & Biochemistry, 41, 1008-1014. [本文引用: 9]
PetersonME, DanielRM, DansonMJ, EisenthalR (2007). The dependence of enzyme activity on temperature: determination and validation of parameters Biochemical Journal, 402, 331-337. DOI:10.1042/BJ20061143URLPMID:17092210 [本文引用: 1] Traditionally, the dependence of enzyme activity on temperature has been described by a model consisting of two processes: the catalytic reaction defined by DeltaG(Dagger)(cat), and irreversible inactivation defined by DeltaG(Dagger)(inact). However, such a model does not account for the observed temperature-dependent behaviour of enzymes, and a new model has been developed and validated. This model (the Equilibrium Model) describes a new mechanism by which enzymes lose activity at high temperatures, by including an inactive form of the enzyme (E(inact)) that is in reversible equilibrium with the active form (E(act)); it is the inactive form that undergoes irreversible thermal inactivation to the thermally denatured state. This equilibrium is described by an equilibrium constant whose temperature-dependence is characterized in terms of the enthalpy of the equilibrium, DeltaH(eq), and a new thermal parameter, T(eq), which is the temperature at which the concentrations of E(act) and E(inact) are equal; T(eq) may therefore be regarded as the thermal equivalent of K(m). Characterization of an enzyme with respect to its temperature-dependent behaviour must therefore include a determination of these intrinsic properties. The Equilibrium Model has major implications for enzymology, biotechnology and understanding the evolution of enzymes. The present study presents a new direct data-fitting method based on fitting progress curves directly to the Equilibrium Model, and assesses the robustness of this procedure and the effect of assay data on the accurate determination of T(eq) and its associated parameters. It also describes simpler experimental methods for their determination than have been previously available, including those required for the application of the Equilibrium Model to non-ideal enzyme reactions.
PotterCS, RandersonJT, FieldCB, MatsonPA, VitousekPM, MooneyHA, KloosterSA (1993). Terrestrial ecosystem production: a process model based on global satellite and surface data Global Biogeochemical Cycles, 7, 811-841. [本文引用: 1]
RaichJW, RastetterEB, MelilloJM, KicklighterDW, SteudlerPA, PetersonBJ, GraceAL, Moore IIIB, V?r?smartyCJ (1991). Potential net primary productivity in south America: application of a global modle Ecological Applications, 1, 399-429. DOI:10.2307/1941899URLPMID:27755669 [本文引用: 1] We use a mechanistically based ecosystem simulation model to describe and analyze the spatial and temporal patterns of terrestrial net primary productivity (NPP) in South America. The Terrestrial Ecosystem Model (TEM) is designed to predict major carbon and nitrogen fluxes and pool sizes in terrestrial ecosystems at continental to global scales. Information from intensively studies field sites is used in combination with continental-scale information on climate, soils, and vegetation to estimate NPP in each of 5888 non-wetland, 0.5 degrees latitude degrees 0.5 degrees longitude grid cells in South America, at monthly time steps. Preliminary analyses are presented for the scenario of natural vegetation throughout the continent, as a prelude to evaluating human impacts on terrestrial NPP. The potential annual NPP of South America is estimated to be 12.5 Pg/yr of carbon (26.3 Pg/yr of organic matter) in a non-wetland area of 17.0 degrees 10(6) km(2) . More than 50% of this production occurs in the tropical and subtropical evergreen forest region. Six independent model runs, each based on an independently derived set of model parameters, generated mean annual NPP estimates for the tropical evergreen forest region ranging from 900 to 1510 g degrees m(-)(2) degrees yr(-)(1) of carbon, with an overall mean of 1170 g degrees m(-)(2) degrees yr(-)(1) . Coefficients of variation in estimated annual NPP averaged 20% for any specific location in the evergreen forests, which is probably within the confidence limits of extant NPP measurements. Predicted rates of mean annual NPP in other types of vegetation ranged from 95 g degrees m(-)(2) degrees yr(-)(1) in arid shrublands to 930 g degrees m(@) ?yr(-)(1) in savannas, and were within the ranges measured in empirical studies. The spatial distribution of predicted NPP was directly compared with estimates made using the Miami mode of Lieth (1975). Overall, TEM predictions were degrees 10% lower than those of the Miami model, but the two models agreed closely on the spatial patterns of NPP in south America. Unlike previous models, however, TEM estimates NPP monthly, allowing for the evaluation of seasonal phenomena. This is an important step toward integration of ecosystem models with remotely sensed information, global climate models, and atmospheric transport models, all of which are evaluated at comparable spatial and temporal scales. Seasonal patterns of NPP in South America are correlated with moisture availability in most vegetation types, but are strongly influenced by seasonal differences in cloudiness in the tropical evergreen forests. On an annual basis, moisture availability was the factor that was correlated most strongly with annual NPP in South America, but differences were again observed among vegetation types. These results allow for the investigation and analysis of climatic controls over NPP at continental scales, within and among vegetation types, and within years. Further model validation is needed. Nevertheless, the ability to investigate NPP-environment interactions with a high spatial and temporal resolution at continental scales should prove useful if not essential for rigorous analysis of the potential effects of global climate changes on terrestrial ecosystems.
ReichPB, OleksynJ, ModrzynskiJ, MrozinskiP, HobbieSE, EissenstatDM, ChoroverJ, ChadwickOA, HaleCM, TjoelkerMG (2005). Linking litter calcium, earthworms and soil properties: a common garden test with 14 tree species Ecology Letters, 8, 811-818. [本文引用: 1]
ReichsteinM, TenhunenJ, RoupsarO, OurcivalJ, RambalS, MigliettaF, PeressottiA, PecchiariM, TironeG, ValentiniR (2002). Severe drought effects on ecosystem CO2 and H2O fluxes at three Mediterranean evergreen sites: revision of current hypotheses? Global Change Biology, 8, 999-1017. [本文引用: 1]
RustadLE, CampbellJL, MarionGM, NorbyRJ, MitchellMJ, HartleyAE (2001). A meta-analysis of the response of soil respiration, net nitrogen mineralization, and aboveground plant growth to experimental ecosystem warming Oecologia, 126, 543-562. URLPMID:28547240 [本文引用: 1]
Schermelleh-EngelK, MoosbruggerH, MüllerH (2003). Evaluating the fit of structural equation models: tests of significance and descriptive goodness-of-fit measures Methods of Psychological Research Online, 8, 23-74. [本文引用: 1]
SchipperLA, HobbsJK, RutledgeS, ArcusVL (2014). Thermodynamic theory explains the temperature optima of soil microbial processes and high Q10 values at low temperatures Global Change Biology, 20, 3578-3586. DOI:10.1111/gcb.2014.20.issue-11URL [本文引用: 2]
SchlesingerWH, AndrewsJA (2000). Soil respiration and the global carbon cycle Biogeochemistry, 48, 7-20. DOI:10.1023/A:1006247623877URL [本文引用: 1] Soil respiration is the primary path by which CO2fixed by land plants returns to the atmosphere. Estimated at approximately 75 × 1015gC/yr, this large natural flux is likely to increase due changes in the Earth's condition. The objective of this paper is to provide a brief scientific review for policymakers who are concerned that changes in soil respiration may contribute to the rise in CO2in Earth's atmosphere. Rising concentrations of CO2in the atmosphere will increase the flux of CO2from soils, while simultaneously leaving a greater store of carbon in the soil. Traditional tillage cultivation and rising temperature increase the flux of CO2from soils without increasing the stock of soil organic matter. Increasing deposition of nitrogen from the atmosphere may lead to the sequestration of carbon in vegetation and soils. The response of the land biosphere to simultaneous changes in all of these factors is unknown, but a large increase in the soil carbon pool seems unlikely to moderate the rise in atmospheric CO2during the next century.]]>
SongXZ, PengCH, ZhaoZY, ZhangZT, GuoBH, WangWF, JiangH, ZhuQ (2014). Quantification of soil respiration in forest ecosystems across China Atmospheric Environment, 94, 546-551. DOI:10.1016/j.atmosenv.2014.05.071URL [本文引用: 4]
State Forestry and Grassland Administration (2014). Chinese Forest Resources Report, the Eighth National Forest Resources Inventory. China Forestry Publishing House, Beijing. [本文引用: 1]
State Forestry and Grassland Administration (2019). How is the forest coverage rate investigated? http://www.forestry.gov.cn/. Cited: 2019-06-17. URL [本文引用: 1]
SteinbauerMJ, GrytnesJA, JurasinskiG, KulonenA, LenoirJ, PauliH, RixenC, WinklerM, Bardy-DurchhalterM, BarniE, BjorkmanAD, BreinerFT, BurgS, CzortekP, DawesMA, DelimatA, DullingerS, ErschbamerB, FeldeVA, Fernández-ArberasO, FossheimKF, Gómez-GarcíaD, GeorgesD, GrindrudET, HaiderS, HaugumSV, HenriksenH, HerrerosMJ, JaroszewiczB, JaroszynskaF, KankaR, KapferJ, KlanderudK, KühnI, LamprechtA, MatteodoM, di CellaUM, NormandS, OdlandA, OlsenSL, PalacioS, PeteyM, PiscováV, SedlakovaB, SteinbauerK, St?ckliV, SvenningJC, TeppaG, TheurillatJP, VittozP, WoodinSJ, ZimmermannNE, WipfS (2018). Accelerated increase in plant species richness on mountain summits is linked to warming Nature, 556, 231-234. DOI:10.1038/s41586-018-0005-6URLPMID:29618821 [本文引用: 1] Globally accelerating trends in societal development and human environmental impacts since the mid-twentieth century (1-7) are known as the Great Acceleration and have been discussed as a key indicator of the onset of the Anthropocene epoch (6) . While reports on ecological responses (for example, changes in species range or local extinctions) to the Great Acceleration are multiplying (8, 9) , it is unknown whether such biotic responses are undergoing a similar acceleration over time. This knowledge gap stems from the limited availability of time series data on biodiversity changes across large temporal and geographical extents. Here we use a dataset of repeated plant surveys from 302 mountain summits across Europe, spanning 145 years of observation, to assess the temporal trajectory of mountain biodiversity changes as a globally coherent imprint of the Anthropocene. We find a continent-wide acceleration in the rate of increase in plant species richness, with five times as much species enrichment between 2007 and 2016 as fifty years ago, between 1957 and 1966. This acceleration is strikingly synchronized with accelerated global warming and is not linked to alternative global change drivers. The accelerating increases in species richness on mountain summits across this broad spatial extent demonstrate that acceleration in climate-induced biotic change is occurring even in remote places on Earth, with potentially far-ranging consequences not only for biodiversity, but also for ecosystem functioning and services.
Van’t HoffJH (1898). Lectures on Theoretical and Physical Chemistry. Part Ι: Chemical Dynamics Edward Arnold, London. [本文引用: 2]
WangB, ZhaTS, JiaX, GongJN, BourqueC, FengW, TianY, WuB, ZhangYQ, PeltoH (2017). Soil water regulates the control of photosynthesis on diel hysteresis between soil respiration and temperature in a desert shrubland Biogeosciences, 14, 3899-3908. [本文引用: 1]
WangB, ZhaTS, JiaX, WuB, ZhangYQ, QinSG (2014). Soil moisture modifies the response of soil respiration to temperature in a desert shrub ecosystem Biogeosciences, 11, 259-268. [本文引用: 2]
WangLP, WenM, SongJX, DouXY (2016). Spatial-temporal Variation of Aridity Index during 1961-2014 in China Journal of Natural Resources, 31, 1488-1498. [本文引用: 2]
WangQK, LiuSG, TianP (2018a). Carbon quality and soil microbial property control the latitudinal pattern in temperature sensitivity of soil microbial respiration across Chinese forest ecosystems Global Change Biology, 24, 2841-2849. DOI:10.1111/gcb.14105URLPMID:29476638 [本文引用: 1] Understanding the temperature sensitivity (Q10 ) of soil organic C (SOC) decomposition is critical to quantifying the climate-carbon cycle feedback and predicting the response of ecosystems to climate change. However, the driving factors of the spatial variation in Q10 at a continental scale are fully unidentified. In this study, we conducted a novel incubation experiment with periodically varying temperature based on the mean annual temperature of the soil origin sites. A total of 140 soil samples were collected from 22 sites along a 3,800 km long north-south transect of forests in China, and the Q10 of soil microbial respiration and corresponding environmental variables were measured. Results showed that changes in the Q10 values were nonlinear with latitude, particularly showing low Q10 values in subtropical forests and high Q10 values in temperate forests. The soil C:N ratio was positively related to the Q10 values, and coniferous forest soils with low SOC quality had higher Q10 values than broadleaved forest soils with high SOC quality, which supported the
WangX, PiaoSL, CiaisP, JanssensIA, ReichsteinM, PengSS, WangT (2010). Are ecological gradients in seasonal Q10 of soil respiration explained by climate or by vegetation seasonality? Soil Biology & Biochemistry, 42, 1728-1734. DOI:10.1016/j.soilbio.2010.06.008URL [本文引用: 3]
WangYH, SongC, YuLF, MiZR, WangSP, ZengH, FangCM, LiJY, HeJS (2018b). Convergence in temperature sensitivity of soil respiration: evidence from the Tibetan alpine grasslands Soil Biology & Biochemistry, 122, 50-59. [本文引用: 1]
XuZF, TangSS, XiongL, YangWQ, YinHJ, TuLH, WuFZ, ChenLH, TanB (2015). Temperature sensitivity of soil respiration in China’s forest ecosystems: patterns and controls Applied Soil Ecology, 93, 105-110. [本文引用: 10]
YanT, SongHH, WangZQ, TeramotoM, WangJS, LiangNS, MaC, SunZZ, XiY, LiLL, PengSS (2019). Temperature sensitivity of soil respiration across multiple time scales in a temperate plantation forest The Science of the Total Environment, 688, 479-485. URLPMID:31254813 [本文引用: 2]
Yvon-DurocherG, CaffreyJM, CescattiA, CescattiA, DossenaM, GiorgioPD, GasolJM, MontoyaJM, PumpanenJ, StaehrPA, TrimmerM, WoodwardG, AllenAP (2012). Reconciling the temperature dependence of respiration across timescales and ecosystem types Nature, 487, 472-476. DOI:10.1038/nature11205URLPMID:22722862 [本文引用: 1] Ecosystem respiration is the biotic conversion of organic carbon to carbon dioxide by all of the organisms in an ecosystem, including both consumers and primary producers. Respiration exhibits an exponential temperature dependence at the subcellular and individual levels, but at the ecosystem level respiration can be modified by many variables including community abundance and biomass, which vary substantially among ecosystems. Despite its importance for predicting the responses of the biosphere to climate change, it is as yet unknown whether the temperature dependence of ecosystem respiration varies systematically between aquatic and terrestrial environments. Here we use the largest database of respiratory measurements yet compiled to show that the sensitivity of ecosystem respiration to seasonal changes in temperature is remarkably similar for diverse environments encompassing lakes, rivers, estuaries, the open ocean and forested and non-forested terrestrial ecosystems, with an average activation energy similar to that of the respiratory complex (approximately 0.65 electronvolts (eV)). By contrast, annual ecosystem respiration shows a substantially greater temperature dependence across aquatic (approximately 0.65 eV) versus terrestrial ecosystems (approximately 0.32 eV) that span broad geographic gradients in temperature. Using a model derived from metabolic theory, these findings can be reconciled by similarities in the biochemical kinetics of metabolism at the subcellular level, and fundamental differences in the importance of other variables besides temperature-such as primary productivity and allochthonous carbon inputs-on the structure of aquatic and terrestrial biota at the community level.
ZhaoJX, LiRC, LiX, TianLX (2017). Environmental controls on soil respiration in alpine meadow along a large altitudinal gradient on the central Tibetan Plateau Catena, 159, 84-92. [本文引用: 2]
ZhengTL, ZhuJL, WangSP, FangJY (2016). When will China achieve its carbon emission peak? National Science Review, 3, 8-12. [本文引用: 1]
ZhengZ, YuGR, FuYL, WangYS, SunXM, WangYH (2009). Temperature sensitivity of soil respiration is affected by prevailing climatic conditions and soil organic carbon content: a trans-China based case study Soil Biology & Biochemistry, 41, 1531-1540. [本文引用: 3]
ZhouT, ShiPJ, HuiDF, LuoYQ (2009). Global pattern of temperature sensitivity of soil heterotrophic respiration (Q10) and its implications for carbon-climate feedback Journal of Geophysical Research, 114, 271-274. [本文引用: 3]
Appropriate experimental ecosystem warming methods by ecosystem, objective, and practicality 1 2009
... 全球气候变暖深刻影响着陆地生态系统的分布、结构与功能(Aronson & McNulty, 2009; Steinbauer et al., 2018), 而土壤呼吸的温度敏感性是决定陆地碳循环与气候变化间反馈关系的关键参数(Lenton & Huntingford, 2003; Bond-Lamberty & Thomson, 2010).众多研究采用Q10值(即温度每升高10 ℃, 土壤呼吸速率增加的倍数)来量化土壤呼吸的温度敏感性, 并剖析了Q10的时空变化规律(Davidson et al., 2006; Zhou et al., 2009; Bond- Lamberty et al., 2018; Yan et al., 2019).尽管对Q10在时间动态(季节、年际)的认识已比较明确(Jia et al., 2013; Wang et al., 2017; Yan et al., 2019), 但其空间变异特征和影响因素依然存在较大不确定性. ...
Globally rising soil heterotrophic respiration over recent decades 2 2018
... 全球气候变暖深刻影响着陆地生态系统的分布、结构与功能(Aronson & McNulty, 2009; Steinbauer et al., 2018), 而土壤呼吸的温度敏感性是决定陆地碳循环与气候变化间反馈关系的关键参数(Lenton & Huntingford, 2003; Bond-Lamberty & Thomson, 2010).众多研究采用Q10值(即温度每升高10 ℃, 土壤呼吸速率增加的倍数)来量化土壤呼吸的温度敏感性, 并剖析了Q10的时空变化规律(Davidson et al., 2006; Zhou et al., 2009; Bond- Lamberty et al., 2018; Yan et al., 2019).尽管对Q10在时间动态(季节、年际)的认识已比较明确(Jia et al., 2013; Wang et al., 2017; Yan et al., 2019), 但其空间变异特征和影响因素依然存在较大不确定性. ...
... Q10随SOC和TN的增加而增大, 与现有的研究结果一致(Zheng et al., 2009; Song et al., 2014).土壤有机碳是土壤微生物呼吸的重要底物(Bond-Lamberty et al., 2018), 在其他环境因素不变的条件下, SOC较高的生态系统其土壤微生物呼吸速率随温度升高的幅度也较大, 因此Q10更高.由于土壤中碳氮存在紧密的耦合关系, 二者是协同积累的(G?rden?s et al., 2011), 因此SOC和TN呈正相关关系(图5A).此外, 尽管有研究发现Q10与底物质量(C:N)呈负相关关系(Fierer et al., 2006; Liu et al., 2017; Wang et al., 2018a), 但本研究中Q10与C:N无显著关系(图4I), 这表明Q10的空间变异可能不受底物质量的影响.一些室内培养实验也表明有机质分解对温度的响应与底物质量无关(Fang et al., 2005; Li et al., 2019), 还有研究发现土壤基质对有机质的保护作用对Q10的影响远超过底物质量(Moinet et al., 2018), Li等(2019)的研究进一步强调了土壤保护性因子(如黏粒含量)对Q10空间变异的重要性. ...
Temperature-associated increases in the global soil respiration record 3 2010
... 全球气候变暖深刻影响着陆地生态系统的分布、结构与功能(Aronson & McNulty, 2009; Steinbauer et al., 2018), 而土壤呼吸的温度敏感性是决定陆地碳循环与气候变化间反馈关系的关键参数(Lenton & Huntingford, 2003; Bond-Lamberty & Thomson, 2010).众多研究采用Q10值(即温度每升高10 ℃, 土壤呼吸速率增加的倍数)来量化土壤呼吸的温度敏感性, 并剖析了Q10的时空变化规律(Davidson et al., 2006; Zhou et al., 2009; Bond- Lamberty et al., 2018; Yan et al., 2019).尽管对Q10在时间动态(季节、年际)的认识已比较明确(Jia et al., 2013; Wang et al., 2017; Yan et al., 2019), 但其空间变异特征和影响因素依然存在较大不确定性. ...
... 一些研究认为Q10在不同生态系统间具有趋同性, 不随气候、土壤和生物因素的变化而变化(Bond-Lamberty & Thomson, 2010; Yvon- Durocher et al., 2012; Wang et al., 2018b).如Mahecha等(2010)通过整合全球60个站点的数据, 发现去除季节性混淆因素的影响后, Q10在不同的生物区系之间相似(1.4 ± 0.1).因此, 在许多陆地生态系统碳循环模型中, Q10被假定为一个常数, 如Q10在Community Land Model (CLM)模型中为1.5 (Foereid et al., 2014), 而在Terrestrial Ecosystem Model (TEM)和Carnegie- Ames-Stanford Approach (CASA)模型中为2 (Raich et al., 1991; Potter et al., 1993).而另一些研究发现Q10在不同生态系统间差异显著, 使用固定Q10值估算土壤呼吸会导致较大偏差(Chen & Tian, 2005; Zhou et al., 2009), 近年来, 大量野外观测和数据整合分析也发现在区域尺度上Q10存在较大空间变异(1.09-5.51)(Lenton & Huntingford, 2003; Peng et al., 2009; Xu et al., 2015).因此, Q10的空间变异规律仍需进一步研究. ...
Managing forests for climate change mitigation 1 2008
Does a general temperature-dependent Q10 model of soil respiration exist at biome and global scale? 3 2005
... 一些研究认为Q10在不同生态系统间具有趋同性, 不随气候、土壤和生物因素的变化而变化(Bond-Lamberty & Thomson, 2010; Yvon- Durocher et al., 2012; Wang et al., 2018b).如Mahecha等(2010)通过整合全球60个站点的数据, 发现去除季节性混淆因素的影响后, Q10在不同的生物区系之间相似(1.4 ± 0.1).因此, 在许多陆地生态系统碳循环模型中, Q10被假定为一个常数, 如Q10在Community Land Model (CLM)模型中为1.5 (Foereid et al., 2014), 而在Terrestrial Ecosystem Model (TEM)和Carnegie- Ames-Stanford Approach (CASA)模型中为2 (Raich et al., 1991; Potter et al., 1993).而另一些研究发现Q10在不同生态系统间差异显著, 使用固定Q10值估算土壤呼吸会导致较大偏差(Chen & Tian, 2005; Zhou et al., 2009), 近年来, 大量野外观测和数据整合分析也发现在区域尺度上Q10存在较大空间变异(1.09-5.51)(Lenton & Huntingford, 2003; Peng et al., 2009; Xu et al., 2015).因此, Q10的空间变异规律仍需进一步研究. ...
... Q10的空间变异主要受气候、土壤和植被因素的影响.许多研究表明Q10随温度和降水量的增加而减小(Peng et al., 2009; Wang et al., 2010; Song et al., 2014; Xu et al., 2015), 然而Chen和Tian (2005)的研究表明Q10在热带和亚热带地区不受温度的影响, Zheng等(2009)的研究则表明Q10与降水量无显著关系, 但随温度的增加而减小.土壤水分对Q10的影响较复杂, Q10随土壤水分的增加而增大、不变或减小(Klimek et al., 2009; Wang et al., 2014; Zhao et al., 2017).其他一些研究表明Q10随土壤有机碳含量(SOC)、土壤总氮含量(TN)、土壤pH的增加而增大, 随可溶性有机碳含量的增加而减小(Zhou et al., 2009; Song et al., 2014; Liu et al.,2017; Zhao et al., 2017).还有研究表明Q10随植被活动(归一化植被指数(NDVI)季节变幅、叶面积指数(LAI)季节变幅)的增强而增大(Curiel Yuste et al., 2004; Wang et al., 2010).因此, 对于Q10空间变异的影响因素仍缺乏一致认识. ...
... 以往关于Q10空间变异影响因素的研究往往忽略了不同影响因素间的交互作用, 各因素对Q10的直接和间接影响, 以及不同类型生态系统Q10对气候和土壤因素的响应差异, 从而可能造成结果的不确定性.众多研究发现温度和水分之间存在交互作用, 即温度对土壤呼吸的影响随水分条件的变化而变化(Lellei-Kovács et al., 2011; Wang et al., 2014; Liu et al., 2016).Liu等(2017)通过整合文献数据, 发现年平均气温(MAT)和年降水量(MAP)不仅可以直接影响Q10, 还可以通过土壤理化性质和微生物群落间接影响Q10.Chen和Tian (2005)发现Q10在三类生物区系间对温度的响应不同, 其对温度变化的敏感性在寒带最高, 其次是温带, 而在热带和亚热带最低.近年来, 在不同生态系统中土壤呼吸观测数据不断积累, 这为通过整合分析检验在区域尺度上Q10的空间变异特征及其影响因素创造了条件. ...
Annual Q10 of soil respiration reflects plant phenological patterns as well as temperature sensitivity 2 2004
... Q10的空间变异主要受气候、土壤和植被因素的影响.许多研究表明Q10随温度和降水量的增加而减小(Peng et al., 2009; Wang et al., 2010; Song et al., 2014; Xu et al., 2015), 然而Chen和Tian (2005)的研究表明Q10在热带和亚热带地区不受温度的影响, Zheng等(2009)的研究则表明Q10与降水量无显著关系, 但随温度的增加而减小.土壤水分对Q10的影响较复杂, Q10随土壤水分的增加而增大、不变或减小(Klimek et al., 2009; Wang et al., 2014; Zhao et al., 2017).其他一些研究表明Q10随土壤有机碳含量(SOC)、土壤总氮含量(TN)、土壤pH的增加而增大, 随可溶性有机碳含量的增加而减小(Zhou et al., 2009; Song et al., 2014; Liu et al.,2017; Zhao et al., 2017).还有研究表明Q10随植被活动(归一化植被指数(NDVI)季节变幅、叶面积指数(LAI)季节变幅)的增强而增大(Curiel Yuste et al., 2004; Wang et al., 2010).因此, 对于Q10空间变异的影响因素仍缺乏一致认识. ...
... 中国森林生态系统Q10具有一定的集中趋势, 大多数(72%)分布在1.5-3.0之间(平均值: 2.37)(图2A).以往的整合分析也报道了类似的集中趋势, 如Wang等(2010)发现有69%的Q10分布在1.5-3.0之间(平均值: 2.40); Xu等(2015)发现有54%的Q10分布在2.0-3.0之间.尽管Q10有一定的集中趋势, 但仍存在较大的空间变异(全距: 1.09-6.24; 变异系数: 33%).一些研究也发现, 森林生态系统Q10在1.0-6.3之间变化(Davidson et al., 1998; Zheng et al., 2009; Xu et al., 2015). ...
Soil water content and temperature as independent or confounded factors controlling soil respiration in a temperate mixed hardwood forest 1998
On the variability of respiration in terrestrial ecosystems: moving beyond Q10 1 2006
... 全球气候变暖深刻影响着陆地生态系统的分布、结构与功能(Aronson & McNulty, 2009; Steinbauer et al., 2018), 而土壤呼吸的温度敏感性是决定陆地碳循环与气候变化间反馈关系的关键参数(Lenton & Huntingford, 2003; Bond-Lamberty & Thomson, 2010).众多研究采用Q10值(即温度每升高10 ℃, 土壤呼吸速率增加的倍数)来量化土壤呼吸的温度敏感性, 并剖析了Q10的时空变化规律(Davidson et al., 2006; Zhou et al., 2009; Bond- Lamberty et al., 2018; Yan et al., 2019).尽管对Q10在时间动态(季节、年际)的认识已比较明确(Jia et al., 2013; Wang et al., 2017; Yan et al., 2019), 但其空间变异特征和影响因素依然存在较大不确定性. ...
Minimizing artifacts and biases in chamber-based measurements of soil respiration 1 2002
Similar response of labile and resistant soil organic matter pools to changes in temperature 1 2005
... Q10随SOC和TN的增加而增大, 与现有的研究结果一致(Zheng et al., 2009; Song et al., 2014).土壤有机碳是土壤微生物呼吸的重要底物(Bond-Lamberty et al., 2018), 在其他环境因素不变的条件下, SOC较高的生态系统其土壤微生物呼吸速率随温度升高的幅度也较大, 因此Q10更高.由于土壤中碳氮存在紧密的耦合关系, 二者是协同积累的(G?rden?s et al., 2011), 因此SOC和TN呈正相关关系(图5A).此外, 尽管有研究发现Q10与底物质量(C:N)呈负相关关系(Fierer et al., 2006; Liu et al., 2017; Wang et al., 2018a), 但本研究中Q10与C:N无显著关系(图4I), 这表明Q10的空间变异可能不受底物质量的影响.一些室内培养实验也表明有机质分解对温度的响应与底物质量无关(Fang et al., 2005; Li et al., 2019), 还有研究发现土壤基质对有机质的保护作用对Q10的影响远超过底物质量(Moinet et al., 2018), Li等(2019)的研究进一步强调了土壤保护性因子(如黏粒含量)对Q10空间变异的重要性. ...
Patterns of soil respiration and its temperature sensitivity in grassland ecosystems across China 1 2018
... Q10对温度测定深度十分敏感(在同一地点, Q10通常随温度测定深度的增加而增大) (Peng et al., 2009; Feng et al., 2018), 由于使用土壤5 cm深处土壤温度计算Q10的文献数量最多, 本研究仅选用由 (5 ± 1) cm深处土壤温度计算的Q10. ...
Predicting the temperature dependence of microbial respiration in soil: a continental-scale analysis 1 2006
... Q10随SOC和TN的增加而增大, 与现有的研究结果一致(Zheng et al., 2009; Song et al., 2014).土壤有机碳是土壤微生物呼吸的重要底物(Bond-Lamberty et al., 2018), 在其他环境因素不变的条件下, SOC较高的生态系统其土壤微生物呼吸速率随温度升高的幅度也较大, 因此Q10更高.由于土壤中碳氮存在紧密的耦合关系, 二者是协同积累的(G?rden?s et al., 2011), 因此SOC和TN呈正相关关系(图5A).此外, 尽管有研究发现Q10与底物质量(C:N)呈负相关关系(Fierer et al., 2006; Liu et al., 2017; Wang et al., 2018a), 但本研究中Q10与C:N无显著关系(图4I), 这表明Q10的空间变异可能不受底物质量的影响.一些室内培养实验也表明有机质分解对温度的响应与底物质量无关(Fang et al., 2005; Li et al., 2019), 还有研究发现土壤基质对有机质的保护作用对Q10的影响远超过底物质量(Moinet et al., 2018), Li等(2019)的研究进一步强调了土壤保护性因子(如黏粒含量)对Q10空间变异的重要性. ...
The sensitivity of carbon turnover in the Community Land Model to modified assumptions about soil processes 1 2014
... 一些研究认为Q10在不同生态系统间具有趋同性, 不随气候、土壤和生物因素的变化而变化(Bond-Lamberty & Thomson, 2010; Yvon- Durocher et al., 2012; Wang et al., 2018b).如Mahecha等(2010)通过整合全球60个站点的数据, 发现去除季节性混淆因素的影响后, Q10在不同的生物区系之间相似(1.4 ± 0.1).因此, 在许多陆地生态系统碳循环模型中, Q10被假定为一个常数, 如Q10在Community Land Model (CLM)模型中为1.5 (Foereid et al., 2014), 而在Terrestrial Ecosystem Model (TEM)和Carnegie- Ames-Stanford Approach (CASA)模型中为2 (Raich et al., 1991; Potter et al., 1993).而另一些研究发现Q10在不同生态系统间差异显著, 使用固定Q10值估算土壤呼吸会导致较大偏差(Chen & Tian, 2005; Zhou et al., 2009), 近年来, 大量野外观测和数据整合分析也发现在区域尺度上Q10存在较大空间变异(1.09-5.51)(Lenton & Huntingford, 2003; Peng et al., 2009; Xu et al., 2015).因此, Q10的空间变异规律仍需进一步研究. ...
Knowledge gaps in soil carbon and nitrogen interactions: from molecular to global scale 1 2011
... Q10随SOC和TN的增加而增大, 与现有的研究结果一致(Zheng et al., 2009; Song et al., 2014).土壤有机碳是土壤微生物呼吸的重要底物(Bond-Lamberty et al., 2018), 在其他环境因素不变的条件下, SOC较高的生态系统其土壤微生物呼吸速率随温度升高的幅度也较大, 因此Q10更高.由于土壤中碳氮存在紧密的耦合关系, 二者是协同积累的(G?rden?s et al., 2011), 因此SOC和TN呈正相关关系(图5A).此外, 尽管有研究发现Q10与底物质量(C:N)呈负相关关系(Fierer et al., 2006; Liu et al., 2017; Wang et al., 2018a), 但本研究中Q10与C:N无显著关系(图4I), 这表明Q10的空间变异可能不受底物质量的影响.一些室内培养实验也表明有机质分解对温度的响应与底物质量无关(Fang et al., 2005; Li et al., 2019), 还有研究发现土壤基质对有机质的保护作用对Q10的影响远超过底物质量(Moinet et al., 2018), Li等(2019)的研究进一步强调了土壤保护性因子(如黏粒含量)对Q10空间变异的重要性. ...
Soil respiration in Tibetan alpine grasslands: belowground biomass and soil moisture, but not soil temperature, best explain the large-scale patterns 1 2012
... 采用结构方程模型(SEM)来分析气候和土壤因素对Q10的直接和间接影响(Geng et al., 2012), 这两种影响均采用标准化的路径系数(使用极大似然法估计的多元回归系数)计算, 基于已有理论和变量间相关性, 建立了Q10与气候和土壤因素之间的初始SEM模型, 使用卡方检验(χ2; 当0 ≤ χ2 ≤ 2, 0.05 < p ≤ 1.00时模型具有较好的拟合优度)和近似误差均方根(RMSEA; 当0 ≤ RMSEA ≤ 0.05, 0.10 < p ≤ 1.00时模型具有较好的拟合优度)对模型的拟合优度进行评估(Schermelleh-Engel et al., 2003), 剔除初始模型中的非显著路径, 获得最终模型. ...
Evidence that decomposition rates of organic carbon in mineral soil do not vary with temperature 1 2000
... 中国森林Q10随MAT增加而减小(图4D), 表明较寒冷地区的土壤呼吸对温度升高的敏感性高于较温暖地区, 支持了现有的研究结论(Peng et al., 2009; Xu et al., 2015; Li et al., 2020).研究表明, MAT可以通过直接和间接途径影响Q10.首先, 根呼吸和微生物呼吸均需要酶的参与, 温度升高会导致酶活性的相对增加幅度下降(Peterson et al., 2007; Schipper et al., 2014; Li et al., 2020), 从而降低Q10; 大分子速率理论(MMRT)还表明Q10受酶催化反应热容差(ΔC?p)的强烈影响, ΔC?p随温度升高而降低, 导致Q10随温度升高而降低(Schipper et al., 2014; Li et al., 2020).其次, 尽管温度升高通过促进土壤微生物快速分解活性有机碳导致Q10随SOC增加而增大(Giardina & Ryan, 2000; Rustad et al., 2001), 但温暖地区较高的分解速率降低了SOC, 因此Q10较低(图5A).此外, MAT和MAP相互影响, 共同作用于Q10.本研究中MAT通过对Q10的直接和间接影响最终降低了Q10 (图5B).MAT每增加1 ℃, Q10下降5.7% (图4D), 该值与Peng等(2009)和Li等(2019)的估计值(6%)类似, 高于Xu等(2015)的估计值(3.8%), 造成这种差异的机制尚未得到证实, 可能是不同研究中使用的样本量和生态系统类型的差异引起的.例如Xu等(2015)的研究中包括74个Q10观测值, 本研究中的399个观测值能更全面地量化中国森林生态系统土壤呼吸对温度升高的响应.未来在气候变暖的趋势下, 有必要厘清温度对Q10的直接和间接影响, 以提高碳循环-气候模型的预测能力. ...
Temperature response of soil respiration in a Chinese pine plantation: hysteresis and seasonal vs. diel Q10 2 2013
... 全球气候变暖深刻影响着陆地生态系统的分布、结构与功能(Aronson & McNulty, 2009; Steinbauer et al., 2018), 而土壤呼吸的温度敏感性是决定陆地碳循环与气候变化间反馈关系的关键参数(Lenton & Huntingford, 2003; Bond-Lamberty & Thomson, 2010).众多研究采用Q10值(即温度每升高10 ℃, 土壤呼吸速率增加的倍数)来量化土壤呼吸的温度敏感性, 并剖析了Q10的时空变化规律(Davidson et al., 2006; Zhou et al., 2009; Bond- Lamberty et al., 2018; Yan et al., 2019).尽管对Q10在时间动态(季节、年际)的认识已比较明确(Jia et al., 2013; Wang et al., 2017; Yan et al., 2019), 但其空间变异特征和影响因素依然存在较大不确定性. ...
Scots pine (Pinus sylvestris L.) roots and soil moisture did not affect soil thermal sensitivity 1 2009
... Q10的空间变异主要受气候、土壤和植被因素的影响.许多研究表明Q10随温度和降水量的增加而减小(Peng et al., 2009; Wang et al., 2010; Song et al., 2014; Xu et al., 2015), 然而Chen和Tian (2005)的研究表明Q10在热带和亚热带地区不受温度的影响, Zheng等(2009)的研究则表明Q10与降水量无显著关系, 但随温度的增加而减小.土壤水分对Q10的影响较复杂, Q10随土壤水分的增加而增大、不变或减小(Klimek et al., 2009; Wang et al., 2014; Zhao et al., 2017).其他一些研究表明Q10随土壤有机碳含量(SOC)、土壤总氮含量(TN)、土壤pH的增加而增大, 随可溶性有机碳含量的增加而减小(Zhou et al., 2009; Song et al., 2014; Liu et al.,2017; Zhao et al., 2017).还有研究表明Q10随植被活动(归一化植被指数(NDVI)季节变幅、叶面积指数(LAI)季节变幅)的增强而增大(Curiel Yuste et al., 2004; Wang et al., 2010).因此, 对于Q10空间变异的影响因素仍缺乏一致认识. ...
Characterizing differences in precipitation regimes of extreme wet and dry years: implications for climate change experiments 1 2015
... 中国森林Q10随MAP增加而减小(图4E), 与现有的研究结果(Peng et al., 2009; Xu et al., 2015)类似, 可能是潮湿地区中过高的土壤水分限制了氧气扩散, 使植物根系和好氧微生物的活动受到抑制, 进而降低了Q10.此外, 有研究发现水分与温度的交互作用会影响Q10, 如在一些干旱和地中海气候的生态系统中温度升高时土壤中的水分降低、土壤呼吸底物扩散受限, 进而导致土壤呼吸速率与温度解耦(Reichstein et al., 2002; Wang et al., 2014), 而本研究中MAP和MAT呈正相关关系(图5A), 但二者对Q10无交互作用(ANCOVA, MAT, F1,394 = 79.98, p < 0.01; MAP, F1,394 = 16.28, p < 0.01; MAT × MAP, F1,394 = 0.62, p = 0.43), 这可能表明只有在极端的温度和水分条件下, 二者才对Q10有交互作用.本研究中MAP每增加100 mm, Q10下降1.6% (图4E), 该值低于现有的研究(8%, Peng et al., 2009; 7%, Xu et al., 2015; 7%, Li et al., 2019), 可能与样本量的差异有关, 本研究在较潮湿地区的观测值(大于1 900 mm: 91个)远多于前人研究(11个, Peng et al., 2009; 6个, Xu et al., 2015), Li等(2019)的研究为室内培养实验, 与野外观测条件差异较大.此外, Li等(2020)最近的整合研究表明, 在全球尺度上Q10与MAP无显著关系, 因此MAP与Q10的负相关关系可能很难扩展到较大的尺度.全球气候变暖伴随着降水时空格局的改变(Knapp et al., 2015), 因此需要在进一步的研究中明确水分对Q10空间变异的作用机制, 在碳循环-气候模型中考虑温度和降水的相互作用. ...
Thresholds and interactive effects of soil moisture on the temperature response of soil respiration 1 2011
... 以往关于Q10空间变异影响因素的研究往往忽略了不同影响因素间的交互作用, 各因素对Q10的直接和间接影响, 以及不同类型生态系统Q10对气候和土壤因素的响应差异, 从而可能造成结果的不确定性.众多研究发现温度和水分之间存在交互作用, 即温度对土壤呼吸的影响随水分条件的变化而变化(Lellei-Kovács et al., 2011; Wang et al., 2014; Liu et al., 2016).Liu等(2017)通过整合文献数据, 发现年平均气温(MAT)和年降水量(MAP)不仅可以直接影响Q10, 还可以通过土壤理化性质和微生物群落间接影响Q10.Chen和Tian (2005)发现Q10在三类生物区系间对温度的响应不同, 其对温度变化的敏感性在寒带最高, 其次是温带, 而在热带和亚热带最低.近年来, 在不同生态系统中土壤呼吸观测数据不断积累, 这为通过整合分析检验在区域尺度上Q10的空间变异特征及其影响因素创造了条件. ...
Global terrestrial carbon storage and uncertainties in its temperature sensitivity examined with a simple model 2 2003
... 全球气候变暖深刻影响着陆地生态系统的分布、结构与功能(Aronson & McNulty, 2009; Steinbauer et al., 2018), 而土壤呼吸的温度敏感性是决定陆地碳循环与气候变化间反馈关系的关键参数(Lenton & Huntingford, 2003; Bond-Lamberty & Thomson, 2010).众多研究采用Q10值(即温度每升高10 ℃, 土壤呼吸速率增加的倍数)来量化土壤呼吸的温度敏感性, 并剖析了Q10的时空变化规律(Davidson et al., 2006; Zhou et al., 2009; Bond- Lamberty et al., 2018; Yan et al., 2019).尽管对Q10在时间动态(季节、年际)的认识已比较明确(Jia et al., 2013; Wang et al., 2017; Yan et al., 2019), 但其空间变异特征和影响因素依然存在较大不确定性. ...
... 一些研究认为Q10在不同生态系统间具有趋同性, 不随气候、土壤和生物因素的变化而变化(Bond-Lamberty & Thomson, 2010; Yvon- Durocher et al., 2012; Wang et al., 2018b).如Mahecha等(2010)通过整合全球60个站点的数据, 发现去除季节性混淆因素的影响后, Q10在不同的生物区系之间相似(1.4 ± 0.1).因此, 在许多陆地生态系统碳循环模型中, Q10被假定为一个常数, 如Q10在Community Land Model (CLM)模型中为1.5 (Foereid et al., 2014), 而在Terrestrial Ecosystem Model (TEM)和Carnegie- Ames-Stanford Approach (CASA)模型中为2 (Raich et al., 1991; Potter et al., 1993).而另一些研究发现Q10在不同生态系统间差异显著, 使用固定Q10值估算土壤呼吸会导致较大偏差(Chen & Tian, 2005; Zhou et al., 2009), 近年来, 大量野外观测和数据整合分析也发现在区域尺度上Q10存在较大空间变异(1.09-5.51)(Lenton & Huntingford, 2003; Peng et al., 2009; Xu et al., 2015).因此, Q10的空间变异规律仍需进一步研究. ...
Biogeographic variation in temperature sensitivity of decomposition in forest soils 5 2019
... 中国森林Q10随MAT增加而减小(图4D), 表明较寒冷地区的土壤呼吸对温度升高的敏感性高于较温暖地区, 支持了现有的研究结论(Peng et al., 2009; Xu et al., 2015; Li et al., 2020).研究表明, MAT可以通过直接和间接途径影响Q10.首先, 根呼吸和微生物呼吸均需要酶的参与, 温度升高会导致酶活性的相对增加幅度下降(Peterson et al., 2007; Schipper et al., 2014; Li et al., 2020), 从而降低Q10; 大分子速率理论(MMRT)还表明Q10受酶催化反应热容差(ΔC?p)的强烈影响, ΔC?p随温度升高而降低, 导致Q10随温度升高而降低(Schipper et al., 2014; Li et al., 2020).其次, 尽管温度升高通过促进土壤微生物快速分解活性有机碳导致Q10随SOC增加而增大(Giardina & Ryan, 2000; Rustad et al., 2001), 但温暖地区较高的分解速率降低了SOC, 因此Q10较低(图5A).此外, MAT和MAP相互影响, 共同作用于Q10.本研究中MAT通过对Q10的直接和间接影响最终降低了Q10 (图5B).MAT每增加1 ℃, Q10下降5.7% (图4D), 该值与Peng等(2009)和Li等(2019)的估计值(6%)类似, 高于Xu等(2015)的估计值(3.8%), 造成这种差异的机制尚未得到证实, 可能是不同研究中使用的样本量和生态系统类型的差异引起的.例如Xu等(2015)的研究中包括74个Q10观测值, 本研究中的399个观测值能更全面地量化中国森林生态系统土壤呼吸对温度升高的响应.未来在气候变暖的趋势下, 有必要厘清温度对Q10的直接和间接影响, 以提高碳循环-气候模型的预测能力. ...
... 中国森林Q10随MAP增加而减小(图4E), 与现有的研究结果(Peng et al., 2009; Xu et al., 2015)类似, 可能是潮湿地区中过高的土壤水分限制了氧气扩散, 使植物根系和好氧微生物的活动受到抑制, 进而降低了Q10.此外, 有研究发现水分与温度的交互作用会影响Q10, 如在一些干旱和地中海气候的生态系统中温度升高时土壤中的水分降低、土壤呼吸底物扩散受限, 进而导致土壤呼吸速率与温度解耦(Reichstein et al., 2002; Wang et al., 2014), 而本研究中MAP和MAT呈正相关关系(图5A), 但二者对Q10无交互作用(ANCOVA, MAT, F1,394 = 79.98, p < 0.01; MAP, F1,394 = 16.28, p < 0.01; MAT × MAP, F1,394 = 0.62, p = 0.43), 这可能表明只有在极端的温度和水分条件下, 二者才对Q10有交互作用.本研究中MAP每增加100 mm, Q10下降1.6% (图4E), 该值低于现有的研究(8%, Peng et al., 2009; 7%, Xu et al., 2015; 7%, Li et al., 2019), 可能与样本量的差异有关, 本研究在较潮湿地区的观测值(大于1 900 mm: 91个)远多于前人研究(11个, Peng et al., 2009; 6个, Xu et al., 2015), Li等(2019)的研究为室内培养实验, 与野外观测条件差异较大.此外, Li等(2020)最近的整合研究表明, 在全球尺度上Q10与MAP无显著关系, 因此MAP与Q10的负相关关系可能很难扩展到较大的尺度.全球气候变暖伴随着降水时空格局的改变(Knapp et al., 2015), 因此需要在进一步的研究中明确水分对Q10空间变异的作用机制, 在碳循环-气候模型中考虑温度和降水的相互作用. ...
... Q10随SOC和TN的增加而增大, 与现有的研究结果一致(Zheng et al., 2009; Song et al., 2014).土壤有机碳是土壤微生物呼吸的重要底物(Bond-Lamberty et al., 2018), 在其他环境因素不变的条件下, SOC较高的生态系统其土壤微生物呼吸速率随温度升高的幅度也较大, 因此Q10更高.由于土壤中碳氮存在紧密的耦合关系, 二者是协同积累的(G?rden?s et al., 2011), 因此SOC和TN呈正相关关系(图5A).此外, 尽管有研究发现Q10与底物质量(C:N)呈负相关关系(Fierer et al., 2006; Liu et al., 2017; Wang et al., 2018a), 但本研究中Q10与C:N无显著关系(图4I), 这表明Q10的空间变异可能不受底物质量的影响.一些室内培养实验也表明有机质分解对温度的响应与底物质量无关(Fang et al., 2005; Li et al., 2019), 还有研究发现土壤基质对有机质的保护作用对Q10的影响远超过底物质量(Moinet et al., 2018), Li等(2019)的研究进一步强调了土壤保护性因子(如黏粒含量)对Q10空间变异的重要性. ...
Spatial heterogeneity of temperature sensitivity of soil respiration: a global analysis of field observations 4 2020
... 中国森林Q10随MAT增加而减小(图4D), 表明较寒冷地区的土壤呼吸对温度升高的敏感性高于较温暖地区, 支持了现有的研究结论(Peng et al., 2009; Xu et al., 2015; Li et al., 2020).研究表明, MAT可以通过直接和间接途径影响Q10.首先, 根呼吸和微生物呼吸均需要酶的参与, 温度升高会导致酶活性的相对增加幅度下降(Peterson et al., 2007; Schipper et al., 2014; Li et al., 2020), 从而降低Q10; 大分子速率理论(MMRT)还表明Q10受酶催化反应热容差(ΔC?p)的强烈影响, ΔC?p随温度升高而降低, 导致Q10随温度升高而降低(Schipper et al., 2014; Li et al., 2020).其次, 尽管温度升高通过促进土壤微生物快速分解活性有机碳导致Q10随SOC增加而增大(Giardina & Ryan, 2000; Rustad et al., 2001), 但温暖地区较高的分解速率降低了SOC, 因此Q10较低(图5A).此外, MAT和MAP相互影响, 共同作用于Q10.本研究中MAT通过对Q10的直接和间接影响最终降低了Q10 (图5B).MAT每增加1 ℃, Q10下降5.7% (图4D), 该值与Peng等(2009)和Li等(2019)的估计值(6%)类似, 高于Xu等(2015)的估计值(3.8%), 造成这种差异的机制尚未得到证实, 可能是不同研究中使用的样本量和生态系统类型的差异引起的.例如Xu等(2015)的研究中包括74个Q10观测值, 本研究中的399个观测值能更全面地量化中国森林生态系统土壤呼吸对温度升高的响应.未来在气候变暖的趋势下, 有必要厘清温度对Q10的直接和间接影响, 以提高碳循环-气候模型的预测能力. ...
... ; Li et al., 2020), 从而降低Q10; 大分子速率理论(MMRT)还表明Q10受酶催化反应热容差(ΔC?p)的强烈影响, ΔC?p随温度升高而降低, 导致Q10随温度升高而降低(Schipper et al., 2014; Li et al., 2020).其次, 尽管温度升高通过促进土壤微生物快速分解活性有机碳导致Q10随SOC增加而增大(Giardina & Ryan, 2000; Rustad et al., 2001), 但温暖地区较高的分解速率降低了SOC, 因此Q10较低(图5A).此外, MAT和MAP相互影响, 共同作用于Q10.本研究中MAT通过对Q10的直接和间接影响最终降低了Q10 (图5B).MAT每增加1 ℃, Q10下降5.7% (图4D), 该值与Peng等(2009)和Li等(2019)的估计值(6%)类似, 高于Xu等(2015)的估计值(3.8%), 造成这种差异的机制尚未得到证实, 可能是不同研究中使用的样本量和生态系统类型的差异引起的.例如Xu等(2015)的研究中包括74个Q10观测值, 本研究中的399个观测值能更全面地量化中国森林生态系统土壤呼吸对温度升高的响应.未来在气候变暖的趋势下, 有必要厘清温度对Q10的直接和间接影响, 以提高碳循环-气候模型的预测能力. ...
... ; Li et al., 2020).其次, 尽管温度升高通过促进土壤微生物快速分解活性有机碳导致Q10随SOC增加而增大(Giardina & Ryan, 2000; Rustad et al., 2001), 但温暖地区较高的分解速率降低了SOC, 因此Q10较低(图5A).此外, MAT和MAP相互影响, 共同作用于Q10.本研究中MAT通过对Q10的直接和间接影响最终降低了Q10 (图5B).MAT每增加1 ℃, Q10下降5.7% (图4D), 该值与Peng等(2009)和Li等(2019)的估计值(6%)类似, 高于Xu等(2015)的估计值(3.8%), 造成这种差异的机制尚未得到证实, 可能是不同研究中使用的样本量和生态系统类型的差异引起的.例如Xu等(2015)的研究中包括74个Q10观测值, 本研究中的399个观测值能更全面地量化中国森林生态系统土壤呼吸对温度升高的响应.未来在气候变暖的趋势下, 有必要厘清温度对Q10的直接和间接影响, 以提高碳循环-气候模型的预测能力. ...
... 中国森林Q10随MAP增加而减小(图4E), 与现有的研究结果(Peng et al., 2009; Xu et al., 2015)类似, 可能是潮湿地区中过高的土壤水分限制了氧气扩散, 使植物根系和好氧微生物的活动受到抑制, 进而降低了Q10.此外, 有研究发现水分与温度的交互作用会影响Q10, 如在一些干旱和地中海气候的生态系统中温度升高时土壤中的水分降低、土壤呼吸底物扩散受限, 进而导致土壤呼吸速率与温度解耦(Reichstein et al., 2002; Wang et al., 2014), 而本研究中MAP和MAT呈正相关关系(图5A), 但二者对Q10无交互作用(ANCOVA, MAT, F1,394 = 79.98, p < 0.01; MAP, F1,394 = 16.28, p < 0.01; MAT × MAP, F1,394 = 0.62, p = 0.43), 这可能表明只有在极端的温度和水分条件下, 二者才对Q10有交互作用.本研究中MAP每增加100 mm, Q10下降1.6% (图4E), 该值低于现有的研究(8%, Peng et al., 2009; 7%, Xu et al., 2015; 7%, Li et al., 2019), 可能与样本量的差异有关, 本研究在较潮湿地区的观测值(大于1 900 mm: 91个)远多于前人研究(11个, Peng et al., 2009; 6个, Xu et al., 2015), Li等(2019)的研究为室内培养实验, 与野外观测条件差异较大.此外, Li等(2020)最近的整合研究表明, 在全球尺度上Q10与MAP无显著关系, 因此MAP与Q10的负相关关系可能很难扩展到较大的尺度.全球气候变暖伴随着降水时空格局的改变(Knapp et al., 2015), 因此需要在进一步的研究中明确水分对Q10空间变异的作用机制, 在碳循环-气候模型中考虑温度和降水的相互作用. ...
Regional variation in the temperature sensitivity of soil organic matter decomposition in China’s forests and grasslands 3 2017
... Q10的空间变异主要受气候、土壤和植被因素的影响.许多研究表明Q10随温度和降水量的增加而减小(Peng et al., 2009; Wang et al., 2010; Song et al., 2014; Xu et al., 2015), 然而Chen和Tian (2005)的研究表明Q10在热带和亚热带地区不受温度的影响, Zheng等(2009)的研究则表明Q10与降水量无显著关系, 但随温度的增加而减小.土壤水分对Q10的影响较复杂, Q10随土壤水分的增加而增大、不变或减小(Klimek et al., 2009; Wang et al., 2014; Zhao et al., 2017).其他一些研究表明Q10随土壤有机碳含量(SOC)、土壤总氮含量(TN)、土壤pH的增加而增大, 随可溶性有机碳含量的增加而减小(Zhou et al., 2009; Song et al., 2014; Liu et al.,2017; Zhao et al., 2017).还有研究表明Q10随植被活动(归一化植被指数(NDVI)季节变幅、叶面积指数(LAI)季节变幅)的增强而增大(Curiel Yuste et al., 2004; Wang et al., 2010).因此, 对于Q10空间变异的影响因素仍缺乏一致认识. ...
... 以往关于Q10空间变异影响因素的研究往往忽略了不同影响因素间的交互作用, 各因素对Q10的直接和间接影响, 以及不同类型生态系统Q10对气候和土壤因素的响应差异, 从而可能造成结果的不确定性.众多研究发现温度和水分之间存在交互作用, 即温度对土壤呼吸的影响随水分条件的变化而变化(Lellei-Kovács et al., 2011; Wang et al., 2014; Liu et al., 2016).Liu等(2017)通过整合文献数据, 发现年平均气温(MAT)和年降水量(MAP)不仅可以直接影响Q10, 还可以通过土壤理化性质和微生物群落间接影响Q10.Chen和Tian (2005)发现Q10在三类生物区系间对温度的响应不同, 其对温度变化的敏感性在寒带最高, 其次是温带, 而在热带和亚热带最低.近年来, 在不同生态系统中土壤呼吸观测数据不断积累, 这为通过整合分析检验在区域尺度上Q10的空间变异特征及其影响因素创造了条件. ...
... Q10随SOC和TN的增加而增大, 与现有的研究结果一致(Zheng et al., 2009; Song et al., 2014).土壤有机碳是土壤微生物呼吸的重要底物(Bond-Lamberty et al., 2018), 在其他环境因素不变的条件下, SOC较高的生态系统其土壤微生物呼吸速率随温度升高的幅度也较大, 因此Q10更高.由于土壤中碳氮存在紧密的耦合关系, 二者是协同积累的(G?rden?s et al., 2011), 因此SOC和TN呈正相关关系(图5A).此外, 尽管有研究发现Q10与底物质量(C:N)呈负相关关系(Fierer et al., 2006; Liu et al., 2017; Wang et al., 2018a), 但本研究中Q10与C:N无显著关系(图4I), 这表明Q10的空间变异可能不受底物质量的影响.一些室内培养实验也表明有机质分解对温度的响应与底物质量无关(Fang et al., 2005; Li et al., 2019), 还有研究发现土壤基质对有机质的保护作用对Q10的影响远超过底物质量(Moinet et al., 2018), Li等(2019)的研究进一步强调了土壤保护性因子(如黏粒含量)对Q10空间变异的重要性. ...
Differential responses of soil respiration to soil warming and experimental throughfall reduction in a transitional oak forest in central China 1 2016
... 以往关于Q10空间变异影响因素的研究往往忽略了不同影响因素间的交互作用, 各因素对Q10的直接和间接影响, 以及不同类型生态系统Q10对气候和土壤因素的响应差异, 从而可能造成结果的不确定性.众多研究发现温度和水分之间存在交互作用, 即温度对土壤呼吸的影响随水分条件的变化而变化(Lellei-Kovács et al., 2011; Wang et al., 2014; Liu et al., 2016).Liu等(2017)通过整合文献数据, 发现年平均气温(MAT)和年降水量(MAP)不仅可以直接影响Q10, 还可以通过土壤理化性质和微生物群落间接影响Q10.Chen和Tian (2005)发现Q10在三类生物区系间对温度的响应不同, 其对温度变化的敏感性在寒带最高, 其次是温带, 而在热带和亚热带最低.近年来, 在不同生态系统中土壤呼吸观测数据不断积累, 这为通过整合分析检验在区域尺度上Q10的空间变异特征及其影响因素创造了条件. ...
Effects of national ecological restoration projects on carbon sequestration in China from 2001 to 2010 1 2018
Global convergence in the temperature sensitivity of respiration at ecosystem level 1 2010
... 一些研究认为Q10在不同生态系统间具有趋同性, 不随气候、土壤和生物因素的变化而变化(Bond-Lamberty & Thomson, 2010; Yvon- Durocher et al., 2012; Wang et al., 2018b).如Mahecha等(2010)通过整合全球60个站点的数据, 发现去除季节性混淆因素的影响后, Q10在不同的生物区系之间相似(1.4 ± 0.1).因此, 在许多陆地生态系统碳循环模型中, Q10被假定为一个常数, 如Q10在Community Land Model (CLM)模型中为1.5 (Foereid et al., 2014), 而在Terrestrial Ecosystem Model (TEM)和Carnegie- Ames-Stanford Approach (CASA)模型中为2 (Raich et al., 1991; Potter et al., 1993).而另一些研究发现Q10在不同生态系统间差异显著, 使用固定Q10值估算土壤呼吸会导致较大偏差(Chen & Tian, 2005; Zhou et al., 2009), 近年来, 大量野外观测和数据整合分析也发现在区域尺度上Q10存在较大空间变异(1.09-5.51)(Lenton & Huntingford, 2003; Peng et al., 2009; Xu et al., 2015).因此, Q10的空间变异规律仍需进一步研究. ...
The temperature sensitivity of soil organic matter decomposition is constrained by microbial access to substrates 1 2018
... Q10随SOC和TN的增加而增大, 与现有的研究结果一致(Zheng et al., 2009; Song et al., 2014).土壤有机碳是土壤微生物呼吸的重要底物(Bond-Lamberty et al., 2018), 在其他环境因素不变的条件下, SOC较高的生态系统其土壤微生物呼吸速率随温度升高的幅度也较大, 因此Q10更高.由于土壤中碳氮存在紧密的耦合关系, 二者是协同积累的(G?rden?s et al., 2011), 因此SOC和TN呈正相关关系(图5A).此外, 尽管有研究发现Q10与底物质量(C:N)呈负相关关系(Fierer et al., 2006; Liu et al., 2017; Wang et al., 2018a), 但本研究中Q10与C:N无显著关系(图4I), 这表明Q10的空间变异可能不受底物质量的影响.一些室内培养实验也表明有机质分解对温度的响应与底物质量无关(Fang et al., 2005; Li et al., 2019), 还有研究发现土壤基质对有机质的保护作用对Q10的影响远超过底物质量(Moinet et al., 2018), Li等(2019)的研究进一步强调了土壤保护性因子(如黏粒含量)对Q10空间变异的重要性. ...
Heterotrophic respiration and nitrogen mineralisation in soils of Norway spruce, scots pine and silver birch stands in contrasting climates 1 2012
... DNF的Q10在所有森林类型中最高(图3), 这与现有的研究结果一致(Peng et al., 2009; Song et al., 2014).本研究的DNF主要为东北地区的落叶松(Larix gmelinii)林和华北地区的华北落叶松(Larix principis-rupprechtii)林, 少数为华东地区的水杉(Metasequoia glyptostroboides)林.低温是东北和华北地区DNF中根系和微生物酶活性的主要限制因素, 因此DNF中土壤呼吸对温度的变化最敏感, 这也可以由Q10与MAT的负相关关系来检验(图4D).Q10对环境因素的响应随森林类型变化(附录II).DNF中Q10与MAT和SOC无显著关系, 但随MAP增加而减小; 其余森林类型中Q10均随MAT增加而减小, 随SOC增加而增大, 但与MAP无显著关系, 这些结果可能表明DNF的根系和微生物群落对MAT、MAP和SOC的敏感性与其他森林类型显著不同, 也可能是DNF的观测数据(6个)较少, 不足以准确体现Q10对环境因素的响应, 未来仍需要开展更多的野外观测以明确DNF中Q10对环境因素的响应机制.此外, 森林类型与TN存在交互作用.尽管在DNF和MF中Q10与TN无显著关系, 但在DBF、EBF、ENF中Q10均随TN增加而增大, 且阔叶林(EBF、DBF)中Q10对TN的敏感性强于针叶林(ENF), 这可能是阔叶林与针叶林的根系或微生物群落在利用TN时采取了不同的策略.本研究中阔叶林的TN (2.87 g·kg-1)高于针叶林(1.84 g·kg-1), 以往的研究也发现, 相比于针叶林, 阔叶林的凋落物和枯死根系的归还量高且更易于分解, 因此其养分循环和分解速度更快(Reich et al., 2005; Olsson et al., 2012), 这种差异可能导致阔叶林的土壤微生物群落在利用TN时采用资源获取型策略, 而针叶林则为保守型策略, 但具体机制仍需要大量实验验证.不同森林类型对环境因素的差异性响应预示着未来在气候变化加剧的背景下, 不同森林类型间Q10的差异可能会增大, 这将影响碳循环-气候模型的预测精度, 因此需要予以考虑. ...
Temperature sensitivity of soil respiration in different ecosystems in China 9 2009
... 一些研究认为Q10在不同生态系统间具有趋同性, 不随气候、土壤和生物因素的变化而变化(Bond-Lamberty & Thomson, 2010; Yvon- Durocher et al., 2012; Wang et al., 2018b).如Mahecha等(2010)通过整合全球60个站点的数据, 发现去除季节性混淆因素的影响后, Q10在不同的生物区系之间相似(1.4 ± 0.1).因此, 在许多陆地生态系统碳循环模型中, Q10被假定为一个常数, 如Q10在Community Land Model (CLM)模型中为1.5 (Foereid et al., 2014), 而在Terrestrial Ecosystem Model (TEM)和Carnegie- Ames-Stanford Approach (CASA)模型中为2 (Raich et al., 1991; Potter et al., 1993).而另一些研究发现Q10在不同生态系统间差异显著, 使用固定Q10值估算土壤呼吸会导致较大偏差(Chen & Tian, 2005; Zhou et al., 2009), 近年来, 大量野外观测和数据整合分析也发现在区域尺度上Q10存在较大空间变异(1.09-5.51)(Lenton & Huntingford, 2003; Peng et al., 2009; Xu et al., 2015).因此, Q10的空间变异规律仍需进一步研究. ...
... Q10的空间变异主要受气候、土壤和植被因素的影响.许多研究表明Q10随温度和降水量的增加而减小(Peng et al., 2009; Wang et al., 2010; Song et al., 2014; Xu et al., 2015), 然而Chen和Tian (2005)的研究表明Q10在热带和亚热带地区不受温度的影响, Zheng等(2009)的研究则表明Q10与降水量无显著关系, 但随温度的增加而减小.土壤水分对Q10的影响较复杂, Q10随土壤水分的增加而增大、不变或减小(Klimek et al., 2009; Wang et al., 2014; Zhao et al., 2017).其他一些研究表明Q10随土壤有机碳含量(SOC)、土壤总氮含量(TN)、土壤pH的增加而增大, 随可溶性有机碳含量的增加而减小(Zhou et al., 2009; Song et al., 2014; Liu et al.,2017; Zhao et al., 2017).还有研究表明Q10随植被活动(归一化植被指数(NDVI)季节变幅、叶面积指数(LAI)季节变幅)的增强而增大(Curiel Yuste et al., 2004; Wang et al., 2010).因此, 对于Q10空间变异的影响因素仍缺乏一致认识. ...
... Q10对温度测定深度十分敏感(在同一地点, Q10通常随温度测定深度的增加而增大) (Peng et al., 2009; Feng et al., 2018), 由于使用土壤5 cm深处土壤温度计算Q10的文献数量最多, 本研究仅选用由 (5 ± 1) cm深处土壤温度计算的Q10. ...
... 中国森林Q10随MAT增加而减小(图4D), 表明较寒冷地区的土壤呼吸对温度升高的敏感性高于较温暖地区, 支持了现有的研究结论(Peng et al., 2009; Xu et al., 2015; Li et al., 2020).研究表明, MAT可以通过直接和间接途径影响Q10.首先, 根呼吸和微生物呼吸均需要酶的参与, 温度升高会导致酶活性的相对增加幅度下降(Peterson et al., 2007; Schipper et al., 2014; Li et al., 2020), 从而降低Q10; 大分子速率理论(MMRT)还表明Q10受酶催化反应热容差(ΔC?p)的强烈影响, ΔC?p随温度升高而降低, 导致Q10随温度升高而降低(Schipper et al., 2014; Li et al., 2020).其次, 尽管温度升高通过促进土壤微生物快速分解活性有机碳导致Q10随SOC增加而增大(Giardina & Ryan, 2000; Rustad et al., 2001), 但温暖地区较高的分解速率降低了SOC, 因此Q10较低(图5A).此外, MAT和MAP相互影响, 共同作用于Q10.本研究中MAT通过对Q10的直接和间接影响最终降低了Q10 (图5B).MAT每增加1 ℃, Q10下降5.7% (图4D), 该值与Peng等(2009)和Li等(2019)的估计值(6%)类似, 高于Xu等(2015)的估计值(3.8%), 造成这种差异的机制尚未得到证实, 可能是不同研究中使用的样本量和生态系统类型的差异引起的.例如Xu等(2015)的研究中包括74个Q10观测值, 本研究中的399个观测值能更全面地量化中国森林生态系统土壤呼吸对温度升高的响应.未来在气候变暖的趋势下, 有必要厘清温度对Q10的直接和间接影响, 以提高碳循环-气候模型的预测能力. ...
... 中国森林Q10随MAP增加而减小(图4E), 与现有的研究结果(Peng et al., 2009; Xu et al., 2015)类似, 可能是潮湿地区中过高的土壤水分限制了氧气扩散, 使植物根系和好氧微生物的活动受到抑制, 进而降低了Q10.此外, 有研究发现水分与温度的交互作用会影响Q10, 如在一些干旱和地中海气候的生态系统中温度升高时土壤中的水分降低、土壤呼吸底物扩散受限, 进而导致土壤呼吸速率与温度解耦(Reichstein et al., 2002; Wang et al., 2014), 而本研究中MAP和MAT呈正相关关系(图5A), 但二者对Q10无交互作用(ANCOVA, MAT, F1,394 = 79.98, p < 0.01; MAP, F1,394 = 16.28, p < 0.01; MAT × MAP, F1,394 = 0.62, p = 0.43), 这可能表明只有在极端的温度和水分条件下, 二者才对Q10有交互作用.本研究中MAP每增加100 mm, Q10下降1.6% (图4E), 该值低于现有的研究(8%, Peng et al., 2009; 7%, Xu et al., 2015; 7%, Li et al., 2019), 可能与样本量的差异有关, 本研究在较潮湿地区的观测值(大于1 900 mm: 91个)远多于前人研究(11个, Peng et al., 2009; 6个, Xu et al., 2015), Li等(2019)的研究为室内培养实验, 与野外观测条件差异较大.此外, Li等(2020)最近的整合研究表明, 在全球尺度上Q10与MAP无显著关系, 因此MAP与Q10的负相关关系可能很难扩展到较大的尺度.全球气候变暖伴随着降水时空格局的改变(Knapp et al., 2015), 因此需要在进一步的研究中明确水分对Q10空间变异的作用机制, 在碳循环-气候模型中考虑温度和降水的相互作用. ...
... ), 该值低于现有的研究(8%, Peng et al., 2009; 7%, Xu et al., 2015; 7%, Li et al., 2019), 可能与样本量的差异有关, 本研究在较潮湿地区的观测值(大于1 900 mm: 91个)远多于前人研究(11个, Peng et al., 2009; 6个, Xu et al., 2015), Li等(2019)的研究为室内培养实验, 与野外观测条件差异较大.此外, Li等(2020)最近的整合研究表明, 在全球尺度上Q10与MAP无显著关系, 因此MAP与Q10的负相关关系可能很难扩展到较大的尺度.全球气候变暖伴随着降水时空格局的改变(Knapp et al., 2015), 因此需要在进一步的研究中明确水分对Q10空间变异的作用机制, 在碳循环-气候模型中考虑温度和降水的相互作用. ...
... ), 可能与样本量的差异有关, 本研究在较潮湿地区的观测值(大于1 900 mm: 91个)远多于前人研究(11个, Peng et al., 2009; 6个, Xu et al., 2015), Li等(2019)的研究为室内培养实验, 与野外观测条件差异较大.此外, Li等(2020)最近的整合研究表明, 在全球尺度上Q10与MAP无显著关系, 因此MAP与Q10的负相关关系可能很难扩展到较大的尺度.全球气候变暖伴随着降水时空格局的改变(Knapp et al., 2015), 因此需要在进一步的研究中明确水分对Q10空间变异的作用机制, 在碳循环-气候模型中考虑温度和降水的相互作用. ...
... DNF的Q10在所有森林类型中最高(图3), 这与现有的研究结果一致(Peng et al., 2009; Song et al., 2014).本研究的DNF主要为东北地区的落叶松(Larix gmelinii)林和华北地区的华北落叶松(Larix principis-rupprechtii)林, 少数为华东地区的水杉(Metasequoia glyptostroboides)林.低温是东北和华北地区DNF中根系和微生物酶活性的主要限制因素, 因此DNF中土壤呼吸对温度的变化最敏感, 这也可以由Q10与MAT的负相关关系来检验(图4D).Q10对环境因素的响应随森林类型变化(附录II).DNF中Q10与MAT和SOC无显著关系, 但随MAP增加而减小; 其余森林类型中Q10均随MAT增加而减小, 随SOC增加而增大, 但与MAP无显著关系, 这些结果可能表明DNF的根系和微生物群落对MAT、MAP和SOC的敏感性与其他森林类型显著不同, 也可能是DNF的观测数据(6个)较少, 不足以准确体现Q10对环境因素的响应, 未来仍需要开展更多的野外观测以明确DNF中Q10对环境因素的响应机制.此外, 森林类型与TN存在交互作用.尽管在DNF和MF中Q10与TN无显著关系, 但在DBF、EBF、ENF中Q10均随TN增加而增大, 且阔叶林(EBF、DBF)中Q10对TN的敏感性强于针叶林(ENF), 这可能是阔叶林与针叶林的根系或微生物群落在利用TN时采取了不同的策略.本研究中阔叶林的TN (2.87 g·kg-1)高于针叶林(1.84 g·kg-1), 以往的研究也发现, 相比于针叶林, 阔叶林的凋落物和枯死根系的归还量高且更易于分解, 因此其养分循环和分解速度更快(Reich et al., 2005; Olsson et al., 2012), 这种差异可能导致阔叶林的土壤微生物群落在利用TN时采用资源获取型策略, 而针叶林则为保守型策略, 但具体机制仍需要大量实验验证.不同森林类型对环境因素的差异性响应预示着未来在气候变化加剧的背景下, 不同森林类型间Q10的差异可能会增大, 这将影响碳循环-气候模型的预测精度, 因此需要予以考虑. ...
The dependence of enzyme activity on temperature: determination and validation of parameters 1 2007
... 中国森林Q10随MAT增加而减小(图4D), 表明较寒冷地区的土壤呼吸对温度升高的敏感性高于较温暖地区, 支持了现有的研究结论(Peng et al., 2009; Xu et al., 2015; Li et al., 2020).研究表明, MAT可以通过直接和间接途径影响Q10.首先, 根呼吸和微生物呼吸均需要酶的参与, 温度升高会导致酶活性的相对增加幅度下降(Peterson et al., 2007; Schipper et al., 2014; Li et al., 2020), 从而降低Q10; 大分子速率理论(MMRT)还表明Q10受酶催化反应热容差(ΔC?p)的强烈影响, ΔC?p随温度升高而降低, 导致Q10随温度升高而降低(Schipper et al., 2014; Li et al., 2020).其次, 尽管温度升高通过促进土壤微生物快速分解活性有机碳导致Q10随SOC增加而增大(Giardina & Ryan, 2000; Rustad et al., 2001), 但温暖地区较高的分解速率降低了SOC, 因此Q10较低(图5A).此外, MAT和MAP相互影响, 共同作用于Q10.本研究中MAT通过对Q10的直接和间接影响最终降低了Q10 (图5B).MAT每增加1 ℃, Q10下降5.7% (图4D), 该值与Peng等(2009)和Li等(2019)的估计值(6%)类似, 高于Xu等(2015)的估计值(3.8%), 造成这种差异的机制尚未得到证实, 可能是不同研究中使用的样本量和生态系统类型的差异引起的.例如Xu等(2015)的研究中包括74个Q10观测值, 本研究中的399个观测值能更全面地量化中国森林生态系统土壤呼吸对温度升高的响应.未来在气候变暖的趋势下, 有必要厘清温度对Q10的直接和间接影响, 以提高碳循环-气候模型的预测能力. ...
Terrestrial ecosystem production: a process model based on global satellite and surface data 1 1993
... 一些研究认为Q10在不同生态系统间具有趋同性, 不随气候、土壤和生物因素的变化而变化(Bond-Lamberty & Thomson, 2010; Yvon- Durocher et al., 2012; Wang et al., 2018b).如Mahecha等(2010)通过整合全球60个站点的数据, 发现去除季节性混淆因素的影响后, Q10在不同的生物区系之间相似(1.4 ± 0.1).因此, 在许多陆地生态系统碳循环模型中, Q10被假定为一个常数, 如Q10在Community Land Model (CLM)模型中为1.5 (Foereid et al., 2014), 而在Terrestrial Ecosystem Model (TEM)和Carnegie- Ames-Stanford Approach (CASA)模型中为2 (Raich et al., 1991; Potter et al., 1993).而另一些研究发现Q10在不同生态系统间差异显著, 使用固定Q10值估算土壤呼吸会导致较大偏差(Chen & Tian, 2005; Zhou et al., 2009), 近年来, 大量野外观测和数据整合分析也发现在区域尺度上Q10存在较大空间变异(1.09-5.51)(Lenton & Huntingford, 2003; Peng et al., 2009; Xu et al., 2015).因此, Q10的空间变异规律仍需进一步研究. ...
Potential net primary productivity in south America: application of a global modle 1 1991
... 一些研究认为Q10在不同生态系统间具有趋同性, 不随气候、土壤和生物因素的变化而变化(Bond-Lamberty & Thomson, 2010; Yvon- Durocher et al., 2012; Wang et al., 2018b).如Mahecha等(2010)通过整合全球60个站点的数据, 发现去除季节性混淆因素的影响后, Q10在不同的生物区系之间相似(1.4 ± 0.1).因此, 在许多陆地生态系统碳循环模型中, Q10被假定为一个常数, 如Q10在Community Land Model (CLM)模型中为1.5 (Foereid et al., 2014), 而在Terrestrial Ecosystem Model (TEM)和Carnegie- Ames-Stanford Approach (CASA)模型中为2 (Raich et al., 1991; Potter et al., 1993).而另一些研究发现Q10在不同生态系统间差异显著, 使用固定Q10值估算土壤呼吸会导致较大偏差(Chen & Tian, 2005; Zhou et al., 2009), 近年来, 大量野外观测和数据整合分析也发现在区域尺度上Q10存在较大空间变异(1.09-5.51)(Lenton & Huntingford, 2003; Peng et al., 2009; Xu et al., 2015).因此, Q10的空间变异规律仍需进一步研究. ...
Linking litter calcium, earthworms and soil properties: a common garden test with 14 tree species 1 2005
... DNF的Q10在所有森林类型中最高(图3), 这与现有的研究结果一致(Peng et al., 2009; Song et al., 2014).本研究的DNF主要为东北地区的落叶松(Larix gmelinii)林和华北地区的华北落叶松(Larix principis-rupprechtii)林, 少数为华东地区的水杉(Metasequoia glyptostroboides)林.低温是东北和华北地区DNF中根系和微生物酶活性的主要限制因素, 因此DNF中土壤呼吸对温度的变化最敏感, 这也可以由Q10与MAT的负相关关系来检验(图4D).Q10对环境因素的响应随森林类型变化(附录II).DNF中Q10与MAT和SOC无显著关系, 但随MAP增加而减小; 其余森林类型中Q10均随MAT增加而减小, 随SOC增加而增大, 但与MAP无显著关系, 这些结果可能表明DNF的根系和微生物群落对MAT、MAP和SOC的敏感性与其他森林类型显著不同, 也可能是DNF的观测数据(6个)较少, 不足以准确体现Q10对环境因素的响应, 未来仍需要开展更多的野外观测以明确DNF中Q10对环境因素的响应机制.此外, 森林类型与TN存在交互作用.尽管在DNF和MF中Q10与TN无显著关系, 但在DBF、EBF、ENF中Q10均随TN增加而增大, 且阔叶林(EBF、DBF)中Q10对TN的敏感性强于针叶林(ENF), 这可能是阔叶林与针叶林的根系或微生物群落在利用TN时采取了不同的策略.本研究中阔叶林的TN (2.87 g·kg-1)高于针叶林(1.84 g·kg-1), 以往的研究也发现, 相比于针叶林, 阔叶林的凋落物和枯死根系的归还量高且更易于分解, 因此其养分循环和分解速度更快(Reich et al., 2005; Olsson et al., 2012), 这种差异可能导致阔叶林的土壤微生物群落在利用TN时采用资源获取型策略, 而针叶林则为保守型策略, 但具体机制仍需要大量实验验证.不同森林类型对环境因素的差异性响应预示着未来在气候变化加剧的背景下, 不同森林类型间Q10的差异可能会增大, 这将影响碳循环-气候模型的预测精度, 因此需要予以考虑. ...
Severe drought effects on ecosystem CO2 and H2O fluxes at three Mediterranean evergreen sites: revision of current hypotheses? 1 2002
... 中国森林Q10随MAP增加而减小(图4E), 与现有的研究结果(Peng et al., 2009; Xu et al., 2015)类似, 可能是潮湿地区中过高的土壤水分限制了氧气扩散, 使植物根系和好氧微生物的活动受到抑制, 进而降低了Q10.此外, 有研究发现水分与温度的交互作用会影响Q10, 如在一些干旱和地中海气候的生态系统中温度升高时土壤中的水分降低、土壤呼吸底物扩散受限, 进而导致土壤呼吸速率与温度解耦(Reichstein et al., 2002; Wang et al., 2014), 而本研究中MAP和MAT呈正相关关系(图5A), 但二者对Q10无交互作用(ANCOVA, MAT, F1,394 = 79.98, p < 0.01; MAP, F1,394 = 16.28, p < 0.01; MAT × MAP, F1,394 = 0.62, p = 0.43), 这可能表明只有在极端的温度和水分条件下, 二者才对Q10有交互作用.本研究中MAP每增加100 mm, Q10下降1.6% (图4E), 该值低于现有的研究(8%, Peng et al., 2009; 7%, Xu et al., 2015; 7%, Li et al., 2019), 可能与样本量的差异有关, 本研究在较潮湿地区的观测值(大于1 900 mm: 91个)远多于前人研究(11个, Peng et al., 2009; 6个, Xu et al., 2015), Li等(2019)的研究为室内培养实验, 与野外观测条件差异较大.此外, Li等(2020)最近的整合研究表明, 在全球尺度上Q10与MAP无显著关系, 因此MAP与Q10的负相关关系可能很难扩展到较大的尺度.全球气候变暖伴随着降水时空格局的改变(Knapp et al., 2015), 因此需要在进一步的研究中明确水分对Q10空间变异的作用机制, 在碳循环-气候模型中考虑温度和降水的相互作用. ...
A meta-analysis of the response of soil respiration, net nitrogen mineralization, and aboveground plant growth to experimental ecosystem warming 1 2001
... 中国森林Q10随MAT增加而减小(图4D), 表明较寒冷地区的土壤呼吸对温度升高的敏感性高于较温暖地区, 支持了现有的研究结论(Peng et al., 2009; Xu et al., 2015; Li et al., 2020).研究表明, MAT可以通过直接和间接途径影响Q10.首先, 根呼吸和微生物呼吸均需要酶的参与, 温度升高会导致酶活性的相对增加幅度下降(Peterson et al., 2007; Schipper et al., 2014; Li et al., 2020), 从而降低Q10; 大分子速率理论(MMRT)还表明Q10受酶催化反应热容差(ΔC?p)的强烈影响, ΔC?p随温度升高而降低, 导致Q10随温度升高而降低(Schipper et al., 2014; Li et al., 2020).其次, 尽管温度升高通过促进土壤微生物快速分解活性有机碳导致Q10随SOC增加而增大(Giardina & Ryan, 2000; Rustad et al., 2001), 但温暖地区较高的分解速率降低了SOC, 因此Q10较低(图5A).此外, MAT和MAP相互影响, 共同作用于Q10.本研究中MAT通过对Q10的直接和间接影响最终降低了Q10 (图5B).MAT每增加1 ℃, Q10下降5.7% (图4D), 该值与Peng等(2009)和Li等(2019)的估计值(6%)类似, 高于Xu等(2015)的估计值(3.8%), 造成这种差异的机制尚未得到证实, 可能是不同研究中使用的样本量和生态系统类型的差异引起的.例如Xu等(2015)的研究中包括74个Q10观测值, 本研究中的399个观测值能更全面地量化中国森林生态系统土壤呼吸对温度升高的响应.未来在气候变暖的趋势下, 有必要厘清温度对Q10的直接和间接影响, 以提高碳循环-气候模型的预测能力. ...
Evaluating the fit of structural equation models: tests of significance and descriptive goodness-of-fit measures 1 2003
... 采用结构方程模型(SEM)来分析气候和土壤因素对Q10的直接和间接影响(Geng et al., 2012), 这两种影响均采用标准化的路径系数(使用极大似然法估计的多元回归系数)计算, 基于已有理论和变量间相关性, 建立了Q10与气候和土壤因素之间的初始SEM模型, 使用卡方检验(χ2; 当0 ≤ χ2 ≤ 2, 0.05 < p ≤ 1.00时模型具有较好的拟合优度)和近似误差均方根(RMSEA; 当0 ≤ RMSEA ≤ 0.05, 0.10 < p ≤ 1.00时模型具有较好的拟合优度)对模型的拟合优度进行评估(Schermelleh-Engel et al., 2003), 剔除初始模型中的非显著路径, 获得最终模型. ...
Thermodynamic theory explains the temperature optima of soil microbial processes and high Q10 values at low temperatures 2 2014
... 中国森林Q10随MAT增加而减小(图4D), 表明较寒冷地区的土壤呼吸对温度升高的敏感性高于较温暖地区, 支持了现有的研究结论(Peng et al., 2009; Xu et al., 2015; Li et al., 2020).研究表明, MAT可以通过直接和间接途径影响Q10.首先, 根呼吸和微生物呼吸均需要酶的参与, 温度升高会导致酶活性的相对增加幅度下降(Peterson et al., 2007; Schipper et al., 2014; Li et al., 2020), 从而降低Q10; 大分子速率理论(MMRT)还表明Q10受酶催化反应热容差(ΔC?p)的强烈影响, ΔC?p随温度升高而降低, 导致Q10随温度升高而降低(Schipper et al., 2014; Li et al., 2020).其次, 尽管温度升高通过促进土壤微生物快速分解活性有机碳导致Q10随SOC增加而增大(Giardina & Ryan, 2000; Rustad et al., 2001), 但温暖地区较高的分解速率降低了SOC, 因此Q10较低(图5A).此外, MAT和MAP相互影响, 共同作用于Q10.本研究中MAT通过对Q10的直接和间接影响最终降低了Q10 (图5B).MAT每增加1 ℃, Q10下降5.7% (图4D), 该值与Peng等(2009)和Li等(2019)的估计值(6%)类似, 高于Xu等(2015)的估计值(3.8%), 造成这种差异的机制尚未得到证实, 可能是不同研究中使用的样本量和生态系统类型的差异引起的.例如Xu等(2015)的研究中包括74个Q10观测值, 本研究中的399个观测值能更全面地量化中国森林生态系统土壤呼吸对温度升高的响应.未来在气候变暖的趋势下, 有必要厘清温度对Q10的直接和间接影响, 以提高碳循环-气候模型的预测能力. ...
... 随温度升高而降低(Schipper et al., 2014; Li et al., 2020).其次, 尽管温度升高通过促进土壤微生物快速分解活性有机碳导致Q10随SOC增加而增大(Giardina & Ryan, 2000; Rustad et al., 2001), 但温暖地区较高的分解速率降低了SOC, 因此Q10较低(图5A).此外, MAT和MAP相互影响, 共同作用于Q10.本研究中MAT通过对Q10的直接和间接影响最终降低了Q10 (图5B).MAT每增加1 ℃, Q10下降5.7% (图4D), 该值与Peng等(2009)和Li等(2019)的估计值(6%)类似, 高于Xu等(2015)的估计值(3.8%), 造成这种差异的机制尚未得到证实, 可能是不同研究中使用的样本量和生态系统类型的差异引起的.例如Xu等(2015)的研究中包括74个Q10观测值, 本研究中的399个观测值能更全面地量化中国森林生态系统土壤呼吸对温度升高的响应.未来在气候变暖的趋势下, 有必要厘清温度对Q10的直接和间接影响, 以提高碳循环-气候模型的预测能力. ...
Soil respiration and the global carbon cycle 1 2000
Quantification of soil respiration in forest ecosystems across China 4 2014
... Q10的空间变异主要受气候、土壤和植被因素的影响.许多研究表明Q10随温度和降水量的增加而减小(Peng et al., 2009; Wang et al., 2010; Song et al., 2014; Xu et al., 2015), 然而Chen和Tian (2005)的研究表明Q10在热带和亚热带地区不受温度的影响, Zheng等(2009)的研究则表明Q10与降水量无显著关系, 但随温度的增加而减小.土壤水分对Q10的影响较复杂, Q10随土壤水分的增加而增大、不变或减小(Klimek et al., 2009; Wang et al., 2014; Zhao et al., 2017).其他一些研究表明Q10随土壤有机碳含量(SOC)、土壤总氮含量(TN)、土壤pH的增加而增大, 随可溶性有机碳含量的增加而减小(Zhou et al., 2009; Song et al., 2014; Liu et al.,2017; Zhao et al., 2017).还有研究表明Q10随植被活动(归一化植被指数(NDVI)季节变幅、叶面积指数(LAI)季节变幅)的增强而增大(Curiel Yuste et al., 2004; Wang et al., 2010).因此, 对于Q10空间变异的影响因素仍缺乏一致认识. ...
... ; Song et al., 2014; Liu et al.,2017; Zhao et al., 2017).还有研究表明Q10随植被活动(归一化植被指数(NDVI)季节变幅、叶面积指数(LAI)季节变幅)的增强而增大(Curiel Yuste et al., 2004; Wang et al., 2010).因此, 对于Q10空间变异的影响因素仍缺乏一致认识. ...
... Q10随SOC和TN的增加而增大, 与现有的研究结果一致(Zheng et al., 2009; Song et al., 2014).土壤有机碳是土壤微生物呼吸的重要底物(Bond-Lamberty et al., 2018), 在其他环境因素不变的条件下, SOC较高的生态系统其土壤微生物呼吸速率随温度升高的幅度也较大, 因此Q10更高.由于土壤中碳氮存在紧密的耦合关系, 二者是协同积累的(G?rden?s et al., 2011), 因此SOC和TN呈正相关关系(图5A).此外, 尽管有研究发现Q10与底物质量(C:N)呈负相关关系(Fierer et al., 2006; Liu et al., 2017; Wang et al., 2018a), 但本研究中Q10与C:N无显著关系(图4I), 这表明Q10的空间变异可能不受底物质量的影响.一些室内培养实验也表明有机质分解对温度的响应与底物质量无关(Fang et al., 2005; Li et al., 2019), 还有研究发现土壤基质对有机质的保护作用对Q10的影响远超过底物质量(Moinet et al., 2018), Li等(2019)的研究进一步强调了土壤保护性因子(如黏粒含量)对Q10空间变异的重要性. ...
... DNF的Q10在所有森林类型中最高(图3), 这与现有的研究结果一致(Peng et al., 2009; Song et al., 2014).本研究的DNF主要为东北地区的落叶松(Larix gmelinii)林和华北地区的华北落叶松(Larix principis-rupprechtii)林, 少数为华东地区的水杉(Metasequoia glyptostroboides)林.低温是东北和华北地区DNF中根系和微生物酶活性的主要限制因素, 因此DNF中土壤呼吸对温度的变化最敏感, 这也可以由Q10与MAT的负相关关系来检验(图4D).Q10对环境因素的响应随森林类型变化(附录II).DNF中Q10与MAT和SOC无显著关系, 但随MAP增加而减小; 其余森林类型中Q10均随MAT增加而减小, 随SOC增加而增大, 但与MAP无显著关系, 这些结果可能表明DNF的根系和微生物群落对MAT、MAP和SOC的敏感性与其他森林类型显著不同, 也可能是DNF的观测数据(6个)较少, 不足以准确体现Q10对环境因素的响应, 未来仍需要开展更多的野外观测以明确DNF中Q10对环境因素的响应机制.此外, 森林类型与TN存在交互作用.尽管在DNF和MF中Q10与TN无显著关系, 但在DBF、EBF、ENF中Q10均随TN增加而增大, 且阔叶林(EBF、DBF)中Q10对TN的敏感性强于针叶林(ENF), 这可能是阔叶林与针叶林的根系或微生物群落在利用TN时采取了不同的策略.本研究中阔叶林的TN (2.87 g·kg-1)高于针叶林(1.84 g·kg-1), 以往的研究也发现, 相比于针叶林, 阔叶林的凋落物和枯死根系的归还量高且更易于分解, 因此其养分循环和分解速度更快(Reich et al., 2005; Olsson et al., 2012), 这种差异可能导致阔叶林的土壤微生物群落在利用TN时采用资源获取型策略, 而针叶林则为保守型策略, 但具体机制仍需要大量实验验证.不同森林类型对环境因素的差异性响应预示着未来在气候变化加剧的背景下, 不同森林类型间Q10的差异可能会增大, 这将影响碳循环-气候模型的预测精度, 因此需要予以考虑. ...
Accelerated increase in plant species richness on mountain summits is linked to warming 1 2018
... 全球气候变暖深刻影响着陆地生态系统的分布、结构与功能(Aronson & McNulty, 2009; Steinbauer et al., 2018), 而土壤呼吸的温度敏感性是决定陆地碳循环与气候变化间反馈关系的关键参数(Lenton & Huntingford, 2003; Bond-Lamberty & Thomson, 2010).众多研究采用Q10值(即温度每升高10 ℃, 土壤呼吸速率增加的倍数)来量化土壤呼吸的温度敏感性, 并剖析了Q10的时空变化规律(Davidson et al., 2006; Zhou et al., 2009; Bond- Lamberty et al., 2018; Yan et al., 2019).尽管对Q10在时间动态(季节、年际)的认识已比较明确(Jia et al., 2013; Wang et al., 2017; Yan et al., 2019), 但其空间变异特征和影响因素依然存在较大不确定性. ...
Lectures on Theoretical and Physical Chemistry. Part Ι: Chemical Dynamics 2 1898
Soil water regulates the control of photosynthesis on diel hysteresis between soil respiration and temperature in a desert shrubland 1 2017
... 全球气候变暖深刻影响着陆地生态系统的分布、结构与功能(Aronson & McNulty, 2009; Steinbauer et al., 2018), 而土壤呼吸的温度敏感性是决定陆地碳循环与气候变化间反馈关系的关键参数(Lenton & Huntingford, 2003; Bond-Lamberty & Thomson, 2010).众多研究采用Q10值(即温度每升高10 ℃, 土壤呼吸速率增加的倍数)来量化土壤呼吸的温度敏感性, 并剖析了Q10的时空变化规律(Davidson et al., 2006; Zhou et al., 2009; Bond- Lamberty et al., 2018; Yan et al., 2019).尽管对Q10在时间动态(季节、年际)的认识已比较明确(Jia et al., 2013; Wang et al., 2017; Yan et al., 2019), 但其空间变异特征和影响因素依然存在较大不确定性. ...
Soil moisture modifies the response of soil respiration to temperature in a desert shrub ecosystem 2 2014
... 以往关于Q10空间变异影响因素的研究往往忽略了不同影响因素间的交互作用, 各因素对Q10的直接和间接影响, 以及不同类型生态系统Q10对气候和土壤因素的响应差异, 从而可能造成结果的不确定性.众多研究发现温度和水分之间存在交互作用, 即温度对土壤呼吸的影响随水分条件的变化而变化(Lellei-Kovács et al., 2011; Wang et al., 2014; Liu et al., 2016).Liu等(2017)通过整合文献数据, 发现年平均气温(MAT)和年降水量(MAP)不仅可以直接影响Q10, 还可以通过土壤理化性质和微生物群落间接影响Q10.Chen和Tian (2005)发现Q10在三类生物区系间对温度的响应不同, 其对温度变化的敏感性在寒带最高, 其次是温带, 而在热带和亚热带最低.近年来, 在不同生态系统中土壤呼吸观测数据不断积累, 这为通过整合分析检验在区域尺度上Q10的空间变异特征及其影响因素创造了条件. ...
... 中国森林Q10随MAP增加而减小(图4E), 与现有的研究结果(Peng et al., 2009; Xu et al., 2015)类似, 可能是潮湿地区中过高的土壤水分限制了氧气扩散, 使植物根系和好氧微生物的活动受到抑制, 进而降低了Q10.此外, 有研究发现水分与温度的交互作用会影响Q10, 如在一些干旱和地中海气候的生态系统中温度升高时土壤中的水分降低、土壤呼吸底物扩散受限, 进而导致土壤呼吸速率与温度解耦(Reichstein et al., 2002; Wang et al., 2014), 而本研究中MAP和MAT呈正相关关系(图5A), 但二者对Q10无交互作用(ANCOVA, MAT, F1,394 = 79.98, p < 0.01; MAP, F1,394 = 16.28, p < 0.01; MAT × MAP, F1,394 = 0.62, p = 0.43), 这可能表明只有在极端的温度和水分条件下, 二者才对Q10有交互作用.本研究中MAP每增加100 mm, Q10下降1.6% (图4E), 该值低于现有的研究(8%, Peng et al., 2009; 7%, Xu et al., 2015; 7%, Li et al., 2019), 可能与样本量的差异有关, 本研究在较潮湿地区的观测值(大于1 900 mm: 91个)远多于前人研究(11个, Peng et al., 2009; 6个, Xu et al., 2015), Li等(2019)的研究为室内培养实验, 与野外观测条件差异较大.此外, Li等(2020)最近的整合研究表明, 在全球尺度上Q10与MAP无显著关系, 因此MAP与Q10的负相关关系可能很难扩展到较大的尺度.全球气候变暖伴随着降水时空格局的改变(Knapp et al., 2015), 因此需要在进一步的研究中明确水分对Q10空间变异的作用机制, 在碳循环-气候模型中考虑温度和降水的相互作用. ...
1961-2014年中国干燥度指数的时空变化研究 2 2016
... Q10的空间变异主要受气候、土壤和植被因素的影响.许多研究表明Q10随温度和降水量的增加而减小(Peng et al., 2009; Wang et al., 2010; Song et al., 2014; Xu et al., 2015), 然而Chen和Tian (2005)的研究表明Q10在热带和亚热带地区不受温度的影响, Zheng等(2009)的研究则表明Q10与降水量无显著关系, 但随温度的增加而减小.土壤水分对Q10的影响较复杂, Q10随土壤水分的增加而增大、不变或减小(Klimek et al., 2009; Wang et al., 2014; Zhao et al., 2017).其他一些研究表明Q10随土壤有机碳含量(SOC)、土壤总氮含量(TN)、土壤pH的增加而增大, 随可溶性有机碳含量的增加而减小(Zhou et al., 2009; Song et al., 2014; Liu et al.,2017; Zhao et al., 2017).还有研究表明Q10随植被活动(归一化植被指数(NDVI)季节变幅、叶面积指数(LAI)季节变幅)的增强而增大(Curiel Yuste et al., 2004; Wang et al., 2010).因此, 对于Q10空间变异的影响因素仍缺乏一致认识. ...
... Q10的空间变异主要受气候、土壤和植被因素的影响.许多研究表明Q10随温度和降水量的增加而减小(Peng et al., 2009; Wang et al., 2010; Song et al., 2014; Xu et al., 2015), 然而Chen和Tian (2005)的研究表明Q10在热带和亚热带地区不受温度的影响, Zheng等(2009)的研究则表明Q10与降水量无显著关系, 但随温度的增加而减小.土壤水分对Q10的影响较复杂, Q10随土壤水分的增加而增大、不变或减小(Klimek et al., 2009; Wang et al., 2014; Zhao et al., 2017).其他一些研究表明Q10随土壤有机碳含量(SOC)、土壤总氮含量(TN)、土壤pH的增加而增大, 随可溶性有机碳含量的增加而减小(Zhou et al., 2009; Song et al., 2014; Liu et al.,2017; Zhao et al., 2017).还有研究表明Q10随植被活动(归一化植被指数(NDVI)季节变幅、叶面积指数(LAI)季节变幅)的增强而增大(Curiel Yuste et al., 2004; Wang et al., 2010).因此, 对于Q10空间变异的影响因素仍缺乏一致认识. ...
Carbon quality and soil microbial property control the latitudinal pattern in temperature sensitivity of soil microbial respiration across Chinese forest ecosystems 1 2018a
... Q10随SOC和TN的增加而增大, 与现有的研究结果一致(Zheng et al., 2009; Song et al., 2014).土壤有机碳是土壤微生物呼吸的重要底物(Bond-Lamberty et al., 2018), 在其他环境因素不变的条件下, SOC较高的生态系统其土壤微生物呼吸速率随温度升高的幅度也较大, 因此Q10更高.由于土壤中碳氮存在紧密的耦合关系, 二者是协同积累的(G?rden?s et al., 2011), 因此SOC和TN呈正相关关系(图5A).此外, 尽管有研究发现Q10与底物质量(C:N)呈负相关关系(Fierer et al., 2006; Liu et al., 2017; Wang et al., 2018a), 但本研究中Q10与C:N无显著关系(图4I), 这表明Q10的空间变异可能不受底物质量的影响.一些室内培养实验也表明有机质分解对温度的响应与底物质量无关(Fang et al., 2005; Li et al., 2019), 还有研究发现土壤基质对有机质的保护作用对Q10的影响远超过底物质量(Moinet et al., 2018), Li等(2019)的研究进一步强调了土壤保护性因子(如黏粒含量)对Q10空间变异的重要性. ...
Are ecological gradients in seasonal Q10 of soil respiration explained by climate or by vegetation seasonality? 3 2010
... Q10的空间变异主要受气候、土壤和植被因素的影响.许多研究表明Q10随温度和降水量的增加而减小(Peng et al., 2009; Wang et al., 2010; Song et al., 2014; Xu et al., 2015), 然而Chen和Tian (2005)的研究表明Q10在热带和亚热带地区不受温度的影响, Zheng等(2009)的研究则表明Q10与降水量无显著关系, 但随温度的增加而减小.土壤水分对Q10的影响较复杂, Q10随土壤水分的增加而增大、不变或减小(Klimek et al., 2009; Wang et al., 2014; Zhao et al., 2017).其他一些研究表明Q10随土壤有机碳含量(SOC)、土壤总氮含量(TN)、土壤pH的增加而增大, 随可溶性有机碳含量的增加而减小(Zhou et al., 2009; Song et al., 2014; Liu et al.,2017; Zhao et al., 2017).还有研究表明Q10随植被活动(归一化植被指数(NDVI)季节变幅、叶面积指数(LAI)季节变幅)的增强而增大(Curiel Yuste et al., 2004; Wang et al., 2010).因此, 对于Q10空间变异的影响因素仍缺乏一致认识. ...
... ; Wang et al., 2010).因此, 对于Q10空间变异的影响因素仍缺乏一致认识. ...
... 中国森林生态系统Q10具有一定的集中趋势, 大多数(72%)分布在1.5-3.0之间(平均值: 2.37)(图2A).以往的整合分析也报道了类似的集中趋势, 如Wang等(2010)发现有69%的Q10分布在1.5-3.0之间(平均值: 2.40); Xu等(2015)发现有54%的Q10分布在2.0-3.0之间.尽管Q10有一定的集中趋势, 但仍存在较大的空间变异(全距: 1.09-6.24; 变异系数: 33%).一些研究也发现, 森林生态系统Q10在1.0-6.3之间变化(Davidson et al., 1998; Zheng et al., 2009; Xu et al., 2015). ...
Convergence in temperature sensitivity of soil respiration: evidence from the Tibetan alpine grasslands 1 2018b
... 一些研究认为Q10在不同生态系统间具有趋同性, 不随气候、土壤和生物因素的变化而变化(Bond-Lamberty & Thomson, 2010; Yvon- Durocher et al., 2012; Wang et al., 2018b).如Mahecha等(2010)通过整合全球60个站点的数据, 发现去除季节性混淆因素的影响后, Q10在不同的生物区系之间相似(1.4 ± 0.1).因此, 在许多陆地生态系统碳循环模型中, Q10被假定为一个常数, 如Q10在Community Land Model (CLM)模型中为1.5 (Foereid et al., 2014), 而在Terrestrial Ecosystem Model (TEM)和Carnegie- Ames-Stanford Approach (CASA)模型中为2 (Raich et al., 1991; Potter et al., 1993).而另一些研究发现Q10在不同生态系统间差异显著, 使用固定Q10值估算土壤呼吸会导致较大偏差(Chen & Tian, 2005; Zhou et al., 2009), 近年来, 大量野外观测和数据整合分析也发现在区域尺度上Q10存在较大空间变异(1.09-5.51)(Lenton & Huntingford, 2003; Peng et al., 2009; Xu et al., 2015).因此, Q10的空间变异规律仍需进一步研究. ...
Temperature sensitivity of soil respiration in China’s forest ecosystems: patterns and controls 10 2015
... 一些研究认为Q10在不同生态系统间具有趋同性, 不随气候、土壤和生物因素的变化而变化(Bond-Lamberty & Thomson, 2010; Yvon- Durocher et al., 2012; Wang et al., 2018b).如Mahecha等(2010)通过整合全球60个站点的数据, 发现去除季节性混淆因素的影响后, Q10在不同的生物区系之间相似(1.4 ± 0.1).因此, 在许多陆地生态系统碳循环模型中, Q10被假定为一个常数, 如Q10在Community Land Model (CLM)模型中为1.5 (Foereid et al., 2014), 而在Terrestrial Ecosystem Model (TEM)和Carnegie- Ames-Stanford Approach (CASA)模型中为2 (Raich et al., 1991; Potter et al., 1993).而另一些研究发现Q10在不同生态系统间差异显著, 使用固定Q10值估算土壤呼吸会导致较大偏差(Chen & Tian, 2005; Zhou et al., 2009), 近年来, 大量野外观测和数据整合分析也发现在区域尺度上Q10存在较大空间变异(1.09-5.51)(Lenton & Huntingford, 2003; Peng et al., 2009; Xu et al., 2015).因此, Q10的空间变异规律仍需进一步研究. ...
... Q10的空间变异主要受气候、土壤和植被因素的影响.许多研究表明Q10随温度和降水量的增加而减小(Peng et al., 2009; Wang et al., 2010; Song et al., 2014; Xu et al., 2015), 然而Chen和Tian (2005)的研究表明Q10在热带和亚热带地区不受温度的影响, Zheng等(2009)的研究则表明Q10与降水量无显著关系, 但随温度的增加而减小.土壤水分对Q10的影响较复杂, Q10随土壤水分的增加而增大、不变或减小(Klimek et al., 2009; Wang et al., 2014; Zhao et al., 2017).其他一些研究表明Q10随土壤有机碳含量(SOC)、土壤总氮含量(TN)、土壤pH的增加而增大, 随可溶性有机碳含量的增加而减小(Zhou et al., 2009; Song et al., 2014; Liu et al.,2017; Zhao et al., 2017).还有研究表明Q10随植被活动(归一化植被指数(NDVI)季节变幅、叶面积指数(LAI)季节变幅)的增强而增大(Curiel Yuste et al., 2004; Wang et al., 2010).因此, 对于Q10空间变异的影响因素仍缺乏一致认识. ...
... 中国森林生态系统Q10具有一定的集中趋势, 大多数(72%)分布在1.5-3.0之间(平均值: 2.37)(图2A).以往的整合分析也报道了类似的集中趋势, 如Wang等(2010)发现有69%的Q10分布在1.5-3.0之间(平均值: 2.40); Xu等(2015)发现有54%的Q10分布在2.0-3.0之间.尽管Q10有一定的集中趋势, 但仍存在较大的空间变异(全距: 1.09-6.24; 变异系数: 33%).一些研究也发现, 森林生态系统Q10在1.0-6.3之间变化(Davidson et al., 1998; Zheng et al., 2009; Xu et al., 2015). ...
... ; Xu et al., 2015). ...
... 中国森林Q10随MAT增加而减小(图4D), 表明较寒冷地区的土壤呼吸对温度升高的敏感性高于较温暖地区, 支持了现有的研究结论(Peng et al., 2009; Xu et al., 2015; Li et al., 2020).研究表明, MAT可以通过直接和间接途径影响Q10.首先, 根呼吸和微生物呼吸均需要酶的参与, 温度升高会导致酶活性的相对增加幅度下降(Peterson et al., 2007; Schipper et al., 2014; Li et al., 2020), 从而降低Q10; 大分子速率理论(MMRT)还表明Q10受酶催化反应热容差(ΔC?p)的强烈影响, ΔC?p随温度升高而降低, 导致Q10随温度升高而降低(Schipper et al., 2014; Li et al., 2020).其次, 尽管温度升高通过促进土壤微生物快速分解活性有机碳导致Q10随SOC增加而增大(Giardina & Ryan, 2000; Rustad et al., 2001), 但温暖地区较高的分解速率降低了SOC, 因此Q10较低(图5A).此外, MAT和MAP相互影响, 共同作用于Q10.本研究中MAT通过对Q10的直接和间接影响最终降低了Q10 (图5B).MAT每增加1 ℃, Q10下降5.7% (图4D), 该值与Peng等(2009)和Li等(2019)的估计值(6%)类似, 高于Xu等(2015)的估计值(3.8%), 造成这种差异的机制尚未得到证实, 可能是不同研究中使用的样本量和生态系统类型的差异引起的.例如Xu等(2015)的研究中包括74个Q10观测值, 本研究中的399个观测值能更全面地量化中国森林生态系统土壤呼吸对温度升高的响应.未来在气候变暖的趋势下, 有必要厘清温度对Q10的直接和间接影响, 以提高碳循环-气候模型的预测能力. ...
... 中国森林Q10随MAP增加而减小(图4E), 与现有的研究结果(Peng et al., 2009; Xu et al., 2015)类似, 可能是潮湿地区中过高的土壤水分限制了氧气扩散, 使植物根系和好氧微生物的活动受到抑制, 进而降低了Q10.此外, 有研究发现水分与温度的交互作用会影响Q10, 如在一些干旱和地中海气候的生态系统中温度升高时土壤中的水分降低、土壤呼吸底物扩散受限, 进而导致土壤呼吸速率与温度解耦(Reichstein et al., 2002; Wang et al., 2014), 而本研究中MAP和MAT呈正相关关系(图5A), 但二者对Q10无交互作用(ANCOVA, MAT, F1,394 = 79.98, p < 0.01; MAP, F1,394 = 16.28, p < 0.01; MAT × MAP, F1,394 = 0.62, p = 0.43), 这可能表明只有在极端的温度和水分条件下, 二者才对Q10有交互作用.本研究中MAP每增加100 mm, Q10下降1.6% (图4E), 该值低于现有的研究(8%, Peng et al., 2009; 7%, Xu et al., 2015; 7%, Li et al., 2019), 可能与样本量的差异有关, 本研究在较潮湿地区的观测值(大于1 900 mm: 91个)远多于前人研究(11个, Peng et al., 2009; 6个, Xu et al., 2015), Li等(2019)的研究为室内培养实验, 与野外观测条件差异较大.此外, Li等(2020)最近的整合研究表明, 在全球尺度上Q10与MAP无显著关系, 因此MAP与Q10的负相关关系可能很难扩展到较大的尺度.全球气候变暖伴随着降水时空格局的改变(Knapp et al., 2015), 因此需要在进一步的研究中明确水分对Q10空间变异的作用机制, 在碳循环-气候模型中考虑温度和降水的相互作用. ...
... ; 7%, Xu et al., 2015; 7%, Li et al., 2019), 可能与样本量的差异有关, 本研究在较潮湿地区的观测值(大于1 900 mm: 91个)远多于前人研究(11个, Peng et al., 2009; 6个, Xu et al., 2015), Li等(2019)的研究为室内培养实验, 与野外观测条件差异较大.此外, Li等(2020)最近的整合研究表明, 在全球尺度上Q10与MAP无显著关系, 因此MAP与Q10的负相关关系可能很难扩展到较大的尺度.全球气候变暖伴随着降水时空格局的改变(Knapp et al., 2015), 因此需要在进一步的研究中明确水分对Q10空间变异的作用机制, 在碳循环-气候模型中考虑温度和降水的相互作用. ...
... ; 6个, Xu et al., 2015), Li等(2019)的研究为室内培养实验, 与野外观测条件差异较大.此外, Li等(2020)最近的整合研究表明, 在全球尺度上Q10与MAP无显著关系, 因此MAP与Q10的负相关关系可能很难扩展到较大的尺度.全球气候变暖伴随着降水时空格局的改变(Knapp et al., 2015), 因此需要在进一步的研究中明确水分对Q10空间变异的作用机制, 在碳循环-气候模型中考虑温度和降水的相互作用. ...
Temperature sensitivity of soil respiration across multiple time scales in a temperate plantation forest 2 2019
... 全球气候变暖深刻影响着陆地生态系统的分布、结构与功能(Aronson & McNulty, 2009; Steinbauer et al., 2018), 而土壤呼吸的温度敏感性是决定陆地碳循环与气候变化间反馈关系的关键参数(Lenton & Huntingford, 2003; Bond-Lamberty & Thomson, 2010).众多研究采用Q10值(即温度每升高10 ℃, 土壤呼吸速率增加的倍数)来量化土壤呼吸的温度敏感性, 并剖析了Q10的时空变化规律(Davidson et al., 2006; Zhou et al., 2009; Bond- Lamberty et al., 2018; Yan et al., 2019).尽管对Q10在时间动态(季节、年际)的认识已比较明确(Jia et al., 2013; Wang et al., 2017; Yan et al., 2019), 但其空间变异特征和影响因素依然存在较大不确定性. ...
... ; Yan et al., 2019), 但其空间变异特征和影响因素依然存在较大不确定性. ...
Reconciling the temperature dependence of respiration across timescales and ecosystem types 1 2012
... 一些研究认为Q10在不同生态系统间具有趋同性, 不随气候、土壤和生物因素的变化而变化(Bond-Lamberty & Thomson, 2010; Yvon- Durocher et al., 2012; Wang et al., 2018b).如Mahecha等(2010)通过整合全球60个站点的数据, 发现去除季节性混淆因素的影响后, Q10在不同的生物区系之间相似(1.4 ± 0.1).因此, 在许多陆地生态系统碳循环模型中, Q10被假定为一个常数, 如Q10在Community Land Model (CLM)模型中为1.5 (Foereid et al., 2014), 而在Terrestrial Ecosystem Model (TEM)和Carnegie- Ames-Stanford Approach (CASA)模型中为2 (Raich et al., 1991; Potter et al., 1993).而另一些研究发现Q10在不同生态系统间差异显著, 使用固定Q10值估算土壤呼吸会导致较大偏差(Chen & Tian, 2005; Zhou et al., 2009), 近年来, 大量野外观测和数据整合分析也发现在区域尺度上Q10存在较大空间变异(1.09-5.51)(Lenton & Huntingford, 2003; Peng et al., 2009; Xu et al., 2015).因此, Q10的空间变异规律仍需进一步研究. ...
Environmental controls on soil respiration in alpine meadow along a large altitudinal gradient on the central Tibetan Plateau 2 2017
... Q10的空间变异主要受气候、土壤和植被因素的影响.许多研究表明Q10随温度和降水量的增加而减小(Peng et al., 2009; Wang et al., 2010; Song et al., 2014; Xu et al., 2015), 然而Chen和Tian (2005)的研究表明Q10在热带和亚热带地区不受温度的影响, Zheng等(2009)的研究则表明Q10与降水量无显著关系, 但随温度的增加而减小.土壤水分对Q10的影响较复杂, Q10随土壤水分的增加而增大、不变或减小(Klimek et al., 2009; Wang et al., 2014; Zhao et al., 2017).其他一些研究表明Q10随土壤有机碳含量(SOC)、土壤总氮含量(TN)、土壤pH的增加而增大, 随可溶性有机碳含量的增加而减小(Zhou et al., 2009; Song et al., 2014; Liu et al.,2017; Zhao et al., 2017).还有研究表明Q10随植被活动(归一化植被指数(NDVI)季节变幅、叶面积指数(LAI)季节变幅)的增强而增大(Curiel Yuste et al., 2004; Wang et al., 2010).因此, 对于Q10空间变异的影响因素仍缺乏一致认识. ...
... ; Zhao et al., 2017).还有研究表明Q10随植被活动(归一化植被指数(NDVI)季节变幅、叶面积指数(LAI)季节变幅)的增强而增大(Curiel Yuste et al., 2004; Wang et al., 2010).因此, 对于Q10空间变异的影响因素仍缺乏一致认识. ...
When will China achieve its carbon emission peak? 1 2016
Temperature sensitivity of soil respiration is affected by prevailing climatic conditions and soil organic carbon content: a trans-China based case study 3 2009
... Q10的空间变异主要受气候、土壤和植被因素的影响.许多研究表明Q10随温度和降水量的增加而减小(Peng et al., 2009; Wang et al., 2010; Song et al., 2014; Xu et al., 2015), 然而Chen和Tian (2005)的研究表明Q10在热带和亚热带地区不受温度的影响, Zheng等(2009)的研究则表明Q10与降水量无显著关系, 但随温度的增加而减小.土壤水分对Q10的影响较复杂, Q10随土壤水分的增加而增大、不变或减小(Klimek et al., 2009; Wang et al., 2014; Zhao et al., 2017).其他一些研究表明Q10随土壤有机碳含量(SOC)、土壤总氮含量(TN)、土壤pH的增加而增大, 随可溶性有机碳含量的增加而减小(Zhou et al., 2009; Song et al., 2014; Liu et al.,2017; Zhao et al., 2017).还有研究表明Q10随植被活动(归一化植被指数(NDVI)季节变幅、叶面积指数(LAI)季节变幅)的增强而增大(Curiel Yuste et al., 2004; Wang et al., 2010).因此, 对于Q10空间变异的影响因素仍缺乏一致认识. ...
... 中国森林生态系统Q10具有一定的集中趋势, 大多数(72%)分布在1.5-3.0之间(平均值: 2.37)(图2A).以往的整合分析也报道了类似的集中趋势, 如Wang等(2010)发现有69%的Q10分布在1.5-3.0之间(平均值: 2.40); Xu等(2015)发现有54%的Q10分布在2.0-3.0之间.尽管Q10有一定的集中趋势, 但仍存在较大的空间变异(全距: 1.09-6.24; 变异系数: 33%).一些研究也发现, 森林生态系统Q10在1.0-6.3之间变化(Davidson et al., 1998; Zheng et al., 2009; Xu et al., 2015). ...
... Q10随SOC和TN的增加而增大, 与现有的研究结果一致(Zheng et al., 2009; Song et al., 2014).土壤有机碳是土壤微生物呼吸的重要底物(Bond-Lamberty et al., 2018), 在其他环境因素不变的条件下, SOC较高的生态系统其土壤微生物呼吸速率随温度升高的幅度也较大, 因此Q10更高.由于土壤中碳氮存在紧密的耦合关系, 二者是协同积累的(G?rden?s et al., 2011), 因此SOC和TN呈正相关关系(图5A).此外, 尽管有研究发现Q10与底物质量(C:N)呈负相关关系(Fierer et al., 2006; Liu et al., 2017; Wang et al., 2018a), 但本研究中Q10与C:N无显著关系(图4I), 这表明Q10的空间变异可能不受底物质量的影响.一些室内培养实验也表明有机质分解对温度的响应与底物质量无关(Fang et al., 2005; Li et al., 2019), 还有研究发现土壤基质对有机质的保护作用对Q10的影响远超过底物质量(Moinet et al., 2018), Li等(2019)的研究进一步强调了土壤保护性因子(如黏粒含量)对Q10空间变异的重要性. ...
Global pattern of temperature sensitivity of soil heterotrophic respiration (Q10) and its implications for carbon-climate feedback 3 2009
... 全球气候变暖深刻影响着陆地生态系统的分布、结构与功能(Aronson & McNulty, 2009; Steinbauer et al., 2018), 而土壤呼吸的温度敏感性是决定陆地碳循环与气候变化间反馈关系的关键参数(Lenton & Huntingford, 2003; Bond-Lamberty & Thomson, 2010).众多研究采用Q10值(即温度每升高10 ℃, 土壤呼吸速率增加的倍数)来量化土壤呼吸的温度敏感性, 并剖析了Q10的时空变化规律(Davidson et al., 2006; Zhou et al., 2009; Bond- Lamberty et al., 2018; Yan et al., 2019).尽管对Q10在时间动态(季节、年际)的认识已比较明确(Jia et al., 2013; Wang et al., 2017; Yan et al., 2019), 但其空间变异特征和影响因素依然存在较大不确定性. ...
... 一些研究认为Q10在不同生态系统间具有趋同性, 不随气候、土壤和生物因素的变化而变化(Bond-Lamberty & Thomson, 2010; Yvon- Durocher et al., 2012; Wang et al., 2018b).如Mahecha等(2010)通过整合全球60个站点的数据, 发现去除季节性混淆因素的影响后, Q10在不同的生物区系之间相似(1.4 ± 0.1).因此, 在许多陆地生态系统碳循环模型中, Q10被假定为一个常数, 如Q10在Community Land Model (CLM)模型中为1.5 (Foereid et al., 2014), 而在Terrestrial Ecosystem Model (TEM)和Carnegie- Ames-Stanford Approach (CASA)模型中为2 (Raich et al., 1991; Potter et al., 1993).而另一些研究发现Q10在不同生态系统间差异显著, 使用固定Q10值估算土壤呼吸会导致较大偏差(Chen & Tian, 2005; Zhou et al., 2009), 近年来, 大量野外观测和数据整合分析也发现在区域尺度上Q10存在较大空间变异(1.09-5.51)(Lenton & Huntingford, 2003; Peng et al., 2009; Xu et al., 2015).因此, Q10的空间变异规律仍需进一步研究. ...
... Q10的空间变异主要受气候、土壤和植被因素的影响.许多研究表明Q10随温度和降水量的增加而减小(Peng et al., 2009; Wang et al., 2010; Song et al., 2014; Xu et al., 2015), 然而Chen和Tian (2005)的研究表明Q10在热带和亚热带地区不受温度的影响, Zheng等(2009)的研究则表明Q10与降水量无显著关系, 但随温度的增加而减小.土壤水分对Q10的影响较复杂, Q10随土壤水分的增加而增大、不变或减小(Klimek et al., 2009; Wang et al., 2014; Zhao et al., 2017).其他一些研究表明Q10随土壤有机碳含量(SOC)、土壤总氮含量(TN)、土壤pH的增加而增大, 随可溶性有机碳含量的增加而减小(Zhou et al., 2009; Song et al., 2014; Liu et al.,2017; Zhao et al., 2017).还有研究表明Q10随植被活动(归一化植被指数(NDVI)季节变幅、叶面积指数(LAI)季节变幅)的增强而增大(Curiel Yuste et al., 2004; Wang et al., 2010).因此, 对于Q10空间变异的影响因素仍缺乏一致认识. ...
 ,1,2,3,*, 田赟1,3, 牟钰1,2, 刘鹏1,2, 查天山1,2,3
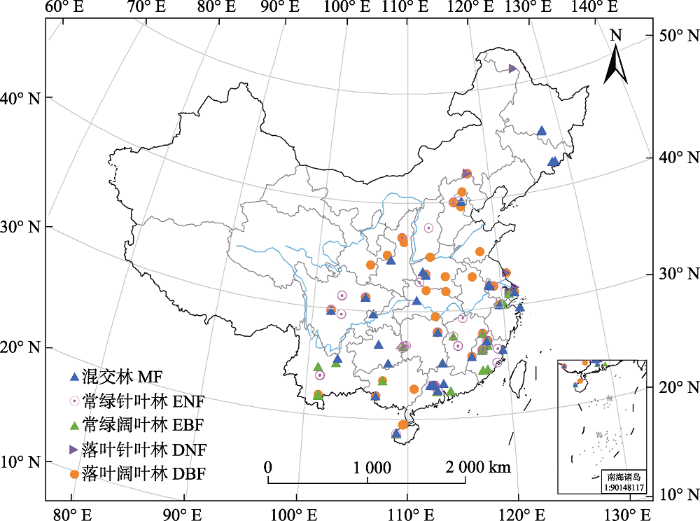 新窗口打开|下载原图ZIP|生成PPT
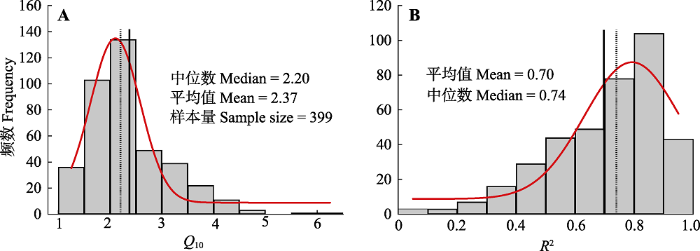 新窗口打开|下载原图ZIP|生成PPT
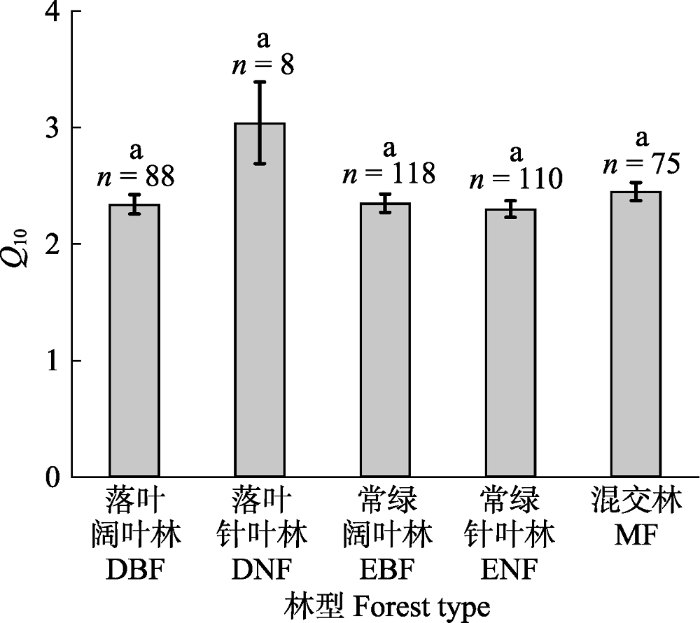 新窗口打开|下载原图ZIP|生成PPT
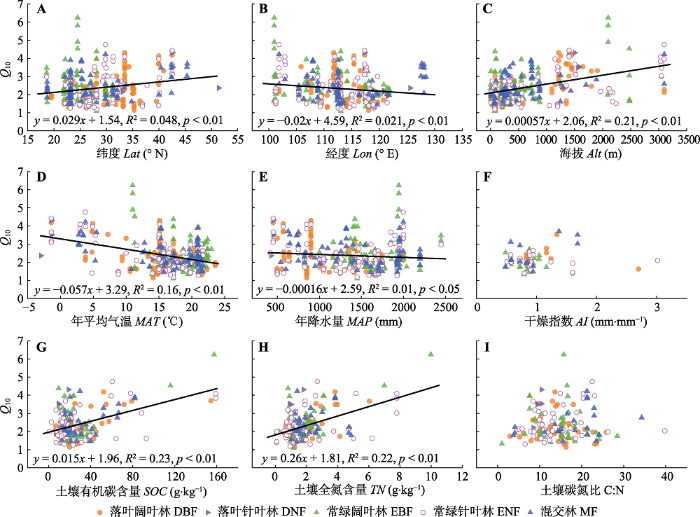 新窗口打开|下载原图ZIP|生成PPT
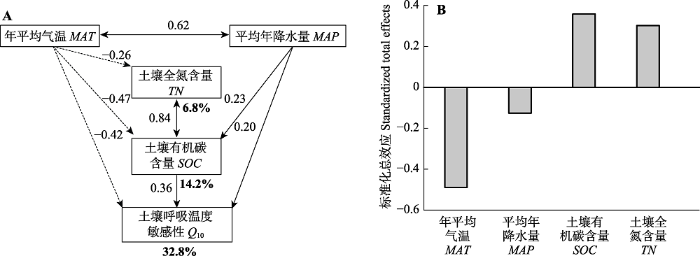 新窗口打开|下载原图ZIP|生成PPT

