Changes in potential geographical distribution of Tsoongiodendron odorum since the Last Glacial Maximum
Wan HU,1,*, Zhi-Yong ZHANG1, Lu-Dan CHEN1, Yan-Song PENG1, Xu WANG21Lushan Botanical Garden, Chinese Academy of Sciences, Provincial Key Laboratory of Plant ex Situ Conservation and Utilization, Jiujiang, Jiangxi 332900, China 2Forestry Industry Development Administration of Jiangxi Province, Nanchang 330006, China
National Natural Science Foundation of China(41961009) Scientific Infrastructure and Capacity Building of Jiangxi Province(2017ZDD01002) Science and Technology Service Network Initiative(KFJ-3W-No1)
Abstract Aims Tsoongiodendron odorum is an ancient relic species belonging to the family Magnoliaceae, but it is labelled endangered plant with extremely small populations and facing serious threats to its wild survival now. Using Ecological Niche Modelling (ENM) to hindcast historical changes in its distribution during the Last Glacial Maximum (LGM), this study aims to explore the impact of climate change on the distribution of T. odorum, and to evaluate the relationship between species distribution and environmental variables. The results of this study could contribute to the conservation of T. odorum in the context of global warming. Methods Based on 96 modern geographical distribution records and 8 bioclimatic variables, we simulated the potential distribution of T. odorum during the LGM, Mid-Holocene, present and future (period of 2061-2080 in the Representative Concentration Pathway 8.5 climate scenario) with MaxEnt model. The changes in species distribution through time were analyzed by SDM toolbox, while the importance of bioclimatic variables was evaluated by percent contribution, permutation importance and Jackknife test. Important findings (1) The highly suitable region for T. odorum was Nanling region, and this area might be the refuge where T. odorum survived in situ during the LGM because only slightly southward retreat in distribution was detected in this region during the LGM. (2) In the two warming climate scenarios (Mid-Holocene and future), the area of the suitable region was reduced, and the decrease of future distribution is greater than that during the Mid-Holocene, which suggests that warming climate might have a negative impact on the distribution of T. odorum. (3) Overall the stability of distribution range of T. odorum in each period indicates the climate adaptation of this species. Human activity or self-breeding problem was likely the significant cause leading to endangered condition. Guangdong and Guangxi should be regarded as priority conservation areas as shown by our results. Keywords:Tsoongiodendron odorum;ecological niche modelling;geographical distribution;Last Glacial Maximum;climate change
PDF (3100KB)元数据多维度评价相关文章导出EndNote|Ris|Bibtex收藏本文 引用本文 胡菀, 张志勇, 陈陆丹, 彭焱松, 汪旭. 末次盛冰期以来观光木的潜在地理分布变迁. 植物生态学报, 2020, 44(1): 44-55. DOI: 10.17521/cjpe.2018.0258 HU Wan, ZHANG Zhi-Yong, CHEN Lu-Dan, PENG Yan-Song, WANG Xu. Changes in potential geographical distribution of Tsoongiodendron odorum since the Last Glacial Maximum. Chinese Journal of Plant Ecology, 2020, 44(1): 44-55. DOI: 10.17521/cjpe.2018.0258
Table 1 表1 表1观光木分布预测使用的气候变量及其重要性参数 Table 1Environmental variables and their importance parameters used in distribution predicting of Tsoongiodendron odorum
气候变量 Variable
描述 Description
PC (%)
PI (%)
RTGW
RTGO
TGW
TGO
AUCW
AUCO
bio01
年平均气温 Annual mean temperature
7.3
17.2
2.051 3
1.788 7
2.117 3
1.900 8
0.956 3
0.945 7
bio02
昼夜温差月均值 Mean diurnal range
0.3
0.3
2.075 3
1.358 2
2.129 2
1.445 2
0.956 6
0.899 9
bio03
等温性 Isothermality
7.7
9.7
2.003 0
0.176 0
2.098 3
0.173 3
0.955 0
0.660 6
bio07
年平均气温变化范围 Temperature annual range
2.8
25.7
2.054 8
1.409 5
2.105 1
1.503 7
0.955 4
0.904 9
bio10
最暖季平均气温 Mean temperature of warmest quarter
1.2
2.7
2.072 1
1.046 4
2.131 3
1.128 5
0.956 8
0.876 8
bio12
年降水量 Annual precipitation
55.2
40.2
2.041 5
1.744 2
2.103 7
1.852 4
0.955 5
0.942 2
bio17
最干季降水量 Precipitation of driest quarter
25
2.4
2.065 4
1.452 0
2.109 3
1.512 8
0.955 8
0.911 2
bio18
最暖季降水量 Precipitation of warmest quarter
0.7
1.9
2.061 3
1.463 5
2.128 3
1.590 2
0.957 0
0.922 9
PC, percent contribution; PI, permutation importance; RTGW, regularized training gain without the variable; RTGO, regularized training gain with only the variable; TGW, test gain without the variable; TGO, test gain with only the variable; AUCW, AUC without the variable; AUCO, AUC with only the variable. PC, 贡献率; PI, 置换重要值; RTGW, 使用除该变量外所有变量的正则化训练增益; RTGO, 单独使用该变量的正则化训练增益; TGW, 使用除该变量外所有变量的测试增益; TGO, 单独使用该变量的测试增益; AUCW, 使用除该变量外所有变量的受试者工作特征曲线下面积; AUCO, 单独使用该变量的受试者工作特征曲线下面积。
物种丰富度和微特有分布(单个或少数网格单元尺度下的物种地理分布限制)可以帮助确定优先保护区, 利用“SDM Tools”模块中“Biodiversity Measurements”子目录的“Estimate Richness and Endemicity (WE and CWE)”工具, 以4个时期预测的分布图层为输入数据叠加计算, 分辨率为100 km, ArcGIS将输出物种丰富度(SR)和加权特有分布(WE)的叠加图层, 描绘出物种丰富度和微特有分布程度均较高的区域。
Fig. 2Major distribution changes of Tsoongiodendron odorum between different periods simulated by MaxEnt. A, Distribution changes from the Last Glacial Maximum to Mid-Holocene. B, Distribution changes from the Mid-Holocene to Current. C, Distribution changes from the current to the future. D, Summed distributions and micro-endemism during the four periods (Last Glacial Maximum, Mid-Holocene, current and future). E, Core range shifts and the line densities, white dots represent the Last Glacial Maximum centroid, black dots represent Mid-Holocene centroid, red dots represent current centroid, blue dots represent future centroid, black arrow represent centroid change.
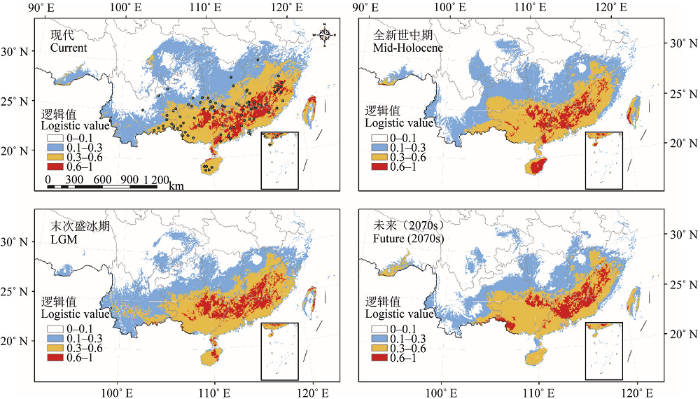
在未来(2070s), 预测潜在适宜分布区显著减小, 与现代相比适生区总面积减少了20.07%, 高度适生区面积减少了18.84%, 分布中心位于广西兴安县。从现代到2070s, 分布区中心点向东偏南71.16°方向位移了62.68 km, 纬度下降约0.60°, 分布区北部和云南部分地区收缩明显, 仅在极少数地区轻微扩张(图2C、2E)。
Table 2 表2 表2观光木现代各适生区的8个环境变量统计分析结果 Table 2Statistics of the eight environmental variables in each of the current suitable areas for Tsoongiodendron odorum
MaxEnt模型的受试者工作特征曲线下面积(AUC值)均在0.9以上, 表明预测结果可信度极高, 可以用于探讨观光木的地理分布对第四纪气候变化的响应。结果显示, 观光木的末次盛冰期、全新世中期和未来的适生区面积均较现代减少(表3)。末次盛冰期的分布区总面积相比现代略有减小, 但高度适生区的面积减幅不大, 分布中心在纬度上比现代低0.65°, 总体分布范围变化不大, 说明观光木在末次盛冰期的分布略有收缩和轻微的南移现象。尽管化石孢粉数据显示第四纪冰期寒冷干燥的气候迫使许多植物大幅度向南迁移避难, 常绿阔叶林的北界向南退缩约1 000 km (24° N), 热带森林植被在中国大陆南部基本消失(Harrison et al., 2001; 陈瑜和倪健, 2008; Ni et al., 2010)。然而大量谱系地理学研究已经揭示了中国亚热带植物在多个避难所内原地避难的模式, 许多植物在末次冰期预测的潜在分布区也并未完全退缩到24° N以南(Qiu et al., 2011; 叶俊伟等, 2017)。观光木主要分布在亚热带南部至亚洲热带的常绿阔叶林中, 从高度适生区的位置来看, 涵盖了南岭和武夷山山脉, 以及广西大瑶山和广东九连山等山地区域(图1), 这些山区本身拥有高度的地形异质性, 保持了极高的物种多样性和特有性, 通常是动植物重要的避难所(应俊生, 2001)。此外, 中国亚热带未受到冰川的直接作用, 尽管该地区年平均气温下降4-6 ℃, 但山区受地形影响, 湿度变化较小, 而且中国南方亚热带作为亚热带与热带的交界地区, 可能由于气流运动形成丰富的山地降水, 山地地表的水热条件仍然适宜森林植被生长(吕燕, 2014)。因此, 可以推测观光木种群在末次盛冰期并没有大尺度向南退缩避难, 很可能在复杂的山区地形和温和的微环境所形成的避难所中原地保存了下来, 并未受到冰期的不利影响或限制作用。
Table 3 表3 表3观光木不同时期的潜在分布区特征 Table 3Characteristics of potential distribution in different periods for Tsoongiodendron odorum
时期 Period
年平均气温 Annual mean temperature (℃)
年降水量 Annual precipitation (mm)
各适生区面积(现代相比面积变化的百分比%) Area of each suitable region (the percentage change in area compared with current, %)
低度适生区 Marginally suitable region
中度适生区 Moderately suitable region
高度适生区 Highly suitable region
总适生区 Total suitable region
LGM
16.7
1 589.7
64.01 (-14.84)
52.21 (-7.87)
16.16 (-4.57)
132.38 (-11.02)
Mid
20.1
1 741.3
66.93 (-10.96)
51.38 (-9.33)
14.32 (-15.40)
132.64 (-10.85)
Future
23.1
1 831.7
54.73 (-27.19)
50.43 (-11.01)
13.74 (-18.84)
118.91 (-20.07)
Current
20.5
1 680.4
75.17 (0.00)
56.67 (0.00)
16.93 (0.00)
148.77 (0.00)
Annual mean temperature and precipitation were the average values of the highly suitable region in each period. LGM, Last Glacial Maximum; Mid, Mid-Holocene. 年平均气温、年降水量为各时期高度适生区的平均值。LGM, 末次盛冰期; Mid, 全新世中期; Future, 未来; Current, 现代。
AhmedSE, McinernyG, O’HaraK, HarperR, SalidoL, EmmottS, JoppaLN (2015). Scientists and software-surveying the species distribution modelling community Diversity and Distributions, 21, 258-267. [本文引用: 1]
BarbosaFG, SchneckF (2015). Characteristics of the top-cited papers in species distribution predictive models Ecological Modelling, 313, 77-83. [本文引用: 1]
BellardC, BertelsmeierC, LeadleyP, ThuillerW, CourchampF (2012). Impacts of climate change on the future of biodiversity Ecology Letters, 15, 365-377. [本文引用: 1]
BrownJL (2014). SDMtoolbox: A python-based GIS toolkit for landscape genetic, biogeographic and species distribution model analyses Methods in Ecology and Evolution, 5, 694-700. [本文引用: 1]
BrownJL, YoderAD (2015). Shifting ranges and conservation challenges for lemurs in the face of climate change Ecology and Evolution, 5, 1131-1142. [本文引用: 1]
ChenXM, LeiYC, ZhangXQ, JiaHY (2012). Effects of sample sizes on accuracy and stability of maximum entropy model in predicting species distribution Scientia Silvae Sinicae, 48(1), 53-59. [本文引用: 1]
ChenY, NiJ (2008). Quantitative palaeovegetation reconstruction at lager scale based on the pollen records Journal of Plant Ecology (Chinese Version), 32, 1201-1212. [本文引用: 2]
DengXL, WuY, LaiMY, XuB, LongWW (2012). Studies on the characteristics of Michelia odora population and its community in south-central Jiangxi Guihaia, 32, 179-184. [本文引用: 1]
Department of Wildlife Conservation and Nature Reserve Management, the National Forestry Bureau (2013). Rare and Endangered Plants in China. China Forestry Publishing House, Beijing. [本文引用: 1]
GrimmNB, Chapin IIIFS, BierwagenB, GonzalezP, GroffmanPM, LuoY, MeltonF, NadelhofferK, PairisA, RaymondPA, SchimelJ, WilliamsonCE (2013). The impacts of climate change on ecosystem structure and function Frontiers in Ecology and the Environment, 11, 474-482. [本文引用: 1]
HamannA, WangT (2009). Potential effects of climate change on ecosystem and tree species distribution in British Columbia Ecology, 39, 2773-2786. [本文引用: 1]
HanleyJA, McNeilBJ (1982). The meaning and use of the area under a receiver operating characteristic (ROC) curve Radiology, 143, 29-36. [本文引用: 1]
HarrisonSP, YuG, TakaharaH, PrenticeIC (2001). Palaeovegetation (Communications arising): Diversity of temperate plants in east Asia Nature, 413, 129-130. [本文引用: 1]
HellerNE, ZavaletaES (2009). Biodiversity management in the face of climate change: A review of 22 years of recommendations Biological Conservation, 142, 14-32. [本文引用: 2]
HewittGM (2004). Genetic consequences of climatic oscillations in the Quaternary Philosophical Transactions of the Royal Society of London. Series B: Biological Sciences, 359, 183-195. DOI:10.1098/rstb.2003.1388URL [本文引用: 1]
KumarS, StohlgrenTJ (2009). Maxent modeling for predicting suitable habitat for threatened and endangered tree Canacomyrica monticola in New Caledonia Journal of Ecology and the Natural Environment, 1, 94-98. [本文引用: 1]
LavergneS, ThompsonJD, GarnierE, DebusscheM (2004). The biology and ecology of narrow endemic and widespread plants, a comparative study of trait variation in 20 congeneric pairs Oikos, 107, 505-518. [本文引用: 1]
LenoirJ, GégoutJC, MarquetPA, De RuffrayP, BrisseH (2008). A significant upward shift in plant species optimum elevation during the 20th century Science, 320, 1768-1771. [本文引用: 1]
LüY (2014). Discussion of Ancient Vegetation and Climate at 10-40 ka BP in the Subtropical Mountains of Southern China Master degree dissertation, Nanjing Normal University, Nanjing. [本文引用: 1]
Members of China Quaternary Pollen Data Base (2000). Pollen-?based biome reconstruction at Middle Holocene (6 ka BP) and last glacial maximum (18 ka BP) in China Acta Botanica Sinica, 42, 1201-1209. [本文引用: 1]
[ 中国第四纪孢粉数据库小组 (2000). 中国中全新世(6 ka BP)和末次盛冰期(18 ka BP)生物群区的重建 植物学报, 42, 1201-1209.] [本文引用: 1]
NiJ, YuG, HarrisonSP, PrenticeIC (2010). Palaeovegetation in China during the late Quaternary, biome reconstructions based on a global scheme of plant functional types Palaeogeography Palaeoclimatology Palaeoecology, 289, 44-61. [本文引用: 2]
Nogués-BravoD (2009). Predicting the past distribution of species climatic niches Global Ecology and Biogeography, 18, 521-531. [本文引用: 1]
PhillipsSJ, AndersonRP, SchapireRE (2006). Maximum entropy modeling of species geographic distributions Ecological Modelling, 190, 231-259. [本文引用: 1]
PhillipsSJ, DudíkM (2008). Modeling of species distributions with Maxent, new extensions and a comprehensive evaluation Ecography, 31, 161-175. [本文引用: 1]
ProvanJ, BennettKD (2008). Phylogeographic insights into cryptic glacial refugia Trends in Ecology & Evolution, 23, 564-571. [本文引用: 1]
QiuYX, FuCX, ComesHP (2011). Plant molecular phylogeography in China and adjacent regions, tracing the genetic imprints of Quaternary climate and environmental change in the world?s most diverse temperate flora Molecular Phylogenetics & Evolution, 59, 225-244. [本文引用: 1]
QuH, WangCJ, ZhangZX (2018). Planning priority conservation areas under climate change for six plant species with extremely small populations in China Nature Conservation, 25, 89-106. [本文引用: 3]
SekerciogluCH, SchneiderSH, FayJP, LoarieSR (2008). Climate change, elevational range shifts, and bird extinctions Conservation Biology, 22, 140-150. DOI:10.1111/j.1523-1739.2007.00852.xURL [本文引用: 1]
SongWJ, WuSH, TaoZX, DaiJH (2016). Distribution change of plants over mid-eastern China during last 30 years Geographical Research, 35, 1420-1432. [本文引用: 1]
ThomasE, van ZonneveldM, LooJ, HodgkinT, GalluzziG, van EttenJ (2012). Present spatial diversity patterns of Theobroma cacao L. in the neotropics reflect genetic differentiation in pleistocene refugia followed by human-?influenced dispersal PLOS ONE, 7, e47676. DOI: 10.1371/??journal.pone.0047676. [本文引用: 1]
ThuillerW, LavorelS, AraújoMB, SykesMT, PrenticeIC (2005). Climate change threats to plant diversity in Europe Proceedings of the National Academy of Sciences of the United States of America, 102, 8245-8250. [本文引用: 1]
VazUL, CunhaHF, NaboutJC (2015). Trends and biases in global scientific literature about ecological niche models Brazilian Journal of Biology, 75, 17-24. [本文引用: 1]
WangX, WangJ, JiangJH, KangM (2012). Genetic diversity and the mating system in a fragmented population of Tsoongiodendron odorum Biodiversity Science, 20, 676-684. DOI:10.3724/SP.J.1003.2012.09083URL [本文引用: 1] Habitat fragmentation is one of the most serious threats to plant diversity. In general, fragmentation negatively impacts the genetic variability of plant populations due to increased random genetic drift, inbreeding, and reductions in gene flow. To investigate the effect of habitat fragmentation on genetic diversity and the mating system of Tsoongiodendron odorum, in this study, we analyzed genetic diversity and the mating system in hierarchical levels at the population, stands, and the individual scales in a fragmented T. odorum population. We sampled and mapped 61 adult individuals from the population. Using eight microsatellite loci, we genotyped a total of 780 seeds from 15 maternal trees for the mating system analysis. The results revealed moderate levels of genetic diversity in both adults (HE = 0.522) and seeds (HE = 0.499) with no significant differences between the two ontogenic stages. In addition, we did not observe a significant increase in the seeds inbreeding coefficient. Results from the multilocus mating system analysis indicated that T. odorum was an outbreeding species with a multilocus outcrossing rate (tm) of 1.000. A small number of biparental inbreeding and correlated mating events were detected in this fragmented population. We found a small number of effective pollen donors (Nep is between 3.7 and 5.4), which seems to be a common character of insect-pollinated canopy trees. Minor differences in outcrossing rates were detected among stands, and more pollen donors were found in smaller stands. However, outcrossing rate was significantly different among individuals, and a few selfing events were detected in some seed trees. These results may provide fundamental information required to establish long term conservation strategies for this endangered tree which is endemic to China. [ 王霞, 王静, 蒋敬虎, 康明 (2012). 观光木片断化居群的遗传多样性和交配系统 生物多样性, 20, 676-684.] DOI:10.3724/SP.J.1003.2012.09083URL [本文引用: 1] Habitat fragmentation is one of the most serious threats to plant diversity. In general, fragmentation negatively impacts the genetic variability of plant populations due to increased random genetic drift, inbreeding, and reductions in gene flow. To investigate the effect of habitat fragmentation on genetic diversity and the mating system of Tsoongiodendron odorum, in this study, we analyzed genetic diversity and the mating system in hierarchical levels at the population, stands, and the individual scales in a fragmented T. odorum population. We sampled and mapped 61 adult individuals from the population. Using eight microsatellite loci, we genotyped a total of 780 seeds from 15 maternal trees for the mating system analysis. The results revealed moderate levels of genetic diversity in both adults (HE = 0.522) and seeds (HE = 0.499) with no significant differences between the two ontogenic stages. In addition, we did not observe a significant increase in the seeds inbreeding coefficient. Results from the multilocus mating system analysis indicated that T. odorum was an outbreeding species with a multilocus outcrossing rate (tm) of 1.000. A small number of biparental inbreeding and correlated mating events were detected in this fragmented population. We found a small number of effective pollen donors (Nep is between 3.7 and 5.4), which seems to be a common character of insect-pollinated canopy trees. Minor differences in outcrossing rates were detected among stands, and more pollen donors were found in smaller stands. However, outcrossing rate was significantly different among individuals, and a few selfing events were detected in some seed trees. These results may provide fundamental information required to establish long term conservation strategies for this endangered tree which is endemic to China.
WangYS, XieBY, WanFH, XiaoQM, DaiLY (2007). Application of ROC curve analysis in evaluating the performance of alien species potential distribution models Biodiversity Science, 15, 365-372. [本文引用: 1]
WarrenR, VanderwalJ, PriceJ (2013). Quantifying the benefit of early climate change mitigation in avoiding biodiversity loss Nature Climate Change, 3, 678-682. DOI:10.1038/nclimate1887URL [本文引用: 1]
WatsonJEM, IwamuraT, ButtN (2013). Mapping vulnerability and conservation adaptation strategies under climate change Nature Climate Change, 3, 989-994. [本文引用: 1]
WorthingtonTA, ZhangT, LogueDR, MittelstetAR, BrewerSK (2016). Landscape and flow metrics affecting the distribution of a federally-threatened fish, improving management, model fit, and model transferability Ecological Modelling, 342, 1-18. [本文引用: 1]
WuJG, LvJJ, AiL (2009). The impacts of climate change on the biodiversity: Vulnerability and adaptation Ecology and Environmental Sciences, 18, 693-703. [本文引用: 1]
XiaoRG, ZhangYM, WuLF, ShuZF, SongXJ (2017). Research status and prospect of the endangered plant species Tsoongiodendron odorum Chun Journal of Green Science and Technology, (21), 106-107. [本文引用: 3]
XuGB, WuXQ, JiangGX, HuSL, LiuXS, XiaoYF, HaoBB (2014). Genetic diversity and population structure of an endangered species: Tsoongiodendron odorum Chun Journal of Plant Genetic Resources, 15, 255-261. [本文引用: 2]
YangXQ, KushwahaSPS, SaranS, XuJ, RoyPS (2013). Maxent modeling for predicting the potential distribution of medicinal plant, Justicia adhatoda L. in Lesser Himalayan foothills Ecological Engineering, 51, 83-87. DOI:10.1016/j.ecoleng.2012.12.004URL [本文引用: 1] The population of the medicinal plant, Malabar nut (Justicia adhatoda L) is shrinking in Dun valley due to habitat fragmentation, invasion by Lantana camara, over-exploitation, and an ever-increasing human population - the most important being the increasing demand on land for agriculture, industries and the urbanization. Predicting potential geographic distribution of the species is important from species and habitat restoration point of view. This paper reports the results of a study carried out in the Lesser Himalayan foothills in India (Dun valley) on potential distribution modeling for Malabar nut using Maxent model. The Worldclim bioclimatic variables, slope, aspect, elevation, and the land use/land cover (based on IRS LISS-III) data and 46 spatially well-dispersed species occurrence points were used to predict the potential distribution off. adhatoda in ca. 1877 km(2) study area. Jackknife test was used to evaluate the importance of the environmental variables for predictive modeling. Maxent model was highly accurate with a statistically significant AUC value of 92.3. The approach could be promising in predicting the potential distribution of medicinal plant species and thus, can be an effective tool in species restoration and conservation planning. (C) 2012 Elsevier B.V.
YangYS, ChenGS, GuoJF, LinP (2004). Decomposition dynamic of fine roots in a mixed forest of Cunninghamia lanceolata and Tsoongiodendron odorum in mid-subtropics Annals of Forest Science, 61, 65-72. [本文引用: 1]
YeJW, ZhangY, WangXJ (2017). Phylogeographic history of broad-leaved forest plants in subtropical China Acta Ecologica Sinica, 37, 5894-5904. [本文引用: 1]
ZhangL (2015). Applications of maximum entropy (MAXENT) model in prediction of species potential distribution ranges Bulletin of Biology, 50, 9-12. [本文引用: 1]
ZhangXQ, PengLL, LinCH (2008). Progress on the projections of future climate change with variable emission scenarios Advances in Earth Science, 23, 174-185. [本文引用: 1]
ZhuGP, LiuQ, GaoYB (2014). Improving ecological niche model transferability to predict the potential distribution of invasive exotic species Biodiversity Science, 22, 223-230. DOI:10.3724/SP.J.1003.2014.08178URL [本文引用: 1]
ZhuT, MengT, ZhangJ, YinY, CaiZ, YangW, ZhongW (2013). Nitrogen mineralization, immobilization turnover, heterotrophic nitrification, and microbial groups in acid forest soils of subtropical China Biology and Fertility of Soils, 49, 323-331. DOI:10.1007/s00374-012-0725-yURL
Scientists and software-surveying the species distribution modelling community 1 2015
... 生态位模型(ENM)是利用物种现代分布记录和气候因子, 分析分布点和环境因子相关性, 判断物种的生态需求, 并将运算结果投射到不同的时间或地理空间中来预测物种的实际分布和潜在分布(朱耿平等, 2013).运用生态位模型对现代、过去、未来气候下植物分布进行预测, 能够为深入理解物种进化历程以及未来迁移轨迹提供重要的参考依据(Warren et al., 2013).现代分布和预测的未来分布不重叠说明种群将可能受到全球变暖的严重威胁(Waltari et al., 2007), 而过去模型和现代分布的重叠区域可能暗示着拥有丰富遗传多样性的避难所地区(Provan & Bennett, 2008; Nogués-Bravo, 2009; Thomas et al., 2012).近30年来, 研究者们开发了20多种生态位模型(Elith et al., 2006; Qiao et al., 2012), 如BIOCLIM、BIOMAPPER、CLIMEX、DOMAIN、GARP、GAM、GLM、MaxEnt等, 每种模型有不同的理论基础、分析方式和数据需求.其中最大熵(MaxEnt)模型是目前使用最为广泛的生态位模型(Ahmed et al., 2015; Barbosa & Schneck, 2015; Vaz et al., 2015), MaxEnt模型根据已知的物种分布信息预测物种的潜在适宜分布区域(Phillips et al., 2006), 模型精度要优于同类预测模型(王运生等, 2007; 邢丁亮和郝占庆, 2011), 而且在样本量很小(≤20)甚至物种分布数据残缺的情况下, 该模型仍具有良好的预测效果和可信度(Kumar & Stohlgren, 2009), 是针对可用分布数据较少的濒危物种适生区预测最有效的模型(张路, 2015). ...
Characteristics of the top-cited papers in species distribution predictive models 1 2015
... 生态位模型(ENM)是利用物种现代分布记录和气候因子, 分析分布点和环境因子相关性, 判断物种的生态需求, 并将运算结果投射到不同的时间或地理空间中来预测物种的实际分布和潜在分布(朱耿平等, 2013).运用生态位模型对现代、过去、未来气候下植物分布进行预测, 能够为深入理解物种进化历程以及未来迁移轨迹提供重要的参考依据(Warren et al., 2013).现代分布和预测的未来分布不重叠说明种群将可能受到全球变暖的严重威胁(Waltari et al., 2007), 而过去模型和现代分布的重叠区域可能暗示着拥有丰富遗传多样性的避难所地区(Provan & Bennett, 2008; Nogués-Bravo, 2009; Thomas et al., 2012).近30年来, 研究者们开发了20多种生态位模型(Elith et al., 2006; Qiao et al., 2012), 如BIOCLIM、BIOMAPPER、CLIMEX、DOMAIN、GARP、GAM、GLM、MaxEnt等, 每种模型有不同的理论基础、分析方式和数据需求.其中最大熵(MaxEnt)模型是目前使用最为广泛的生态位模型(Ahmed et al., 2015; Barbosa & Schneck, 2015; Vaz et al., 2015), MaxEnt模型根据已知的物种分布信息预测物种的潜在适宜分布区域(Phillips et al., 2006), 模型精度要优于同类预测模型(王运生等, 2007; 邢丁亮和郝占庆, 2011), 而且在样本量很小(≤20)甚至物种分布数据残缺的情况下, 该模型仍具有良好的预测效果和可信度(Kumar & Stohlgren, 2009), 是针对可用分布数据较少的濒危物种适生区预测最有效的模型(张路, 2015). ...
Impacts of climate change on the future of biodiversity 1 2012
... 理解和预测物种如何应对全球气候变化一直是生物多样性研究的核心问题.气候变化使得物种的分布地改变, 生境破碎化加剧, 种群大小减少以及遗传多样性降低, 进而将导致植物的迁移、濒危甚至灭绝, 尤其是对于那些生态位狭窄和种群极小的濒危植物(Thuiller et al., 2005; Heller & Zavaleta, 2009; Bellard et al., 2012; Diez et al., 2012; Grimm et al., 2013; Watson et al., 2013; Qu et al., 2018). ...
SDMtoolbox: A python-based GIS toolkit for landscape genetic, biogeographic and species distribution model analyses 1 2014
... 生态位模型(ENM)是利用物种现代分布记录和气候因子, 分析分布点和环境因子相关性, 判断物种的生态需求, 并将运算结果投射到不同的时间或地理空间中来预测物种的实际分布和潜在分布(朱耿平等, 2013).运用生态位模型对现代、过去、未来气候下植物分布进行预测, 能够为深入理解物种进化历程以及未来迁移轨迹提供重要的参考依据(Warren et al., 2013).现代分布和预测的未来分布不重叠说明种群将可能受到全球变暖的严重威胁(Waltari et al., 2007), 而过去模型和现代分布的重叠区域可能暗示着拥有丰富遗传多样性的避难所地区(Provan & Bennett, 2008; Nogués-Bravo, 2009; Thomas et al., 2012).近30年来, 研究者们开发了20多种生态位模型(Elith et al., 2006; Qiao et al., 2012), 如BIOCLIM、BIOMAPPER、CLIMEX、DOMAIN、GARP、GAM、GLM、MaxEnt等, 每种模型有不同的理论基础、分析方式和数据需求.其中最大熵(MaxEnt)模型是目前使用最为广泛的生态位模型(Ahmed et al., 2015; Barbosa & Schneck, 2015; Vaz et al., 2015), MaxEnt模型根据已知的物种分布信息预测物种的潜在适宜分布区域(Phillips et al., 2006), 模型精度要优于同类预测模型(王运生等, 2007; 邢丁亮和郝占庆, 2011), 而且在样本量很小(≤20)甚至物种分布数据残缺的情况下, 该模型仍具有良好的预测效果和可信度(Kumar & Stohlgren, 2009), 是针对可用分布数据较少的濒危物种适生区预测最有效的模型(张路, 2015). ...
Plant molecular phylogeography in China and adjacent regions, tracing the genetic imprints of Quaternary climate and environmental change in the world?s most diverse temperate flora 1 2011
Present spatial diversity patterns of Theobroma cacao L. in the neotropics reflect genetic differentiation in pleistocene refugia followed by human-?influenced dispersal 1 2012
... 生态位模型(ENM)是利用物种现代分布记录和气候因子, 分析分布点和环境因子相关性, 判断物种的生态需求, 并将运算结果投射到不同的时间或地理空间中来预测物种的实际分布和潜在分布(朱耿平等, 2013).运用生态位模型对现代、过去、未来气候下植物分布进行预测, 能够为深入理解物种进化历程以及未来迁移轨迹提供重要的参考依据(Warren et al., 2013).现代分布和预测的未来分布不重叠说明种群将可能受到全球变暖的严重威胁(Waltari et al., 2007), 而过去模型和现代分布的重叠区域可能暗示着拥有丰富遗传多样性的避难所地区(Provan & Bennett, 2008; Nogués-Bravo, 2009; Thomas et al., 2012).近30年来, 研究者们开发了20多种生态位模型(Elith et al., 2006; Qiao et al., 2012), 如BIOCLIM、BIOMAPPER、CLIMEX、DOMAIN、GARP、GAM、GLM、MaxEnt等, 每种模型有不同的理论基础、分析方式和数据需求.其中最大熵(MaxEnt)模型是目前使用最为广泛的生态位模型(Ahmed et al., 2015; Barbosa & Schneck, 2015; Vaz et al., 2015), MaxEnt模型根据已知的物种分布信息预测物种的潜在适宜分布区域(Phillips et al., 2006), 模型精度要优于同类预测模型(王运生等, 2007; 邢丁亮和郝占庆, 2011), 而且在样本量很小(≤20)甚至物种分布数据残缺的情况下, 该模型仍具有良好的预测效果和可信度(Kumar & Stohlgren, 2009), 是针对可用分布数据较少的濒危物种适生区预测最有效的模型(张路, 2015). ...
Climate change threats to plant diversity in Europe 1 2005
... 理解和预测物种如何应对全球气候变化一直是生物多样性研究的核心问题.气候变化使得物种的分布地改变, 生境破碎化加剧, 种群大小减少以及遗传多样性降低, 进而将导致植物的迁移、濒危甚至灭绝, 尤其是对于那些生态位狭窄和种群极小的濒危植物(Thuiller et al., 2005; Heller & Zavaleta, 2009; Bellard et al., 2012; Diez et al., 2012; Grimm et al., 2013; Watson et al., 2013; Qu et al., 2018). ...
Trends and biases in global scientific literature about ecological niche models 1 2015
... 生态位模型(ENM)是利用物种现代分布记录和气候因子, 分析分布点和环境因子相关性, 判断物种的生态需求, 并将运算结果投射到不同的时间或地理空间中来预测物种的实际分布和潜在分布(朱耿平等, 2013).运用生态位模型对现代、过去、未来气候下植物分布进行预测, 能够为深入理解物种进化历程以及未来迁移轨迹提供重要的参考依据(Warren et al., 2013).现代分布和预测的未来分布不重叠说明种群将可能受到全球变暖的严重威胁(Waltari et al., 2007), 而过去模型和现代分布的重叠区域可能暗示着拥有丰富遗传多样性的避难所地区(Provan & Bennett, 2008; Nogués-Bravo, 2009; Thomas et al., 2012).近30年来, 研究者们开发了20多种生态位模型(Elith et al., 2006; Qiao et al., 2012), 如BIOCLIM、BIOMAPPER、CLIMEX、DOMAIN、GARP、GAM、GLM、MaxEnt等, 每种模型有不同的理论基础、分析方式和数据需求.其中最大熵(MaxEnt)模型是目前使用最为广泛的生态位模型(Ahmed et al., 2015; Barbosa & Schneck, 2015; Vaz et al., 2015), MaxEnt模型根据已知的物种分布信息预测物种的潜在适宜分布区域(Phillips et al., 2006), 模型精度要优于同类预测模型(王运生等, 2007; 邢丁亮和郝占庆, 2011), 而且在样本量很小(≤20)甚至物种分布数据残缺的情况下, 该模型仍具有良好的预测效果和可信度(Kumar & Stohlgren, 2009), 是针对可用分布数据较少的濒危物种适生区预测最有效的模型(张路, 2015). ...
Locating pleistocene refugia: Comparing phylogeographic and ecological niche model predictions 1 2007
... 生态位模型(ENM)是利用物种现代分布记录和气候因子, 分析分布点和环境因子相关性, 判断物种的生态需求, 并将运算结果投射到不同的时间或地理空间中来预测物种的实际分布和潜在分布(朱耿平等, 2013).运用生态位模型对现代、过去、未来气候下植物分布进行预测, 能够为深入理解物种进化历程以及未来迁移轨迹提供重要的参考依据(Warren et al., 2013).现代分布和预测的未来分布不重叠说明种群将可能受到全球变暖的严重威胁(Waltari et al., 2007), 而过去模型和现代分布的重叠区域可能暗示着拥有丰富遗传多样性的避难所地区(Provan & Bennett, 2008; Nogués-Bravo, 2009; Thomas et al., 2012).近30年来, 研究者们开发了20多种生态位模型(Elith et al., 2006; Qiao et al., 2012), 如BIOCLIM、BIOMAPPER、CLIMEX、DOMAIN、GARP、GAM、GLM、MaxEnt等, 每种模型有不同的理论基础、分析方式和数据需求.其中最大熵(MaxEnt)模型是目前使用最为广泛的生态位模型(Ahmed et al., 2015; Barbosa & Schneck, 2015; Vaz et al., 2015), MaxEnt模型根据已知的物种分布信息预测物种的潜在适宜分布区域(Phillips et al., 2006), 模型精度要优于同类预测模型(王运生等, 2007; 邢丁亮和郝占庆, 2011), 而且在样本量很小(≤20)甚至物种分布数据残缺的情况下, 该模型仍具有良好的预测效果和可信度(Kumar & Stohlgren, 2009), 是针对可用分布数据较少的濒危物种适生区预测最有效的模型(张路, 2015). ...
... 生态位模型(ENM)是利用物种现代分布记录和气候因子, 分析分布点和环境因子相关性, 判断物种的生态需求, 并将运算结果投射到不同的时间或地理空间中来预测物种的实际分布和潜在分布(朱耿平等, 2013).运用生态位模型对现代、过去、未来气候下植物分布进行预测, 能够为深入理解物种进化历程以及未来迁移轨迹提供重要的参考依据(Warren et al., 2013).现代分布和预测的未来分布不重叠说明种群将可能受到全球变暖的严重威胁(Waltari et al., 2007), 而过去模型和现代分布的重叠区域可能暗示着拥有丰富遗传多样性的避难所地区(Provan & Bennett, 2008; Nogués-Bravo, 2009; Thomas et al., 2012).近30年来, 研究者们开发了20多种生态位模型(Elith et al., 2006; Qiao et al., 2012), 如BIOCLIM、BIOMAPPER、CLIMEX、DOMAIN、GARP、GAM、GLM、MaxEnt等, 每种模型有不同的理论基础、分析方式和数据需求.其中最大熵(MaxEnt)模型是目前使用最为广泛的生态位模型(Ahmed et al., 2015; Barbosa & Schneck, 2015; Vaz et al., 2015), MaxEnt模型根据已知的物种分布信息预测物种的潜在适宜分布区域(Phillips et al., 2006), 模型精度要优于同类预测模型(王运生等, 2007; 邢丁亮和郝占庆, 2011), 而且在样本量很小(≤20)甚至物种分布数据残缺的情况下, 该模型仍具有良好的预测效果和可信度(Kumar & Stohlgren, 2009), 是针对可用分布数据较少的濒危物种适生区预测最有效的模型(张路, 2015). ...
ROC曲线分析在评价入侵物种分布模型中的应用 1 2007
... 生态位模型(ENM)是利用物种现代分布记录和气候因子, 分析分布点和环境因子相关性, 判断物种的生态需求, 并将运算结果投射到不同的时间或地理空间中来预测物种的实际分布和潜在分布(朱耿平等, 2013).运用生态位模型对现代、过去、未来气候下植物分布进行预测, 能够为深入理解物种进化历程以及未来迁移轨迹提供重要的参考依据(Warren et al., 2013).现代分布和预测的未来分布不重叠说明种群将可能受到全球变暖的严重威胁(Waltari et al., 2007), 而过去模型和现代分布的重叠区域可能暗示着拥有丰富遗传多样性的避难所地区(Provan & Bennett, 2008; Nogués-Bravo, 2009; Thomas et al., 2012).近30年来, 研究者们开发了20多种生态位模型(Elith et al., 2006; Qiao et al., 2012), 如BIOCLIM、BIOMAPPER、CLIMEX、DOMAIN、GARP、GAM、GLM、MaxEnt等, 每种模型有不同的理论基础、分析方式和数据需求.其中最大熵(MaxEnt)模型是目前使用最为广泛的生态位模型(Ahmed et al., 2015; Barbosa & Schneck, 2015; Vaz et al., 2015), MaxEnt模型根据已知的物种分布信息预测物种的潜在适宜分布区域(Phillips et al., 2006), 模型精度要优于同类预测模型(王运生等, 2007; 邢丁亮和郝占庆, 2011), 而且在样本量很小(≤20)甚至物种分布数据残缺的情况下, 该模型仍具有良好的预测效果和可信度(Kumar & Stohlgren, 2009), 是针对可用分布数据较少的濒危物种适生区预测最有效的模型(张路, 2015). ...
Quantifying the benefit of early climate change mitigation in avoiding biodiversity loss 1 2013
... 生态位模型(ENM)是利用物种现代分布记录和气候因子, 分析分布点和环境因子相关性, 判断物种的生态需求, 并将运算结果投射到不同的时间或地理空间中来预测物种的实际分布和潜在分布(朱耿平等, 2013).运用生态位模型对现代、过去、未来气候下植物分布进行预测, 能够为深入理解物种进化历程以及未来迁移轨迹提供重要的参考依据(Warren et al., 2013).现代分布和预测的未来分布不重叠说明种群将可能受到全球变暖的严重威胁(Waltari et al., 2007), 而过去模型和现代分布的重叠区域可能暗示着拥有丰富遗传多样性的避难所地区(Provan & Bennett, 2008; Nogués-Bravo, 2009; Thomas et al., 2012).近30年来, 研究者们开发了20多种生态位模型(Elith et al., 2006; Qiao et al., 2012), 如BIOCLIM、BIOMAPPER、CLIMEX、DOMAIN、GARP、GAM、GLM、MaxEnt等, 每种模型有不同的理论基础、分析方式和数据需求.其中最大熵(MaxEnt)模型是目前使用最为广泛的生态位模型(Ahmed et al., 2015; Barbosa & Schneck, 2015; Vaz et al., 2015), MaxEnt模型根据已知的物种分布信息预测物种的潜在适宜分布区域(Phillips et al., 2006), 模型精度要优于同类预测模型(王运生等, 2007; 邢丁亮和郝占庆, 2011), 而且在样本量很小(≤20)甚至物种分布数据残缺的情况下, 该模型仍具有良好的预测效果和可信度(Kumar & Stohlgren, 2009), 是针对可用分布数据较少的濒危物种适生区预测最有效的模型(张路, 2015). ...
Mapping vulnerability and conservation adaptation strategies under climate change 1 2013
... 理解和预测物种如何应对全球气候变化一直是生物多样性研究的核心问题.气候变化使得物种的分布地改变, 生境破碎化加剧, 种群大小减少以及遗传多样性降低, 进而将导致植物的迁移、濒危甚至灭绝, 尤其是对于那些生态位狭窄和种群极小的濒危植物(Thuiller et al., 2005; Heller & Zavaleta, 2009; Bellard et al., 2012; Diez et al., 2012; Grimm et al., 2013; Watson et al., 2013; Qu et al., 2018). ...
Landscape and flow metrics affecting the distribution of a federally-threatened fish, improving management, model fit, and model transferability 1 2016
 ,1,*, 张志勇1, 陈陆丹1, 彭焱松1, 汪旭2
 新窗口打开|下载原图ZIP|生成PPT
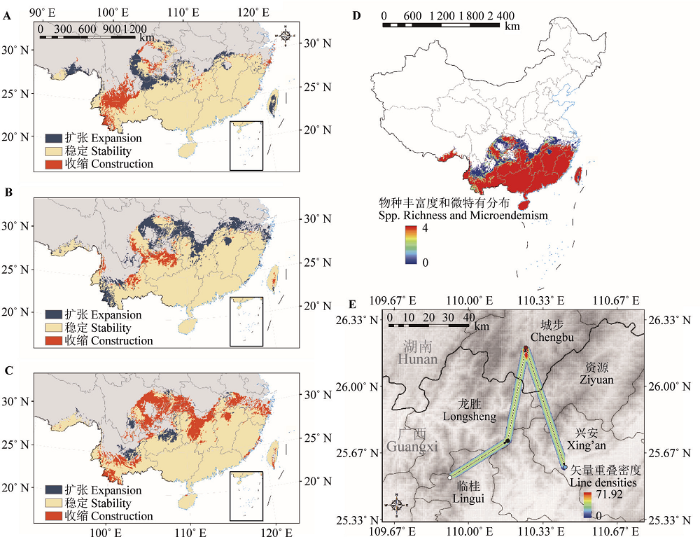 新窗口打开|下载原图ZIP|生成PPT

