 ,3,*
,3,*Determination of maximum electron transport rate and its impact on allocation of electron flow
YE Zi-Piao1, DUAN Shi-Hua2, AN Ting1, KANG Hua-Jing,3,*通讯作者: (kanghuajing@126.com)
编委: 赵平
责任编辑: 李敏
| 基金资助: |
Online:2018-04-20
| Fund supported: |

摘要
非直角双曲线模型(简称模型I)是Farquhar、von Caemmerer和Berry提出的生物化学光合模型(简称FvCB生化模型)的主要子模型。在植物光合作用对光响应曲线的拟合中, 模型I得到广泛的应用和验证。同时, 模型I也可用于估算植物叶片的最大电子传递速率(Jmax)。然而, 由模型I估算植物叶片的Jmax是否与实测值相符, 尚未得到严格的验证。该文应用LI-6400-40光合测定仪测定了遮阴和全日照条件下大豆(Glycine max)叶片的光合速率和电子传递速率对光的响应曲线, 然后分别用模型I和电子传递速率对光响应机理模型(简称模型II)进行了拟合。结果表明, 由模型I估算遮阴和全日照条件下大豆叶片的Jmax与观测值之间存在显著差异; 由模型II计算得到的Jmax与实测值之间不存在显著差异。此外, 用模型I估算的Jmax将高估光合电子流分配到光呼吸的量, 从而高估光呼吸对植物的光保护作用。因此, 在估算植物叶片Jmax和准确评估光呼吸对植物光保护作用方面, 模型II更合理。
关键词:
Abstract
Keywords:
PDF (1117KB)元数据多维度评价相关文章导出EndNote|Ris|Bibtex收藏本文
本文引用格式
叶子飘, 段世华, 安婷, 康华靖. 最大电子传递速率的确定及其对电子流分配的 影响. 植物生态学报[J], 2018, 42(4): 498-507 DOI:10.17521/cjpe.2017.0320
YE Zi-Piao, DUAN Shi-Hua, AN Ting, KANG Hua-Jing.
植物的光合作用受光强、CO2浓度和温度等环境因子的影响。Farquhar等(1980)以及其他****(von Caemmerer & Farquhar, 1981; Harley & Sharkey, 1991; von Caemmerer, 2000, 2013)根据核酮糖-1,5-二磷酸羧化酶/加氧酶(Rubisco)酶动力学反应和核酮糖-1,5-二磷酸(RuBP)再生反应化学计量学, 提出C3植物光合生化模型(简称FvCB模型)。现在, FvCB模型因能描述稳态的碳同化过程且具有明确的生物学意义而被广泛应用于光合作用研究(Dubois et al., 2007; Farquhar & Busch, 2017)。
生化模型由描述Rubisco酶活性限制、RuBP再生限制和磷酸丙糖利用率(TPU)限制等3个过程的子模型构成。其中非直角双曲线模型(简称模型I)是生化模型的主要子模型(Long & Bernacchi, 2003; Dubois et al., 2007; Farquhar & Busch, 2017; 梁星云和刘世荣, 2017; 唐星林等, 2017a, 2017b)。在植物光合作用对光响应曲线(An-I曲线, I为光合有效辐射)的拟合中, 模型I得到广泛的应用和验证, 但由此模型拟合光响应曲线得到的最大净光合速率(Anmax)显著高于实测值(Calama et al., 2013; 王荣荣等, 2013; 冷寒冰等, 2014; Je?ilová et al., 2015; Mayoral et al., 2015; Park et al., 2016; Bellucco et al., 2017; Quiroz et al., 2017), 这将高估植物的光合能力; 并且该模型不能拟合植物发生光抑制时的光响应曲线(Ye, 2007; dos Santos et al., 2013; 王海珍等, 2017)。因此该模型的应用范围受到较大的限制。另外, 模型I也可拟合电子传递速率对光的响应曲线(J-I曲线, J为电子传递速率)从而估算植物叶片的Jmax。假设植物光合电子流只用于碳同化和光呼吸, 就可利用该模型拟合得到的Jmax估算植物分配到碳同化的光合电子流(JC)和分配到光呼吸的光合电子流(JO) (Cheng et al., 2001; Long & Bernacchi, 2003; 康华靖等, 2015; 郭巍等, 2016)。然而, 由模型I估算植物叶片的Jmax是否与实测值相符尚未得到严格的验证。这将直接影响植物叶片JO的准确估算, 进而有可能高估或低估光呼吸在植物光保护中的作用。
2013年, Ye等(2013a, 2013b)从植物光合作用的原初反应入手, 充分考虑捕光色素分子的光能吸收、能级跃迁和退激发、激子共振传递到光反应中心、光系统II (PSII)发生电荷分离(Baker, 2008; Takahashi & Badger, 2011)等过程后构建了一个光合电子流对光响应的机理模型(简称模型II)。由于该机理模型引入有关捕光色素分子的物理参数, 如本征光能吸收截面、有效光能吸收截面、激发态的平均寿命和简并度等概念, 因而可以利用该机理模型研究植物光合电子流对光的响应和植物的光合生理生态特性等(Ser?dio et al., 2013; Li et al., 2015, 2018; Sun et al., 2015; Gao et al., 2017a, 2017b; Shimada et al., 2017)。
本文以世界上最重要的蛋白植物——大豆(Glycine max)为研究对象, 利用便携式光合作用-荧光测量系统同时获取遮阴和全日照条件下的An-I和J-I曲线数据。在此基础上, 应用模型I和模型II分别拟合An-I和J-I曲线数据获得相应的Jmax等参数, 并与实测值进行对比。具体研究目标为: (1)进一步验证模型I和模型II拟合大豆An-I曲线得到的Anmax与实测值之间的差异; (2)比较模型I和模型II拟合J-I曲线得到的Jmax与实测值之间的差异; (3)在以上基础上判断哪个模型能更真实反映植物叶片的光合能力和特性以及模型的普适性; (4)定量研究高估或低估Jmax对JO的影响; (5)定性研究高估或低估Jmax对植物叶片从Rubisco活性限制阶段过渡到RuBP再生速率限制阶段的胞间CO2浓度(Ci,t)的影响。
1 材料和方法
1.1 材料培养
大豆种子采用温州市场购买的‘浙鲜豆8号’品种。种子于2017年5月1日播种催芽, 5月9日定植于口径为32 cm, 深度为25 cm的塑料花盆中。基质采用草炭和珍珠岩以体积比5:1混合, 基施少量复合肥, 拌匀后装盆。每盆进行编号后, 分别随机置于露天及旁边的蓝莓(Vaccinium darrowi ′ V. corymbosum)植株下, 前者无遮阴视为全光处理, 后者有蓝莓树冠遮阴, 视为遮阴处理。经早、中、晚对光强的测量, 其遮阴在30%-40%之间。每组5盆, 共3组。常规管理。1.2 光合数据测量
试验于2017年7月1日至7月5日的晴天进行。此时植株处于结荚期, 长势良好, 植株高度约70 cm。从3组中随机选5-7株长势较为一致的健壮植株。每株苗挑选自上而下第3复叶的顶叶进行挂牌标记。利用便携式光合仪(LI-6400-40, LI-COR, Lincoln, USA)于晴天的9:00-16:00进行数据测量。数据测量前进行开机检查及预热。自然光下诱导1.5-2.0 h后, 采用开放式气路, 流速为500 μmol·s-1。根据预测量仪器中叶室温度(Tblock)的动态变化, 设定叶室温度为37 ℃ (大气温度为35 ℃左右), 空气相对湿度控制在55%-80%, CO2浓度设置为400 μmol·mol-1, 由内置CO2小钢瓶提供, 经校对后使用。在光合有效辐射设置为2000、1800、1600、1400、1200、1000、800、600、400、200、150、100、50和0 μmol·m-2·s-1下测定大豆叶片的An-I曲线和J-I曲线。应用自动测量程序进行数据测量。每次程序记录最小等待时间为2 min, 最大等待时间为3 min, 数据记录前仪器均自动进行参比室和样品室之间的匹配。
1.3 模型简介
1.3.1 光合电子传递速率对光的响应模型模型II (Ye et al., 2013b)的具体表达式为:
式中, J为光合电子传递速率, αe为电子传递速率对光响应曲线的初始斜率, βe为光系统II (PSII)动力学下调系数, γe为饱和系数。利用公式(1), 可得到植物叶片Jmax和与Jmax相对应的饱和光强(PARsat)。
它们分别由$PA{{R}_{\text{sat}}}=\frac{\sqrt{{\text{(}{{\beta }_{\text{e}}}+{{\gamma }_{\text{e}}}\text{)}}/{{{\beta }_{\text{e}}}}\;}-\text{1}}{{{\gamma }_{\text{e}}}}$和${{J}_{\text{max}}}=$ ${{\alpha }_{\text{e}}}{{\left( \frac{\sqrt{{{\beta }_{\text{e}}}+{{\gamma }_{\text{e}}}}-\sqrt{{{\beta }_{\text{e}}}}}{{{\gamma }_{\text{e}}}} \right)}^{2}}$计算获得。
在Farquhar等(1980)的生化模型中, 模型I是其中的一个子模型, 其具体表达式(von Cammerer, 2000)为:
$J=\frac{\alpha I+{{J}_{\max }}-\sqrt{{{(\alpha I+{{J}_{\max }})}^{2}}-4\theta \alpha I{{J}_{\max }}}}{2\theta }$ (2)
式中, θ为快速光曲线的曲率, 其他参数与公式(1) 相同。
此外, 在FvCB生化模型中, 还有另一个描述电子传递速率对光的响应的模型(Smith, 1937), 其具体表达形式为:
在本研究中, 由公式(3)拟合电子传递速率对光的响应曲线得到的Jmax与由公式(2)得到的Jmax之间不存在显著差异。因此, 本文只考虑用公式(2)得到的结果与公式(1)得到的结果进行比较。
1.3.2 光合作用对光的响应模型
在植物叶片光合作用对光响应机理模型中有关光合作用对光的响应模型(简称模型II)(Ye et al., 2013b)为:
式中, An为净光合速率, αp为光合作用对光响应曲线的初始斜率, βp为光抑制系数, γp为饱和系数, Rd为暗呼吸速率。利用公式(4), 可得到植物叶片最大净光合速率(Anmax)与Anmax相对应的饱和光强(Isat)。
它们分别由${{I}_{\text{sat}}}=\frac{\sqrt{{\text{(}{{\beta }_{\text{p}}}+{{\gamma }_{\text{p}}}\text{)}}/{{{\beta }_{\text{p}}}}\;}-\text{1}}{{{\gamma }_{\text{p}}}}$和${{A}_{\text{nmax}}}=$ ${{\alpha }_{\text{p}}}{{\left( \frac{\sqrt{{{\beta }_{\text{p}}}+{{\gamma }_{\text{p}}}}-\sqrt{{{\beta }_{\text{p}}}}}{{{\gamma }_{\text{p}}}} \right)}^{2}}-{{R}_{\text{d}}}$计算获得。
模型I (Thornley, 1976)的表达式为:
${{A}_{\text{n}}}=\frac{\alpha I+{{A}_{\text{nmax}}}-\sqrt{{{(\alpha I+{{A}_{\text{nmax}}})}^{2}}-4\theta \alpha I{{A}_{\text{nmax}}}}}{2\theta }-{{R}_{\text{d}}}$ (5)
式中参数与公式(2)相同。由公式(5)拟合光响应数据可以得到Anmax和其他光合参数。
1.3.3 光合电子流的分配
理论上, 参与碳还原的光合电子流(Valentini et al., 1995), 用JC表示为:
式中, Rl为光呼吸速率, RL为光下暗呼吸速率。由于出现光的部分抑制, 一般认为RL是Rd的一半(Fila et al., 2006)。
参与光呼吸的电子流(Epron et al., 1995), 用JO表示为:
当其他消耗光合电子流的途径可以忽略或为常数时, 那么参与碳同化的光合电子流(Epron et al., 1995; Valentini et al., 1995)为:
由公式(8)可知, 如果Jmax的估算偏大, 则将高估JC的值。
参与光呼吸的光合电子流(Epron et al., 1995; Valentini et al., 1995)为:
由公式(9)可知, 如果Jmax的估算偏大, 也将高估JO的值。
1.4 数据处理
总电子传递速率用公式J = ΦPSII × I × 0.5 × 0.84确定, 其中I是光合有效辐射, ΦPSII是PSII的电子传递效率。然后分别用模型I和模型II拟合大豆叶片的J-I和An-I曲线。拟合An-I曲线得到大豆叶片的Anmax、饱和光强(Isat)和其他光合参数; 拟合J-I曲线得出大豆叶片的Jmax和饱和光强(PARsat)(PARsat是与最大电子传递速率相对应的饱和光强; Isat是与最大净光合速率相对应的饱和光强。PARsat和Isat分别是拟合J-I和An-I响应曲线得到的。为了更好地区分, 我们采用了PARsat和Isat这两个缩写)。在此基础上对这两个模型拟合得到的参数进行比较。采用“光合计算软件” (http://photosynthetic.sinaapp.com/calc.html, 井冈山大学数理学院)对测量数据进行分析。每个处理选取5个重复, 取其平均值。采用DPS 7.5软件对数据进行统计学分析, 并利用配对t检验对由模型I和模型II拟合得到的Jmax之间和Anmax之间进行显著性分析。作图由Origin 8.5软件完成, 然后用Adobe Illustrator CS 5进行图形处理。2 结果和分析
2.1 光合电子传递速率对光的响应
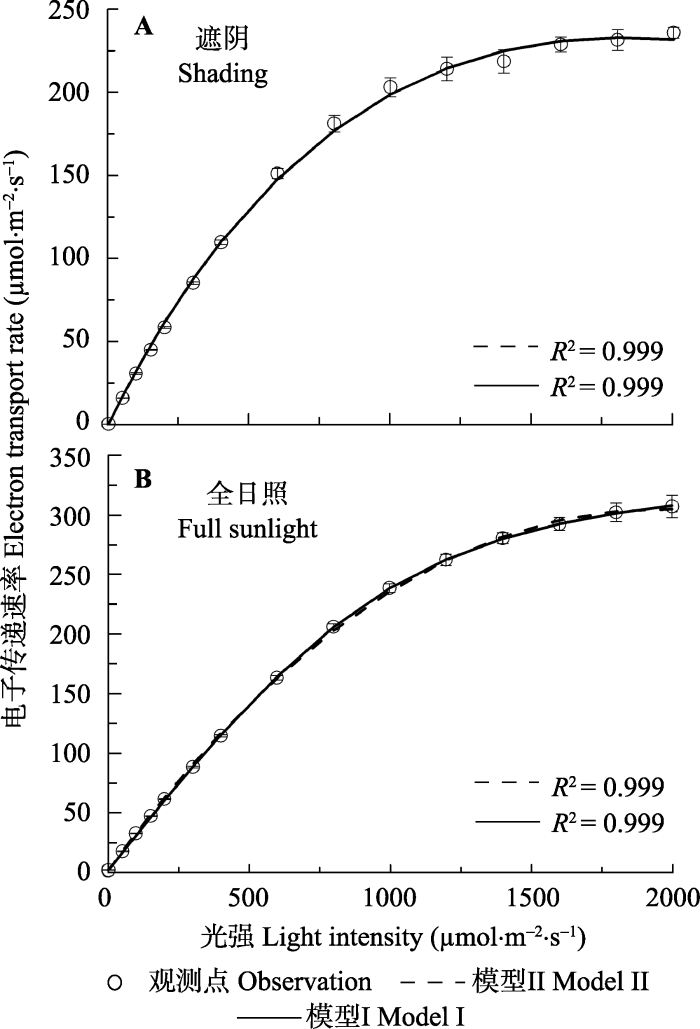
模型I和模型II分别拟合遮阴和全光照条件下大豆叶片的J-I曲线, 其拟合效果见图1。由图1可知, 两种光照条件下大豆叶片的电子传递速率先随光强的增加而逐渐增加到一个平台, 然后达到光饱和处。在设置的最大光照条件(2000 μmol·m-2·s-1)下, 大豆叶片的电子传递速率未出现下降趋势, 即未发生PSII的动力学下调现象(White & Critchley, 1999)。此外, 从图1可知, 模型I和模型II拟合大豆叶片的电子传递速率对光的响应曲线所得到的决定系数都非常高(R2 = 0.999)(图1; 表1), 拟合曲线与观测点之间高度一致(图1)。由此可知, 模型I和模型II均可很好地拟合两种光照条件下大豆叶片的J-I曲线(图1)。图1
 新窗口打开|下载原图ZIP|生成PPT
图1遮阴(A)和全光照(B)下大豆叶片的光合电子传递速率对光的响应曲线(平均值±标准误差, n = 5)。模型I, 非直角双曲线模型; 模型II, 电子传递速率对光响应机理模型。
Fig. 1Light response of electron transport rate for leaves of Glycine max under shading (A) and full sunlight (B) environments (mean ± SE, n = 5). Model I, non-rectangular hyperbola model; Model II, mechanistic model of light-response of electron transport rate.
然而由拟合的相关参数数据(表1)可知, 模型I拟合两种光照条件下大豆叶片的J-I曲线得到的Jmax分别为269.13和354.26 μmol·m-2·s-1, 而观测点的Jmax分别为236.29和306.43 μmol·m-2·s-1。用配对t检验可知, 用模型I拟合得到两种光照条件下大豆叶片的Jmax与观测点之间存在显著差异(表1)。而由模型II拟合同样大豆叶片的J-I曲线得到的Jmax分别为236.68和307.91 μmol·m-2·s-1, 与观测点的数据高 度符合(表1)。此外, 模型II拟合J-I曲线还可以得到两种光照条件下的PARsat分别为1839.98和1967.69 μmol·m-2·s-1, 与观测的PARsat相符合。由于模型I是一个没有极点的函数, 所以, 由模型I不能得到两种光照条件下大豆叶片的PARsat值。
Table 1
表1
表1由非直角双曲线模型(模型I)和光合电子流对光响应机理模型(模型II)拟合两种光照条件下电子传递速率对光的响应曲线(J-I曲线)得到最大电子传递速率(Jmax)和饱和光强(PARsat)两个参数及与它们对应的观测数据(平均值±标准误差, n = 5)
Table 1
| 参数 Parameter | 处理 Treatment | |||||
|---|---|---|---|---|---|---|
| 遮阴 Shading | 全日照 Full sunlight | |||||
| 模型I Model I | 模型II Model II | 测量值 Observed value | 模型I Model I | 模型II Model II | 测量值 Observed value | |
| 最大电子传递速率 Maximum electron transport rate (Jmax, mmol·m-2·s-1) | 269.13 ± 5.22a | 236.68 ± 1.39b | ?236.29 | 354.26 ± 17.73a | 307.91 ± 8.95b | ?306.43 |
| 饱和光强 Saturated light intensity (PARsat, mmol·m-2·s-1) | — | 1 839.98 ± 50.53 | ?1 800 | — | 1 967.69 ± 110.64 | ?2 000 |
| 确定系数 Determination coefficient (R2) | 0.999 | 0.999 | — | 0.999 | 0.999 | — |
新窗口打开|下载CSV
2.2 光合作用对光的响应
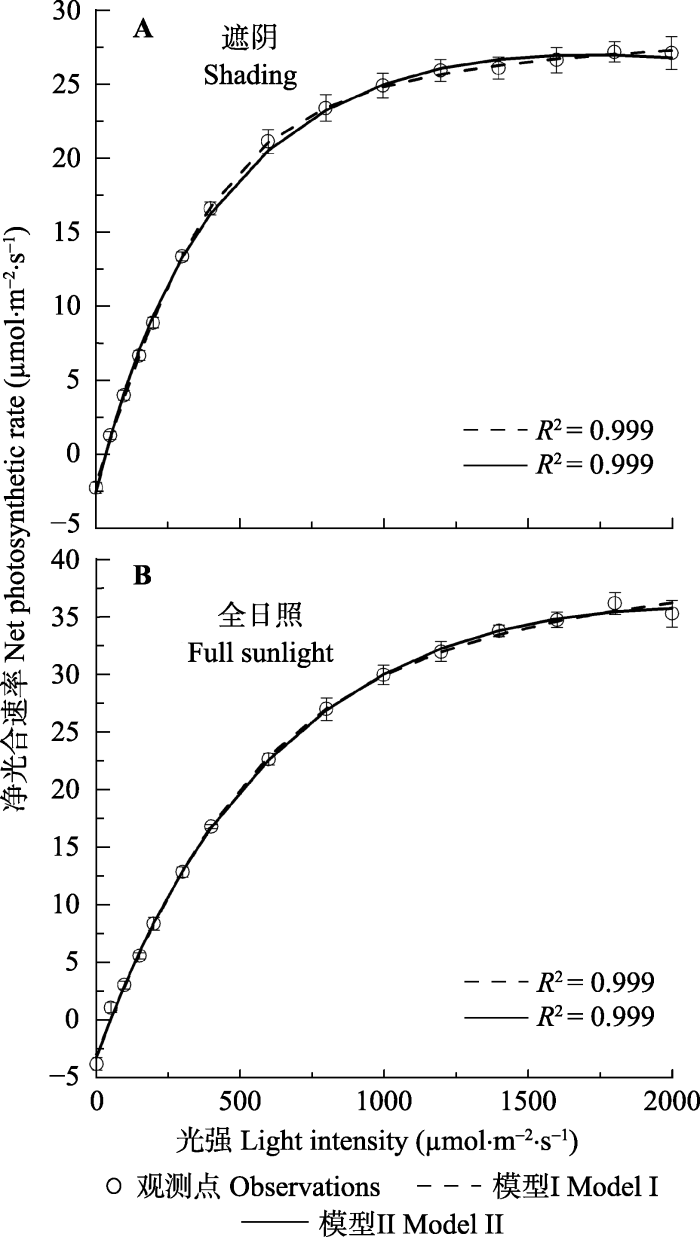
用模型I和模型II分别拟合两种光照条件下大 豆叶片的An-I曲线, 其拟合效果见图2。由图2可知, 两种光照条件下大豆叶片的An在光强低于400 mmol·m-2·s-1时随光强的增加几乎线性增加, 然后An随光强升高而缓慢增加到最大处, 达到光饱和。从拟合效果来看, 模型I和模型II均可很好地拟合两种光照条件下大豆叶片的An-I曲线, 其确定系数都非常高(R2 = 0.999)(图2; 表2)。图2
 新窗口打开|下载原图ZIP|生成PPT
图2遮阴(A)和全光照(B)下大豆叶片的光合作用对光的响应曲线 (平均值±标准误差, n = 5)。模型I, 非直角双曲线模型; 模型II, 电子传递速率对光响应机理模型。
Fig. 2Light-response curves of photosynthesis for shade (A) and sun (B) leaves of soybean (mean ± SE, n = 5). Model I, non-rectangular hyperbola model; Model II, mechanistic model of light-response of electron transport rate.
然而由表2的数据可知, 由模型I拟合两种光照条件下大豆叶片的An-I曲线得到的Anmax分别为 31.28和45.56 μmol·m-2·s-1, 与观测值(27.23和36.17 μmol·m-2·s-1)相比分别高出14.87%和25.96%。用配对t检验可知, 用模型I拟合得到两种光照条件下大豆叶片的Anmax与观测点之间存在显著差异(表2), 而由模型II拟合同样大豆叶片的An-I曲线得到的Anmax分别为26.92和35.52 μmol·m-2·s-1, 与观测点的数据高度符合(表2)。此外, 由模型II拟合An-I曲线还可得到两种光照条件下的Isat, 分别约为1569.96和1998.36 μmol·m-2·s-1, 与观测的Isat符合。同样, 由于模型I是一个没有极点的函数, 所以模型I不能得到两种光照条件下大豆叶片的Isat值。而由两个模型拟合同样的An-I曲线得到的光补充点(Ic)和暗呼吸速率(Rd)之间整体上差异不显著。
2.3 分配到碳同化和光呼吸途径的光合电子流
根据测量(或拟合)的Jmax、Anmax和Rd值(光下暗呼吸值取暗呼吸速率的一半)(Fila et al., 2006)(表1, 表2), 然后利用公式(8)和公式(9)分别估算分配到碳同化和光呼吸途径的最大光合电子流的大小(表3)。由表3数据可知, 模型II估算的碳同化电子流和光呼吸分配的电子流值, 与根据测量值而计算的结果均较为一致(p > 0.05)。模型I计算出不同光强下大豆叶片流向碳同化路径的光合电子流分别为166.48和219.23 μmol·m-2·s-1, 与根据测量值而计算的结果也较为一致(p > 0.05); 而流向光呼吸路径的光合电子流分别为102.65和135.03 μmol·m-2·s-1, 该值则显著高于根据测量值而计算的结果(80.75和103.17 μmol·m-2·s-1)(p < 0.05)。Table 2
表2
表2由非直角双曲线模型(模型I)和光合电子流对光响应机理模型(模型II)拟合两种光照条件下光合作用对光的响应曲线(An-I)得到的光合参数及观测数据(平均数±标准误差, n = 5)
Table 2
| 参数 Parameter | 处理 Treatment | |||||
|---|---|---|---|---|---|---|
| 遮阴 Shading | 全日照 Full sunlight | |||||
| 模型I Model I | 模型II Model II | 测量值 Observed value | 模型I Model I | 模型II Model II | 测量值 Observed value | |
| 初始斜率 Initial slope of A-I curve, α (mmol·mol-1) | 0.061 ± 0.044b | 0.081 ± 0.032a | - | 0.064 ± 0.025a | 0.069 ± 0.025a | - |
| 最大净光合速率 Maximum net photosynthetic rate, Anmax (mmol·m-2·s-1) | 31.28 ± 1.33a | 26.92 ± 1.23b | ?27.23 | 45.56 ± 1.41a | 35.52 ± 1.26b | ?36.17 |
| 饱和光强 Saturated irradiance, Isat (mmol ·m-2·s-1) | - | 1 569.96 ± 24.89 | ?1 600 | - | 1 998.36 ± 36.45 | ?1 800 |
| 光补偿点 Light compensation point, Ic (mmol·m-2·s-1) | 40.65 ± 2.85a | 40.83 ± 2.74a | ?41.59 | 51.49 ± 3.52a | 51.62 ± 3.45a | ?51.96 |
| 暗呼吸速率 Dark respiration, Rd (mmol·m-2 ·s-1) | 2.42 ± 0.87b | 2.99 ± 0.58a | ?3.12 | 3.19 ± 0.56a | 3.45 ± 0.42a | ?3.51 |
| 确定系数 Determination coefficient, R2 | 0.999 | 0.999 | 0.999 | 0.999 | 0.999 | 0.999 |
新窗口打开|下载CSV
Table 3
表3
表3分配到碳同化和光呼吸途径的光合电子流
Table 3
| 参数 Parameter | 处理 Treatment | |||||
|---|---|---|---|---|---|---|
| 遮阴 Shading | 全日照 Full sunlight | |||||
| 模型I Model I | 模型II Model II | 测量或计算值 Observed value | 模型I Model I | 模型II Model II | 测量或计算值 Observed value | |
| 最大电子传递速率 Maximum electron transport rate, Jmax (mmol·m-2·s-1) | 269.13a | 236.68b | 236.29b | 354.26a | 307.91b | 306.43b |
| 最大净光合速率 Maximum net photosynthetic rate, Anmax (mmol·m-2·s-1) | 31.28a | 26.92b | 27.23b | 45.56a | 35.52b | 36.17b |
| 碳同化电子流 Electron flow of partitioning C assimilation, JC-max (mmol·m-2·s-1) | 166.48a | 155.67a | 155.54a | 219.23a | 203.78a | 203.26a |
| 光呼吸电子流 Electron flow of partitioning photorespiration assimilation, JO-max (mmol·m-2·s-1) | 102.65a | 81.01b | 80.75b | 135.03a | 104.13b | 103.17b |
新窗口打开|下载CSV
3 讨论和结论
利用模型I拟合J-I曲线可以得到Jmax, 然而, 由于模型I是一渐近线, 所以, 该模型不能很好地拟合植物存在PSII动力学下调或光抑制的J-I曲线。Buckley和Diaz-Espejo (2015)曾专门讨论了模型I在拟合J-I曲线时存在高估Jmax的问题。而模型II是在考虑光合作用原初反应中捕光色素分子的光能吸收、激发和退激发以及电荷分离产生光合电子流等基础上构建的(Ye et al., 2013a, 2013b), 可拟合不同环境下植物的J-I曲线, 且获得的Jmax和PARsat与实测值高度符合(Ser?dio et al., 2013; 叶子飘等, 2014; Li et al., 2015, 2018; Sun et al., 2015; Gao et al., 2017a, 2017b; Shimada et al., 2017)。准确估算植物叶片的Jmax对研究植物叶片光呼吸过程在光保护中的作用是非常必要的(康华靖等, 2015; 郭巍等, 2016)。本研究结果显示, 虽然模型I可以很好地拟合遮阴和全光照条件下大豆叶片的J-I曲线, 但由该模型拟合得到的Jmax与观测值存在显著差异(表1)。这将高估两种光照条件下大豆分配到光呼吸路径中的光合电子流。由表3数据可知, 由模型I估算得到两种光照条件下大豆叶片分配到光呼吸途径的最大光合电子流(JO-max)分别为102.65和135.03 μmol·m-2·s-1, 与其对应的测量值(分别为80.01和104.13 μmol·m-2·s-1)之间存在显著差异。高估电子流分配到光呼吸途径的数量将进而高估光呼吸路径在高光强下对植物的光保护作用。而光呼吸途径是植物耗散过多光能, 避免吸收过多光能对其所产生伤害的主要途径(Cruz et al., 2005; Takahashi & Badger, 2011; Niyogi & Truong, 2013)。因此, 由模型I估算两种光照条件下大豆叶片的Jmax, 并由此研究光呼吸途径在植物吸收过多光能过程中对植物的光保护作用被夸大, 不能真实地反映出光呼吸在光保护中的作用。
在FvCB生化模型中, Jmax是研究植物发生核酮糖1,5-二磷酸(RuBP)再生速率限制阶段的一个关键参数, 由此参数并结合光合作用对CO2响应曲线就可以确定在光合作用过程中植物叶片从核酮糖-1,5-二磷酸羧化酶/加氧酶(Rubisco酶)活性限制阶段过渡到RuBP再生速率限制阶段的胞间CO2浓度(Ci,t)的值(Cheng et al., 2001; Long & Bernacchi, 2003; Dubois et al., 2007; Miao et al., 2009)。在卡尔文循环过程中, 在Rubisco酶催化下RuBP将与CO2和O2发生羧化反应和氧化反应。当CO2浓度较低时, 底物RuBP浓度过量, Rubisco酶催化活性达到最大, 光合速率受Rubisco酶活性的限制, 即Rubisco酶活性限制阶段(Farquhar et al., 1980; von Caemmerer & Farquhar, 1981; Harley & Sharkey, 1991; von Caemmerer, 2000; Dubois et al., 2007; Miao et al., 2009); 随着CO2浓度升高, 底物RuBP再生速率小于其消耗速率, 使RuBP浓度不足而限制光合速率, 即RuBP再生速率限制阶段(Farquhar et al., 1980; von Caemmerer & Farquhar, 1981; Harley & Sharkey, 1991; von Caemmerer, 2000)。这两个限制阶段的转换Ci,t对研究RuBP再生速率限制过程是必需的。理论上, Ci,t (Miao et al., 2009)可以由以下公式计算得到, 即:
式中, O是O2在Rubisco的分压(Pa); Kc和Ko分别是O2和CO2的Michaelis-Menten常数; Γ*为CO2补偿点(Pa)。由公式(10)可知, 当其他参数不变时, Ci,t随Jmax的增加而变大。因此, 准确估算Jmax的值对确定Ci,t的值是非常有用的。而模型I显著高估了两种光照条件下大豆叶片的Jmax, 从而导致Ci,t的高估。反过来这又将较大地影响着用FvCB生化模型分段拟合A-Ci曲线时得到的Vcmax、Jmax、TPU、Rd和gm等参数(Miao et al., 2009; Yin et al., 2009; 唐星林等, 2017a)。
模型II较全面地考虑了光合作用的原初反应过程(Ye et al., 2013a, 2013b), 可定量研究与植物光合作用原初反应过程中的激子传递效率和捕光色素分子的参数变化情况以及这些参数对光的响应问题, 并且用其中的参数可以讨论植物的PSII动力学下调(Ralph & Gademann, 2005; Kirchhoff et al., 2007; Brading et al., 2011)。由于模型II较真实地反映出植物光合作用的原初反应过程和电子流的产生, 且是一条存在极值的函数, 由该模型可以得到饱和光强的解析解, 从而可准确地获得植物的PARsat (或Isat)和Jmax (或Anmax)。此外, 叶子飘等(2014)利用模型II研究了山莴苣(Lagedium sibiricum)、一年蓬(Erigeron annuus)和紫菀(Aster tataricus)的光合电子流对光的响应, 不仅得到植物的Jmax、PARsat、初始斜率等参数, 还获得了捕光色素分子有效光能吸收截面和处于最低激发态的捕光色素分子数对光的响应关系。捕光色素分子的这些特性为研究植物的光能吸收、转化和光合电子流的产生等提供了理论依据。胡文海等(2017)利用模型II研究了越冬期荷花玉兰(Magnolia grandiflora)阳生叶和阴生叶PSII和捕光色素分子内禀特性的差异以及产生其差异的原因。因此, 结合叶绿素含量的测定, 模型II为预测和拟合光合电子流对光响应曲线提供了一个有用的数学工具。在本研究中, 模型II不仅可以很好地拟合两种光照条件下大豆叶片的J-I曲线和An-I曲线, 拟合曲线与观测点高度符合, 而且获得的参数与观测点非常接近(图1, 图2; 表1, 表2)。这与其他****的结论(Je?ilová et al., 2015; Mayoral et al., 2015; Park et al., 2016; Bellucco et al., 2017; Quiroz et al., 2017; 王海珍等, 2017)一致。
总之, 模型II能真实地反映出两种光照条件下大豆叶片的光合能力, 利用该模型得到的Jmax和Anmax可以准确地估算植物光呼吸在光保护中的作用, 并可以准确地确定Ci,t值。这为定量研究植物的光合能力和高光强下光呼吸对植物的光保护作用提供了很好的数学工具。
扫码加入读者圈
听语音, 看问答
参考文献 原文顺序
文献年度倒序
文中引用次数倒序
被引期刊影响因子
DOIURLPMID [本文引用: 1]

Abstract The use of chlorophyll fluorescence to monitor photosynthetic performance in algae and plants is now widespread. This review examines how fluorescence parameters can be used to evaluate changes in photosystem II (PSII) photochemistry, linear electron flux, and CO(2) assimilation in vivo, and outlines the theoretical bases for the use of specific fluorescence parameters. Although fluorescence parameters can be measured easily, many potential problems may arise when they are applied to predict changes in photosynthetic performance. In particular, consideration is given to problems associated with accurate estimation of the PSII operating efficiency measured by fluorescence and its relationship with the rates of linear electron flux and CO(2) assimilation. The roles of photochemical and nonphotochemical quenching in the determination of changes in PSII operating efficiency are examined. Finally, applications of fluorescence imaging to studies of photosynthetic heterogeneity and the rapid screening of large numbers of plants for perturbations in photosynthesis and associated metabolism are considered.
DOIURL [本文引用: 2]
Both models can simulate the mean daily trend at monthly and seasonal scales. Modelled data typically fall within the range of variability of the observations (differences of the order of 10%). Additional information improves the models performance, notably the selection of the most vegetated wind direction in Helsinki. The general model performs reasonably well during daytime but it tends to underestimate CO 2 emissions at night. This reflects the model capability to catch photosynthesis processes occurring during the day, and the importance of the gross primary production (GPP) in modifying the net ecosystem exchange (NEE) of urban sites with different vegetation cover fraction. Therefore, the general model does not capture the differences in ecosystem respiration that skew nocturnal fluxes. The relation between the generalised NRH plateau parameter and vegetation cover improves (R 2 from 0.7 to 0.9) when only summer weekends with wind coming from the most vegetated sector in Helsinki and well-watered conditions for Mediterranean sites are included in the analysis. In the local model, the inclusion of a temperature driven equation for estimating the ecosystem respiration instead of a constant value, does not improve the long-term simulations. In conclusion, both the general and local models have significant potential and offer valid modelling options of biogenic components of carbon exchange in urban and non-urban ecosystems.
DOIURL [本文引用: 1]
We investigated the effect of elevated partial pressure of CO2 (pCO2) on the photosynthesis and growth of four phylotypes (ITS2 types A1, A13, A2, and B1) from the genus Symbiodinium, a diverse dinoflagellate group that is important, both free-living and in symbiosis, for the viability of cnidarians and is thus a potentially important model dinoflagellate group. The response of Symbiodinium to an elevated pCO2 was phylotype-specific. Phylotypes A1 and B1 were largely unaffected by a doubling in pCO2; in contrast, the growth rate of A13 and the photosynthetic capacity of A2 both increased by ~ 60. In no case was there an effect of ocean acidification (OA) upon respiration (dark- or light-dependent) for any of the phylotypes examined. Our observations suggest that OA might preferentially select among free-living populations of Symbiodinium, with implications for future symbioses that rely on algal acquisition from the environment (i.e., horizontal transmission). Furthermore, the carbon environment within the host could differentially affect the physiology of different Symbiodinium phylotypes. The range of responses we observed also highlights that the choice of species is an important consideration in OA research and that further investigation across phylogenetic diversity, for both the direction of effect and the underlying mechanism(s) involved, is warranted. 2011, by the American Society of Limnology and Oceanography, Inc.
DOIURLPMID [本文引用: 1]
First page of article
DOIURL [本文引用: 1]
Environmental factors as incident light, temperature and soil water content mainly determine the dynamics of growth and survival of natural forest regeneration in Mediterranean forests. The complex interactions among these factors highlight the need for physiology-based models which describe seedling and sapling performance under current and changing climatic conditions. These models should be flexible enough to take into account the effect of growth light environment changes on physiological processes and, therefore, to assist in the decision-making process on different silvicultural management alternatives under climatic uncertainty. In the present work the net photosynthesic rate of Pinus pinea L. natural regeneration is modeled as a function of light irradiance using the non-rectangular hyperbola function. The model fit was carried out following a two-step procedure, where the parameters of the original function were expanded over the most influential factors: leaf temperature, soil moisture, global site factor and needle type. The developed model allows defining the optimal niche conditions for the natural regeneration of the species and permits identifying the most limiting conditions which prevent natural regeneration. Regeneration niche was assessed by using the model to simulate net CO2 assimilation of a seedling over twelve contrasting light environments during both a normal and an extremely dry vegetative period. The model predicts that the most favorable carbon balance would be found in mid-shaded expositions, while fully exposed plants at midday during summer would exhibit longer periods of negative assimilation rates, especially on severe dry years. (C) 2012 Elsevier B.V. All rights reserved.
DOIURL [本文引用: 2]
DOIURLPMID [本文引用: 1]
Plant photosynthesis channels some of the most highly reactive intermediates in biology, in a way that captures a large fraction of their energy to power the plant. A viable photosynthetic apparatus must not only be efficient and robust machinery, but also well integrated into the plant's biochemical and physiological networks. This requires flexibility in its responses to the dramatically changing environmental conditions and biochemical demands. First, the output of the energy-storing light reactions must match the demands of plant metabolism. Second, regulation of the antenna must be flexible to allow responses to diverse challenges that could result in excess light capture and subsequent photoinhibition. Evidence is presented for the interplay of two types of mechanistic flexibility, one that modulates the relative sensitivity of antenna downregulation to electron flow, and the other, which primarily modulates the output ratio of ATP/NADPH, but also contributes to down-regulation.
DOIURL [本文引用: 1]
Increasing areas of Amazonian forest are coming under flood stress due to dam construction and greater variability in river flood levels due to climate change. The physiological responses of Amazonian trees subjected to flooding are important to understand the consequences of these changes. Irradiance response curves for photosynthesis obtained from ten tropical tree species growing in flooded areas were used to fit three empirical models. The study was done in floodplains along the Uatum River, both upstream and downstream of the Balbina Hydroelectric Dam in Brazil's state of Amazonas (01A degrees 55'S; 59A degrees 28'W). Ten species were studied. Models compared were: non-rectangular hyperbola, rectangular hyperbola, and exponential. All models were quantitatively adequate for fitting the response of measured data on photosynthesis to irradiance for all ten species in the non-flooding and flooding periods. Considerable variation was found among the model estimates of maximum photosynthesis (P (nmax)), dark respiration (R (d)) and apparent quantum yield of photosynthesis (alpha). For photosynthesis, the two hyperbolas overestimated P (nmax) while EXP presented more realistic values. For estimating R (d), RH presented the most realistic values. To avoid unrealistic value estimates of R (d), we recommend adding measured R (d) values to the regressions. The results suggest that the EXP model presented the most realistic P (nmax) and alpha values, and, in spite of less accuracy in fitting photosynthetic irradiance curves than the RH model, it can be recommended for accessing the information used in photosynthetic irradiance curves for the leaves of tropical trees growing in Amazonian floodplains or in areas that are artificially flooded by dams.
DOIURLPMID [本文引用: 4]
090004 The model of Farquhar, von Caemmerer and Berry is the standard in relating photosynthetic carbon assimilation and concentration of intercellular CO 2 . The techniques used in collecting the data from which its parameters are estimated have been the object of extensive optimization, but the statistical aspects of estimation have not received the same attention. 090004 The model segments assimilation into three regions, each modeled by a distinct function. Three parameters of the model, namely the maximum rate of Rubisco carboxylation ( V c max ), the rate of electron transport ( J ), and nonphotorespiratory CO 2 evolution ( R d ), are customarily estimated from gas exchange data through separate fitting of the component functions corresponding to the first two segments. This disjunct approach is problematic in requiring preliminary arbitrary subsetting of data into sets believed to correspond to each region. 090004 It is shown how multiple segments can be estimated simultaneously, using the entire data set, without predetermination of transitions by the investigator. 090004 Investigation of the number of parameters that can be estimated in the two-segment model suggests that, under some conditions, it is possible to estimate four or even five parameters, but that only V c max , J , and R d , have good statistical properties. Practical difficulties and their solutions are reviewed, and software programs are provided.
DOIURL [本文引用: 3]
Using a combination of gas-exchange and chlorophyll fluorescence measurements, low apparent CO 2 /O 2 specificity factors (1300 mol mol 611 ) were estimated for the leaves of two deciduous tree species (Fagus sylvatica and Castanea sativa). These low values contrasted with those estimated for two herbaceous species and were ascribed to a drop in the CO 2 mole fraction between the intercellular airspace (C i ) and the catalytic site of Rubisco (C c ) due to internal resistances to CO 2 transfer. C c . was calculated assuming a specificity of Rubisco value of 2560 mol mol 611 . The drop between C i and C c was used to calculate the internal conductance for CO 2 (g i ). A good correlation between mean values of net CO 2 assimilation rate (A) and g i was observed within a set of data obtained using 13 woody plant species, including our own data. We report that the relative limitation of A, which can be ascribed to internal resistances to CO 2 transfer, was 24–30%. High internal resistances to CO 2 transfer may explain the low apparent maximal rates of carboxylation and electron transport of some woody plant species calculated from A/C i curves.
DOIURLPMID [本文引用: 2]
Abstract Mitochondrial respiration often appears to be inhibited in the light when compared with measurements in the dark. This inhibition is inferred from the response of the net CO2 assimilation rate (A) to absorbed irradiance (I), changing slope around the light compensation point (Ic). We suggest a model that provides a plausible mechanistic explanation of this ok effect. The model uses the mathematical description of photosynthesis developed by Farquhar, von Caemmerer and Berry; it involves no inhibition of respiration rate in the light. We also describe a fitting technique for quantifying the Kok effect at low I. Changes in the chloroplastic CO2 partial pressure (Cc) can explain curvature of A vs I, its diminution in C4 plants and at low oxygen concentrations or high carbon dioxide concentrations in C3 plants, and effects of dark respiration rate and of temperature. It also explains the apparent inhibition of respiration in the light as inferred by the Laisk approach. While there are probably other sources of curvature in A vs I, variation in Cc can largely explain the curvature at low irradiance, and suggests that interpretation of day respiration compared with dark respiration of leaves on the basis of the Kok effect needs reassessment.
DOIURLPMID [本文引用: 3]
Various aspects of the biochemistry of photosynthetic carbon assimilation in C3 plants are integrated into a form compatible with studies of gas exchange in leaves. These aspects include the kinetic properties of ribulose bisphosphate carboxylase-oxygenase; the requirements of the photosynthetic carbon reduction and photorespiratory carbon oxidation cycles for reduced pyridine nucleotides; the dependence of electron transport on photon flux and the presence of a temperature dependent upper limit to electron transport. The measurements of gas exchange with which the model outputs may be compared include those of the temperature and partial pressure of CO2(p(CO2)) dependencies of quantum yield, the variation of compensation point with temperature and partial pressure of O2(p(O2)), the dependence of net CO2 assimilation rate on p(CO2) and irradiance, and the influence of p(CO2) and irradiance on the temperature dependence of assimilation rate.
DOIURLPMID [本文引用: 2]
Abstract In vitro-cultured plants typically show a low photosynthetic activity, which is considered detrimental to subsequent ex vitro acclimatization. Studies conducted so far have approached this problem by analysing the biochemical and photochemical aspects of photosynthesis, while very little attention has been paid to the role of leaf conductance to CO(2) diffusion, which often represents an important constraint to CO(2) assimilation in naturally grown plants. Mesophyll conductance, in particular, has never been determined in in vitro plants, and no information exists as to whether it represents a limitation to carbon assimilation during in vitro growth and subsequent ex vitro acclimatization. In this study, by means of simultaneous gas exchange and chlorophyll fluorescence measurements, the stomatal and mesophyll conductance to CO(2) diffusion were assessed in in vitro-cultured plants of the grapevine rootstock '41B' (Vitis vinifera 'Chasselas'xVitis berlandieri), prior to and after ex vitro acclimatization. Their impact on electron transport rate partitioning and on limitation of potential net assimilation rate was analysed. In vitro plants had a high stomatal conductance, 155 versus 50 mmol m(-2) s(-1) in acclimatized plants, which ensured a higher CO(2) concentration in the chloroplasts, and a 7% higher electron flow to the carbon reduction pathway. The high stomatal conductance was counterbalanced by a low mesophyll conductance, 43 versus 285 mmol m(-2) s(-1), which accounted for a 14.5% estimated relative limitation to photosynthesis against 2.1% estimated in acclimatized plants. It was concluded that mesophyll conductance represents an important limitation for in vitro plant photosynthesis, and that in acclimatization studies the correct comparison of photosynthetic activity between in vitro and acclimatized plants must take into account the contribution of both stomatal and mesophyll conductance.
DOIURLPMID
by Song Gao, Qiaodi Yan, Luxi Chen, Yaobin Song, Junmin Li, Chengxin Fu, Ming DongTo reveal the effects of ploidy level and haplotype on photosynthetic traits, we chose 175 genotypes of wild st ...
DOIURL
DOIURL [本文引用: 2]
[目的]光合作用对UV-B辐射增强的响应对评价粳稻在全球气候变化背景下的适应能力至关重要。本文旨在分析UV-B辐射增强对粳稻剑叶光合作用内在机制的影响。[方法]以北方粳稻品种‘沈农265’为试验材料,采用盆栽形式,试验设对照组CK(采用自然光照射),处理组T1、T2分别在自然光照基础上增加UV-B辐射1.05和2.1 W·m^-2,每个处理重复3或6次。选取粳稻幼苗移栽于无孔试验桶中,紫外灯照射时间为08:00—16:00,阴雨天不进行UV-B处理,直至成熟收获。试验期间对粳稻各生长时期进行剑叶活体测量,测定光合电子流传递分配、光合响应曲线及参数,包括非环式光合电子流中参与碳还原或光呼吸的那一部分电子流Jc、Jo,表观量子效率(AQY),最大净光合速率(P(max))和暗呼吸速率(Rd)的变化特征。[结果]对光合电子传递的影响:UV-B辐射增强在剑叶各个生长期Jc和Jo(非环式电子流中参与光呼吸和碳还原的电子流)均降低,Jo/JF与Jo/Jc(光呼吸所占的比例)均增加,说明UV-B增强降低了光合电子进入碳还原的部分;UV-B处理在剑叶各个生长期也降低了Vo(Rubisco的氧化速率)和Vc(Rubisco的羧化速率),但Vo/Vc呈上升趋势,且与UV-B辐射强度成正比,说明UV-B辐射增强降低了Rubisco(核酮糖-1,5-二磷酸加氧酶)的羧化速率。对光合响应特性的影响:剑叶各生长期在UV-B处理下,CK与T1、T2的光合响应曲线趋势相同,净光合速率(Pn)从大到小的处理为对照组、低剂量UV-B辐射、高剂量辐射;除成熟期,LSP(光饱和点)均降低,在灌浆期降幅最大,除灌浆期,LCP(光补偿点)均上升,在孕穗期升幅最大;AQY总体呈下降趋势;P(max)显著下降,T2对P(max)的抑制程度大于T1;除成熟期,Rd(暗呼吸速率)都呈增加趋势,灌浆期增幅最高。[结论]UV-B辐射增强总体上增加了剑叶光呼吸耗能,降低了光合电子
DOIURLPMID [本文引用: 3]
Current models of C 3 photosynthesis incorporate a phosphate limitation to carboxylation which arises when the capacity for starch and sucrose synthesis fails to match the capacity for the production of triose phosphates in the Calvin cycle. As a result, the release of inorganic phosphate in the chloroplast stroma fails to keep pace with its rate of sequestration into triose phosphate, and phosphate becomes limiting to photosynthesis. Such a model predicts that when phosphate is limiting, assimilation becomes insensitive to both CO 2 and O 2 , and is thus incapable of explaining the experimental observation that assimilation, under phosphate-limited conditions, frequently exhibits reversed sensitivity to both CO 2 and O 2 , i.e., increasing O 2 stimulates assimilation and increasing CO 2 inhibits assimilation. We propose a model which explains reversed sensitivity to CO 2 and O 2 by invoking the net release of phosphate in the photorespiratory oxidation cycle. In order for this to occur, some fraction of the glycollate carbon which leaves the stroma and which is recycled to the chloroplast by the photorespiratory pathway as glycerate must remain in the cytosol, perhaps in the form of amino acids. In that case, phosphate normally used in the stromal glycerate kinase reaction to generate PGA from glycerate is made available for photophosphorylation, stimulating RuBP regeneration and assimilation. The model is parameterized for data obtained on soybean and cotton, and model behavior in response to CO 2 , O 2 , and light is demonstrated.
URL
捕光色素分子的内禀特性不仅决定了光能的吸收与传递,也将影响到激发能向光化学反应、热耗散和叶绿素荧光的分配。本文采用叶绿素荧光技术和光合电子流对光响应机理模型,研究了越冬期广玉兰(Magnolia grandiflora)阳生叶和阴生叶两种不同光环境下叶片PSⅡ功能及其捕光色素分子内禀特性的差异,以探索广玉兰越冬的光保护策略。结果表明:越冬期低温导致叶片轻微光抑制的发生,全光照加剧了阳生叶光抑制程度,而弱光环境有利于阴生叶光抑制的恢复。阳生叶可通过降低叶绿素含量和捕光色素分子数量以减少对光能的吸收,并且具有较强的光化学和热耗散能力以保护光合机构免受低温强光伤害。而阴生叶虽然其光化学反应能力相对较弱,但具有较强的热耗散能力,可有效地保护其免受短时曝露在强光下的伤害。
DOIURL [本文引用: 2]
Abstract To elucidate the mechanisms of the adaptive advantages of polyploidy, there is a need to identify physiological traits that participate in the success of polyploids. We studied selected photosynthetic characteristics, stomatal density, and specific leaf area of three ploidy levels (2 n =4 x , 5 x , 6 x ) of the geophyte Allium oleraceum that partially differ in their ecological niches. Although the cytotypes were on average similar with regard to most of the measured photosynthetic traits, the hexaploids showed more rapid initial photosynthetic induction and a tendency for a higher maximum photosynthetic rate per unit area. The stomatal density was not affected by ploidy, though the specific leaf area was reduced for the hexaploids compared to the other cytotypes. A lower intracytotype variation was found for most of the studied photosynthetic and anatomical traits for the hexaploids compared to the large variation found within other cytotypes. A comparison of the photosynthetic traits between the cytotypes showed that the ecological differentiation between cytotypes is only weakly related to the characteristics of their photosynthetic apparatus. However, contrasting ranges of variability in the measured traits between the cytotypes can be related to previously observed differences between cytotypes with regard to the ranges of intracytotype genetic variation, genome size variation, and niche breadth. A higher variability of photosynthetic traits in tetraploids and pentaploids may be related to the existence of a spectrum of types adapted to different environmental conditions. Hexaploids may represent a recently formed cytotype adapted to open environmental conditions.
DOIURL [本文引用: 2]
光合电子流分配是植物光合控制的一个重要环节。然而,传统电子流分配的计算方法存在诸多问题尚未引起人们的注意,如:(1)低估了光呼吸每释放一个CO2分子所消耗的电子数;(2)混淆了相对电子传递速率和绝对电子传递速率;(3)忽略了除碳同化和光呼吸外的其他电子流分配途径;(4)难以准确获取光下暗呼吸速率值,从而导致碳同化电子流(Jc)及光呼吸速率(R。)的不准确估算等。以小麦和大豆气体交换与荧光同步测量数据为例,结果表明大豆电子传递速率与碳同化两者对光强的响应一致性较好,同时达到最大值;而小麦的一致性相对较差,说明电子传递速率和碳同化并非完全一致,推测认为有可能与作物对同化产物输出的模式不同有关。通过光呼吸速率换算出的电子流(12×Rp)与实际测量电子流(△J0)之间存在较大的差异;另外,传统方法估算出的光呼吸速率(估算值)与光呼吸测量值之间也存在较大差异,分析认为这主要是由于绝对光合速率与相对电子传递速率之间差异造成。
DOIURL [本文引用: 1]
URL [本文引用: 1]
以上海荷花品种‘伯里夫人’为试验材料,设置全光照和林下遮荫(50%全光照)2种不同的光照环境,采用4种光响应模型拟合分析荷花叶片净光合速率光响应过程,比较不同光照下适宜的光响应模型,研究荷花品种对遮荫环境的适应规律。结果表明:4种模型对荷花叶片光合作用光响应过程拟合效果的优劣顺序为:直角双曲线修正模型〉指数模型〉非直角双曲线模型〉直角双曲线模型,后3种模型均为没有极值的函数,不能直接求得最大净光合速率(Pn max)和光饱和点(LSP).直角双曲线修正模型对LSP、Pn max、暗呼吸速率(Rd)和光补偿点(LCP)等光响应参数表现出最佳的拟合效果,拟合值与实测值相对误差最小。随光强减弱,荷花主要的光合生理参数均降低,其中,Rd下降幅度显著,其他参数变化不显著。说明荷花对适度弱光环境具备一定的适应能力,表现出良好的光合适应性反应与调节,能够维持植株的正常生长。
DOIURLPMID [本文引用: 2]
Abstract Melatonin is involved in the regulation of carbohydrate metabolism and induction of cold tolerance in plants. The objective of this study was to investigate the roles of melatonin in modulation of carbon assimilation of wild type wheat and the Chl b-deficient mutant ANK32B in response to elevated CO 2 concentration ([CO 2 ]) and the transgenerational effects of application of exogenous melatonin (hereafter identified as melatonin priming) on the cold tolerance in offspring. The results showed that the melatonin priming enhanced the carbon assimilation in ANK32B under elevated [CO 2 ], via boosting the activities of ATPase and sucrose synthesis and maintaining a relatively higher level of total chlorophyll concentration in leaves. In addition, melatonin priming in maternal plants at grain filling promoted the seed germination in offspring by accelerating the starch degradation, and improved the cold tolerance of seedlings through activating the antioxidant enzymes and enhancing the photosynthetic electron transport efficiency. These findings suggest the important roles of melatonin in plant response to future climate change, indicating that the melatonin priming at grain filling in maternal plants could be an effective approach to improve cold tolerance of wheat offspring at seedling stage. This article is protected by copyright. All rights reserved. This article is protected by copyright. All rights reserved.
DOIURLPMID [本文引用: 2]
Background Botrytis cinerea Pers. Fr. is an important pathogen causing stem rot in tomatoes grown indoors for extended periods. MicroRNAs (miRNAs) have been reported as gene expression regulators related to several stress responses and B. cinerea infection in tomato. However, the function of miRNAs in the resistance to B. cinerea remains unclear.ResultsThe miRNA expression patterns in tomato in response to B. cinerea stress were investigated by high-throughput sequencing. In total, 143 known miRNAs and seven novel miRNAs were identified and their corresponding expression was detected in mock- and B. cinerea-inoculated leaves. Among those, one novel and 57 known miRNAs were differentially expressed in B. cinerea-infected leaves, and 8 of these were further confirmed by quantitative reverse-transcription PCR (qRT-PCR). Moreover, five of these eight differentially expressed miRNAs could hit 10 coding sequences (CDSs) via CleaveLand pipeline and psRNAtarget program. In addition, qRT-PCR revealed that four targets were negatively correlated with their corresponding miRNAs (miR319, miR394, and miRn1).ConclusionResults of sRNA high-throughput sequencing revealed that the upregulation of miRNAs may be implicated in the mechanism by which tomato respond to B. cinerea stress. Analysis of the expression profiles of B. cinerea-responsive miRNAs and their targets strongly suggested that miR319, miR394, and miRn1 may be involved in the tomato leaves? response to B. cinerea infection.
DOIURL [本文引用: 1]
由Farquhar、von Caemmerer和Berry提出的生物化学光合模型(以下简称FvCB模型)是一个基于光合碳反应过程的CO_2响应模型。此模型认为C3植物叶片光合速率(A)由3个生物化学过程速率中的最低者——核酮糖-1,5-双磷酸羧化酶/加氧酶(Rubisco)所能支持的羧化速率、电子传递所能支持的核酮糖-1,5-双磷酸(Ru BP)再生速率和磷酸丙糖(TP)利用速率决定。利用改进的FvCB模型对光合速率-胞间CO_2浓度(A-C_i)曲线进行拟合,能有效地估计最大羧化速率、最大电子传递速率、TP利用速率、明呼吸速率、叶肉细胞导度等生化参数,促进我们对植物光合生理及其响应环境变化的理解和预测。该文首先详细地描述了FvCB模型,并分析了此模型分段性和过参数化的特点。然后介绍利用FvCB模型对A-C_i曲线进行拟合,从而估计叶片光合生化参数的研究进展。光合生化参数估计经历了主观分段、分段拟合到客观分段、整体拟合几个阶段,目标函数的最小化方法也从传统的最小二乘法为主转向基于现代计算机技术的迭代算法(如遗传算法、模拟退火算法)。然而,如要进一步提高参数估计的可靠性和精确性,还需加强Rubisco动力学属性和温度依赖性方面的研究。最后,为了获取能更有效地进行参数估计的光合数据,根据目前对FvCB模型拟合的认知,整合并改进了A-C_i曲线的测定方法。
DOIURLPMID [本文引用: 3]
The principles, equipment and procedures for measuring leaf and canopy gas exchange have been described previously as has chlorophyll fluorescence. Simultaneous measurement of the responses of leaf gas exchange and modulated chlorophyll fluorescence to light and CO2 concentration now provide a means to determine a wide range of key biochemical and biophysical limitations on photosynthesis in vivo. Here the mathematical frameworks and practical procedures for determining these parameters in vivo are consolidated. Leaf CO2 uptake (A) versus intercellular CO2 concentration (Ci) curves may now be routinely obtained from commercial gas exchange systems. The potential pitfalls, and means to avoid these, are examined. Calculation of in vivo maximum rates of ribulose-1,5-bisphosphate (RuBP) carboxylase/oxygenase (Rubisco) carboxylation (VC,max), electron transport driving regeneration of RuBP (Jmax), and triose-phosphate utilization (VTPU) are explained; these three parameters are now widely assumed to represent the major limitations to light-saturated photosynthesis. Precision in determining these in intact leaves is improved by the simultaneous measurement of electron transport via modulated chlorophyll fluorescence. The A/Ci response also provides a simple practical method for quantifying the limitation that stomata impose on CO2 assimilation. Determining the rate of photorespiratory release of oxygen (Rl) has previously only been possible by isotopic methods, now, by combining gas exchange and fluorescence measurements, Rl may be determined simply and routinely in the field. The physical diffusion of CO2 from the intercellular air space to the site of Rubisco in C3 leaves has long been suspected of being a limitation on photosynthesis, but it has commonly been ignored because of the lack of a practical method for its determination. Again combining gas exchange and fluorescence provides a means to determine mesophyll conductance. This method is described and provides insights into the magnitude and basis of this limitation.
DOIURL [本文引用: 2]
The composition of Mediterranean forests is expected to vary with ongoing changes in climate and land use. To gain a clearer understanding of the response to global change of growth and survival during regeneration it is necessary to take a closer look at the ecophysiological traits underlying seedling performance. Gas exchange, leaf water potential, chlorophyll fluorescence, soil moisture, temperature and global site factor were measured over 1/year in naturally regenerated young trees of three coexisting species ( Pinus pinea , Quercus ilex and Juniperus oxycedrus ) in two stands of different density. We modelled the photosynthetic response of plants to micro-climatic conditions via the parameterization of the non-rectangular hyperbolic model of photosynthesis, which relates gross photosynthesis to incident light through three biochemical parameters, and the subsequent expansion of these parameters as a function of environmental variables (light environment, soil moisture and temperature). We investigated the relationship between different photosynthetic performance and the species-specific strategies to cope with stress (stress tolerant or avoiders). The optimal light environment, defined through the global site factor (GSF), and the regeneration niche to maximize carbon assimilation differed between the three species. P. pinea showed high sensitivity to water availability in agreement with a drought avoidance strategy, attaining the maximum photosynthetic capacity of the three species following the spring rainfall. Q. ilex was the most thermophilic and light-demanding of the species. Under high light conditions, J. oxycedrus was more drought tolerant and displayed higher net CO 2 assimilation than P. pinea over the course of a growing period. Optimal locations for P. pinea regeneration are below-crown environments, while for J. oxycedrus regeneration the optimal locations are open gaps. Q. ilex regeneration occupy open gaps where the other two species are unable to establish themselves because of excessive light, temperature or very low water availability. Competition between species will occur under a canopy gap fraction of 0.5. Higher GSF values will exclusively favour the regeneration of Q. ilex .
[本文引用: 4]
DOIURLPMID [本文引用: 1]
All photosynthetic organisms need to regulate light harvesting for photoprotection. Three types of flexible non-photochemical quenching (NPQ) mechanisms have been characterized in oxygenic photosynthetic cyanobacteria, algae, and plants: OCP-, LHCSR-, and PSBS-dependent NPQ. OCP-dependent NPQ likely evolved first, to quench excess excitation in the phycobilisome (PB) antenna of cyanobacteria. During evolution of eukaryotic algae, PBs were lost in the green and secondary red plastid lineages, while three-helix light-harvesting complex (LHC) antenna proteins diversified, including LHCSR proteins that function in dissipating excess energy rather than light harvesting. PSBS, an independently evolved member of the LHC protein superfamily, seems to have appeared exclusively in the green lineage, acquired a function as a pH sensor that turns on NPQ, and eventually replaced LHCSR in vascular plants.
DOIURL [本文引用: 2]
For the production of plants in controlled environments such as greenhouses and plant factories, crop modeling and simulations are effective tools for configuring the optimal growth environment. The objective of this study was to develop a coupled photosynthetic model of sweet basil ( Ocimum basilicum L.) reflecting plant factory conditions. Light response curves were generated using photosynthetic models such as negative exponential, rectangular hyperbola, and non-rectangular hyperbola functions. The light saturation and compensation points determined by regression analysis of light curves using modified non-rectangular hyperbola function in sweet basil leaves were 545.3 and 26.5 08mol·m -2 ·s -1 , respectively. The non-rectangular hyperbola was the most accurate with complicated parameters, whereas the negative exponential was more accurate than the rectangular hyperbola and could more easily acquire the parameters of the light response curves of sweet basil compared to the non-rectangular hyperbola. The CO 2 saturation and compensation points determined by regression analysis of the A-C i curve were 728.8 and 85.1 08mol·mol -1 , respectively. A coupled biochemical model of photosynthesis was adopted to simultaneously predict the photosynthesis, stomatal conductance, transpiration, and temperature of sweet basil leaves. The photosynthetic parameters, maximum carboxylation rate, potential rate of electron transport, and rate of triose phosphate utilization determined by Sharkey’s regression method were 102.6, 117.7, and 7.4 08mol·m -2 ·s -1 , respectively. Although the A-C i regression curve of the negative exponential had higher accuracy than the biochemical model, the coupled biochemical model enable to physiologically explain the photosynthesis of sweet basil leaves.
DOIURL [本文引用: 2]
Data acquisition for parameterization is one of the most important limitations for the use of potato crop growth models. Non-destructive techniques such as remote sensing for gathering required data could circumvent this limitation. Our goal was to analyze the effects of incorporating ground-based spectral canopy reflectance data into two light interception models with different complexity. A dynamic- hourly scale- canopy photosynthesis model (DCPM), based on a non-rectangular hyperbola applied to sunlit and shaded leaf layers and considering carbon losses by respiration, was implemented (complex model). Parameters included the light extinction coefficient, the proportion of light transmitted by leaves, the fraction of incident diffuse photosynthetically active radiation and leaf area index. On the other hand, a simple crop growth model (CGM) based on daily scale of light interception, light use efficiency (LUE) and harvest index was parameterized using either canopy cover (CGMCC) or the weighted difference vegetation index (CGMWDVI). A spectroradiometer, a chlorophyll meter and a multispectral camera were used to derive the required parameters. CGMWDVIimproved yield prediction compared to CGMCC. Both CGMWDVIand DCPM showed high degree of accuracy in the yield prediction. Since largeLUEvariations were detected depending on the diffuse component of radiation, the improvement of simple CGM using remotely sensed data is contingent on an appropriateLUEestimation. Our study suggests that the incorporation of remotely sensed data in models with different temporal resolution and level of complexity improves yield prediction in potato.
DOIURL [本文引用: 1]
Rapid light curves provide detailed information on the saturation characteristics of electron transport, as well as the overall photosynthetic performance of a plant. Rapid light curves were collected from samples of Zostera marina grown under low and high-light conditions (50 and 300 μmol photons m 612 s 611) and the distinctive patterns of RLC parameters are discussed, in terms of differential sink capacity and PSII reaction centre closure. Derived cardinal points of a rapid light curve ( α, E k and rETR max) describe the photosynthetic capacity of a seagrass leaf, its light adaptation state and its capacity to tolerate short-term changes in light. The shapes of the corresponding F and F ′ m curves also provide information on the development of the trans-thylakoid proton gradient and thermal energy dissipation. Low-light leaves showed limited photosynthetic capacity and reduced activity of non-photochemical quenching pathways, whereas photosynthesis of high light leaves were not limited and showed an elevated level of non-photochemical quenching, possibly associated with xanthophyll cycle activity. Light-dark kinetics are also discussed in relation to relaxation of non-photochemical quenching and its various components. A curve fitting model is recommended based on the double exponential decay function. In this paper, we explain the fundamental aspects of a RLC, describe how it reflects the response to light exposure of a leaf, how to interpret these curves, and how to quantitatively describe and compare RLCs.
DOIURLPMID [本文引用: 2]
Light-response curves (LCs) of chlorophyll fluorescence are widely used in plant physiology. Most commonly, LCs are generated sequentially, exposing the same sample to a sequence of distinct actinic light intensities. These measurements are not independent, as the response to each new light level is affected by the light exposure history experienced during previous steps of the LC, an issue particularly relevant in the case of the popular rapid light curves. In this work, we demonstrate the proof of concept of a new method for the rapid generation of LCs from nonsequential, temporally independent fluorescence measurements. The method is based on the combined use of sample illumination with digitally controlled, spatially separated beams of actinic light and a fluorescence imaging system. It allows the generation of a whole LC, including a large number of actinic light steps and adequate replication, within the time required for a single measurement (and therefore named "single-pulse light curve"). This method is illustrated for the generation of LCs of photosystem II quantum yield, relative electron transport rate, and nonphotochemical quenching on intact plant leaves exhibiting distinct light responses. This approach makes it also possible to easily characterize the integrated dynamic light response of a sample by combining the measurement of LCs (actinic light intensity is varied while measuring time is fixed) with induction/relaxation kinetics (actinic light intensity is fixed and the response is followed over time), describing both how the response to light varies with time and how the response kinetics varies with light intensity.
DOIURL [本文引用: 2]
Abstract The effects of temperature and light on photosynthetic, chlorophyll fluorescence characteristics under high temperature in the passion fruits ‘Summer Queen’ (P. edulis × P. edulis f. flavicarpa) and ‘Ruby Star’ (P. edulis × P. edulis f. flavicarpa) were examined. Photosynthetic rates of both cultivars markedly and linearly increased up to 300 μmol·m6305·s6301, and less markedly increased from 300 to 1500 μmol·m6305·s6301 under several light conditions. Their light saturation points were recorded at around 1200 μmol·m6305·s6301 photosynthetic photon flux densities (PPFD). Regarding the relationship between temperature and photosynthesis, the maximum value of the apparent photosynthetic rate of ‘Summer Queen’ was observed at 30°C, and it was lower at both lower and higher temperatures. In ‘Ruby Star’, on the other hand, the maximum value was observed at 20 to 30°C, and this decreased at 35 and 40°C. The gross photosynthetic rate of ‘Summer Queen’ decreased over 30°C whereas in ‘Ruby Star’, it decreased to a lesser extent. The transpiration rate of ‘Ruby Star’ was higher than that of ‘Summer Queen’ at 40°C. Dark respiration increased from 20 to 40°C in both cultivars. Concerning chlorophyll fluorescence characteristics, ‘Summer Queen’ showed high-temperature injury at 40°C and all parameters were significantly decreased at 45°C. On the other hand, Fv/Fm showed only a slight decrease at 45°C in ‘Ruby Star’. These results indicate that ‘Summer Queen’ is susceptible to heat stress and that the range of its optimal temperature for photosynthesis is lower than ‘Ruby Star’.
DOIURLPMID [本文引用: 1]
1. An optical system is described which furnishes an intensity of 282,000 meter candles at the bottom of a Warburg manometric vessel. With such a high intensity available it was possible to measure the rate of photosynthesis of single fronds ofCabomba carolinianaover a large range of intensities and CO2concentrations. 2. The data obtained are described with high precision by the equationKI = p/(p2max.2)wherepis the rate of photosynthesis at light intensityI, Kis a constant which locates the curve on theIaxis, andpmax.is the asymptotic maximum rate of photosynthesis. With CO2concentration substituted forI, this equation describes the data of photosynthesis forCabomba, as a function of CO2concentration. 3. The above equation also describes the data obtained by other investigators for photosynthesis as a function of intensity, and of CO2concentration where external diffusion rate is not the limiting factor. This shows that for different species of green plants there is a fundamental similarity in kinetic properties and therefore probably in chemical mechanism. 4. A derivation of the above equation can be made in terms of half-order photochemical and Blackman reactions, with intensity and CO2concentration entering as the first power, or if both sides of the equation are squared, the photochemical and Blackman reactions are first order and intensity and CO2enter as the square. The presence of fractional exponents or intensity as the square suggests a complex reaction mechanism involving more than one photochemical reaction. This is consistent with the requirement of 4 quanta for the reduction of a CO2molecule.
DOIURL [本文引用: 2]
The Farquhar–von Caemmerer–Berry (FvCB) model of photosynthesis has been widely used to estimate the photosynthetic C flux of plants under different growth conditions. However, the seasonal fluctuation of some photosynthesis parameters (e.g. the maximum carboxylation rate of Rubisco (Vcmax), the maximum electron transport rate (Jmax) and internal mesophyll conductance to CO2 transport (gm)) is not considered in the FvCB model. In this study, we investigated the patterns of the FvCB parameters during flag leaf development based on measured photosynthesis–intercellular CO2 curves in two cultivars of winter wheat (Triticum aestivum L.). Parameterised seasonal patterns of photosynthesis parameters in the FvCB model have subsequently been applied in order to predict the photosynthesis of flag leaves. The results indicate that the Gaussian curve characterises the dynamic patterns of Vcmax, Jmax and gm well. Compared with the model with fixed photosynthesis parameter values, updating the FvCB model by considering seasonal changes in Vcmax and Jmax during flag leaf development slightly improved predictions of photosynthesis. However, if the updated FvCB model incorporated the seasonal patterns of Vcmax and Jmax, and also of gm, predictions of photosynthesis was improved a lot, matching well with the measurements (R265=650.87, P65<650.0001). This suggests that the dynamics of photosynthesis parameters, particularly gm, play an important role in estimating the photosynthesis rate of winter wheat.
DOIURLPMID [本文引用: 2]
Sunlight damages photosynthetic machinery, primarily photosystem II (PSII), and causes photoinhibition that can limit plant photosynthetic activity, growth and productivity. The extent of photoinhibition is associated with a balance between the rate of photodamage and its repair. Recent studies have shown that light absorption by the manganese cluster in the oxygen-evolving complex of PSII causes primary photodamage, whereas excess light absorbed by light-harvesting complexes acts to cause inhibition of the PSII repair process chiefly through the generation of reactive oxygen species. As we review here, PSII photodamage and the inhibition of repair are therefore alleviated by photoprotection mechanisms associated with avoiding light absorption by the manganese cluster and successfully consuming or dissipating the light energy absorbed by photosynthetic pigments, respectively.
[本文引用: 4]
[本文引用: 4]
[本文引用: 3]
[本文引用: 3]
[本文引用: 1]
DOIURL [本文引用: 3]
Diurnal time courses of net CO 2 assimilation rates, stomatal conductance and light-driven electron fluxes were measured in situ on attached leaves of 30-year-old Turkey oak trees ( Quercus cerris L.) under natural summer conditions in central Italy. Combined measurements of gas exchange and chlorophyll a fluorescence under low O 2 concentrations allowed the demonstration of a linear relationship between the photochemical efficiency of PSII (fluorescence measurements) and the apparent quantum yield of gross photosynthesis (gas exchange). This relationship was used under normal O 2 to compute total light-driven electron fluxes, and to partition them into fractions used for RuBP carboxylation or RuBP oxygenation. This procedure also yielded an indirect estimate of the rate of photorespiration in vivo . The time courses of light-driven electron flow, net CO 2 assimilation and photorespiration paralleled that of photosynthetic photon flux density, with important afternoon deviations as soon as a severe drought stress occurred, whereas photochemical efficiency and maximal fluorescence underwent large but reversible diurnal decreases. The latter observation indicated the occurrence of a large non-photochemical energy dissipation at PSII. We estimated that less than 60% of the total photosynthetic electron flow was used for carbon assimilation at midday, while about 40% was devoted to photorespiration. The rate of carbon loss by photorespiration ( R 1 ) reached mean levels of 56% of net assimilation rates. The potential application of this technique to analysis of the relative contributions of thermal de-excitation at PSII and photorespiratory carbon recycling in the protection of photosynthesis against stress effects is discussed.
[本文引用: 4]
DOIURLPMID [本文引用: 1]
In the challenge to increase photosynthetic rate per leaf area mathematical models of photosynthesis can be used to help interpret gas exchange measurements made under different environmental conditions and predict underlying photosynthetic biochemistry. To do this successfully it is important to improve the modelling of temperature dependencies of CO2 assimilation and gain better understanding of internal CO2 diffusion limitations. Despite these shortcomings steady-state models of photosynthesis provide simple easy to use tools for thought experiments to explore photosynthetic pathway changes such as redirecting photorespiratory CO2, inserting bicarbonate pumps into C-3 chloroplasts or inserting C-4 photosynthesis into rice. Here a number of models derived from the C-3 model by Farquhar, von Caemmerer and Berry are discussed and compared.
DOIURL [本文引用: 3]
DOIURL [本文引用: 2]
以塔里木干旱荒漠区2年生胡杨幼苗为试材,盆栽模拟荒漠生境5种水分梯度,利用Li-6400便携式光合作用系统测定胡杨在干旱胁迫下光合作用的光响应过程,并采用4种光响应模型对其进行拟合与比较,以期优选出适用于干旱荒漠环境的光响应模型,阐明胡杨光合作用对干旱胁迫的响应规律与适应机制。结果表明:胡杨净光合速率(Pn)随干旱胁迫加剧呈下降趋势,同一光强(PAR)下Pn降幅增大。中度干旱胁迫以下(土壤相对含水量,RSWC〉45%)胡杨在高PAR下仍能维持相对较高Pn,光抑制程度轻;直角双曲线、非直角双曲线和指数模型均可较好地模拟Pn-PAR响应过程,但最大净光合速率(P(nmax))、光饱和点(LSP)拟合值与实测值差异极显著(P〈0.01)。中度干旱胁迫以上(RSWC〈45%)胡杨Pn随PAR升高而显著下降,LSP与P(nmax)极显著降低,光抑制现象明显;仅直角双曲线修正模型拟合的胡杨光响应过程、光响应参数与实际情况较吻合。4种模型模拟效果顺序:直角双曲线修正模型〉指数模型〉非直角双曲线模型〉直角双曲线模型。4种光响应模型对干旱胁迫具有不同的适应性,直角双曲线修正模型适用于各种水分条件,尤其适用于干旱荒漠生境,其它3种模型适用于水分条件较好的生境。光响应特征参数对干旱胁迫的响应阈值不同。随干旱胁迫加剧,胡杨表观量子效率(AQY)、Pn、LSP与P(nmax)持续降低,严重干旱胁迫下暗呼吸速率(Rd)、LCP反而明显增大。RSWC〉45%胡杨仍能保持较高的AQY、P(nmax)、LSP,RSWC〈45%其P(nmax)、LSP显著降低,干旱胁迫显著抑制了胡杨光合进程和光强耐受范围,降低了光合效率,严重干旱胁迫严重影响胡杨苗木的正常生长和光合作用。干旱荒漠环境下,胡杨采取缩窄光照生态幅、降低光能利用率和减少呼吸消耗来积极抵御荒漠干旱逆境伤害的生17
DOIURL [本文引用: 1]
以黄河三角洲贝壳堤岛3年生杠柳(Periploca sepium)苗木为试验材料,模拟设置贝壳砂生境下的4种水分梯度,利用CIRAS-2型光合作用系统测定杠柳叶片在不同干旱胁迫下的光合作用光响应过 程,采用4种光响应模型进行拟合分析,以比较贝壳砂生境干旱胁迫下适宜的光响应模型,探讨最佳光响应模型参数对干旱胁迫的适应规律.结果表明:4种模型对 杠柳叶片光合作用光响应过程拟合效果的优劣顺序为:直角双曲线修正模型>非直角双曲线模型>指数模型>直角双曲线模型,后3种模型均为没有极值的函数,故 不能很好地拟合光响应曲线光抑制过程,并不能直接求解最大净光合速率(Pnmax)和光饱和点(LSP).光响应参数拟合效果最佳表现为:非直角双曲线模 型的暗呼吸速率(Rd),直角双曲线模型的光补偿点(LCP),直角双曲线修正模型的Pnmax和LSP.4种光响应模型对干旱胁迫具有不同的适应性,直 角双曲线修正模型适应各种水分条件,直角双曲线模型和指数模型较适合轻度干旱胁迫条件,非直角双曲线模型较适合重度干旱胁迫条件.随干旱胁迫的加剧,光响 应参数表观量子效率(AQY)、Rd和LCP先升高后下降,净光合速率(Pn)、Pnmax和LSP逐渐下降.轻度、中度和重度干旱胁迫下,LSP分别比 对照下降5.2%、16.3%和34.5%,Pnmax分别比对照下降17.8%、39.0%和59.0%.水分充足条件下,杠柳叶片光能利用最强,光照 生态幅最宽;重度干旱胁迫下,杠柳叶片表现出明显的光饱和、光抑制现象,光能利用减弱,光合能力受到较大限制.
DOIURL [本文引用: 1]
DOIURL [本文引用: 1]
The calculated maximum net photosynthetic rate ( P N ) at saturation irradiance ( I m ) of 1 314.13 08mol m 612 s 611 was 25.49 08mol(CO 2 ) m 612 s 611 , and intrinsic quantum yield at zero irradiance was 0.103. The results fitted by nonrectangular hyperbolic model, rectangular hyperbolic method, binomial regression method, and the new model were compared. The maximum P N values calculated by nonrectangular hyperbolic model and rectangular hyperbolic model were higher than the measured values, and the I m calculated by nonrectangular hyperbolic model and rectangular hyperbolic model were less than measured values. Results fitted by new model showed that the response curve of P N to I was nonlinear at low I for Oryza sativa , P N increased nonlinearly with I below saturation value. Above this value, P N decreased nonlinearly with I .
DOIURL [本文引用: 1]
AimsMethodsImportant findings (1) The mechanistic model of light-response of photosynthetic electron flow not only well described the light-response curves of photosynthetic electron flow in L. sibiricum, E. annuus and A. tataricus, but also obtained some key photosynthetic parameters, e.g. maximum photosynthetic electron flow, saturation irradiance and initial slope of the light-response curve; the fitted photosynthetic parameters were similar to the measured values. (2) The effective light absorption cross-section of light-harvesting pigment molecules quickly decreased with increasing irradiance in L. sibiricum, and showed slowest rate of decrease in E. annuus. (3) The light-harvesting pigment molecules in the lowest excited state increased most rapidly with increasing irradiance in L. sibiricum, and most slowly in E. annuus. In conclusion, compelling evidence indicates that decrease in effective absorption cross-section and increase in the number of light-harvesting pigments in the lowest excited state would reduce light energy absorption.
DOIURLPMID [本文引用: 3]
Models describing the light response of photosynthetic electron transport rate (ETR) are routinely used to determine how light absorption influences energy, reducing power and yields of primary produc
DOIURLPMID [本文引用: 5]
A new mechanistic model of the photosynthesis090009light response is developed based on photosynthetic electron transport via photosystem II (PSII) to specifically describe light-harvesting characteristics and associated biophysical parameters of photosynthetic pigment molecules. This model parameterizes 090004core090005 characteristics not only of the light response but also of difficult to measure physical parameters of photosynthetic pigment molecules in plants.Application of the model to two C3 and two C4 species grown under the same conditions demonstrated that the model reproduced extremely well (r2 > 0.992) the light response trends of both electron transport and CO2 uptake.In all cases, the effective absorption cross-section of photosynthetic pigment molecules decreased with increasing light intensity, demonstrating novel operation of a key mechanism for plants to avoid high light damage.In parameterizing these previously difficult to measure characteristics of light harvesting in higher plants, the model provides a new means to understand the mechanistic processes underpinning variability of CO2 uptake, for example, photosynthetic down-regulation or reversible photoinhibition induced by high light and photoprotection. However, an important next step is validating this parameterization, possibly through application to less structurally complex organisms such as single-celled algae.
[本文引用: 1]
Chlorophyll fluorescence: A probe of photosynthesis in vivo
1
2008
... 2013年, Ye等(
Modelling the biogenic CO2 exchange in urban and non-urban ecosystems through the assessment of light-response curve parameters
2
2017
... 生化模型由描述Rubisco酶活性限制、RuBP再生限制和磷酸丙糖利用率(TPU)限制等3个过程的子模型构成.其中非直角双曲线模型(简称模型I)是生化模型的主要子模型(
... 模型II较全面地考虑了光合作用的原初反应过程(
Differential effects of ocean acidification on growth and photosynthesis among phylotypes of Symbiodinium (Dinophyceae)
1
2011
... 模型II较全面地考虑了光合作用的原初反应过程(
Reporting estimates of maximum potential electron transport rate
1
2015
... 利用模型I拟合J-I曲线可以得到Jmax, 然而, 由于模型I是一渐近线, 所以, 该模型不能很好地拟合植物存在PSII动力学下调或光抑制的J-I曲线.
Modeling the environmental response of leaf net photosynthesis in Pinus pinea L. natural regeneration
1
2013
... 生化模型由描述Rubisco酶活性限制、RuBP再生限制和磷酸丙糖利用率(TPU)限制等3个过程的子模型构成.其中非直角双曲线模型(简称模型I)是生化模型的主要子模型(
The relationship between photosystem II efficiency and quantum yield for CO2 assimilation is not affected by nitrogen content in apple leaves
2
2001
... 生化模型由描述Rubisco酶活性限制、RuBP再生限制和磷酸丙糖利用率(TPU)限制等3个过程的子模型构成.其中非直角双曲线模型(简称模型I)是生化模型的主要子模型(
... 在FvCB生化模型中, Jmax是研究植物发生核酮糖1,5-二磷酸(RuBP)再生速率限制阶段的一个关键参数, 由此参数并结合光合作用对CO2响应曲线就可以确定在光合作用过程中植物叶片从核酮糖-1,5-二磷酸羧化酶/加氧酶(Rubisco酶)活性限制阶段过渡到RuBP再生速率限制阶段的胞间CO2浓度(Ci,t)的值(
Plasticity in light reactions of photosynthesis for energy production and photoprotection
1
2005
... 准确估算植物叶片的Jmax对研究植物叶片光呼吸过程在光保护中的作用是非常必要的(
Measuring the impact of flooding on Amazonian trees: Photosynthetic response models for ten species flooded by hydroelectric dams
1
2013
... 生化模型由描述Rubisco酶活性限制、RuBP再生限制和磷酸丙糖利用率(TPU)限制等3个过程的子模型构成.其中非直角双曲线模型(简称模型I)是生化模型的主要子模型(
Optimizing the statistical estimation of the parameters of the Farquhar-von Caemmerer-Berry model of photosynthesis
4
2007
... 植物的光合作用受光强、CO2浓度和温度等环境因子的影响.
... 生化模型由描述Rubisco酶活性限制、RuBP再生限制和磷酸丙糖利用率(TPU)限制等3个过程的子模型构成.其中非直角双曲线模型(简称模型I)是生化模型的主要子模型(
... 在FvCB生化模型中, Jmax是研究植物发生核酮糖1,5-二磷酸(RuBP)再生速率限制阶段的一个关键参数, 由此参数并结合光合作用对CO2响应曲线就可以确定在光合作用过程中植物叶片从核酮糖-1,5-二磷酸羧化酶/加氧酶(Rubisco酶)活性限制阶段过渡到RuBP再生速率限制阶段的胞间CO2浓度(Ci,t)的值(
... ;
Limitation of net CO2 assimilation rate by internal resistances to CO2 transfer in the leaves of two tree species (Fagus sylvatica L. and Castanea sativa Mill.)
3
1995
... 参与光呼吸的电子流(
... 当其他消耗光合电子流的途径可以忽略或为常数时, 那么参与碳同化的光合电子流(
... 参与光呼吸的光合电子流(
Changes in the chloroplastic CO2 concentration explain much of the observed Kok effect: A model
2
2017
... 植物的光合作用受光强、CO2浓度和温度等环境因子的影响.
... 生化模型由描述Rubisco酶活性限制、RuBP再生限制和磷酸丙糖利用率(TPU)限制等3个过程的子模型构成.其中非直角双曲线模型(简称模型I)是生化模型的主要子模型(
A biochemical model of photosynthetic CO2 assimilation in leaves of C3 species
3
1980
... 植物的光合作用受光强、CO2浓度和温度等环境因子的影响.
... 在FvCB生化模型中, Jmax是研究植物发生核酮糖1,5-二磷酸(RuBP)再生速率限制阶段的一个关键参数, 由此参数并结合光合作用对CO2响应曲线就可以确定在光合作用过程中植物叶片从核酮糖-1,5-二磷酸羧化酶/加氧酶(Rubisco酶)活性限制阶段过渡到RuBP再生速率限制阶段的胞间CO2浓度(Ci,t)的值(
... 浓度升高, 底物RuBP再生速率小于其消耗速率, 使RuBP浓度不足而限制光合速率, 即RuBP再生速率限制阶段(
Relationships between leaf conductance to CO2 diffusion and photosynthesis in micropropagated grapevine plants, before and after ex vitro acclimatization
2
2006
... 式中, Rl为光呼吸速率, RL为光下暗呼吸速率.由于出现光的部分抑制, 一般认为RL是Rd的一半(
... 根据测量(或拟合)的Jmax、Anmax和Rd值(光下暗呼吸值取暗呼吸速率的一半)(
a). Effects of ploidy level and haplotype on variation of photosynthetic traits: Novel evidence from two Fragaria species
2017
Effects of extreme soil water stress on photosynthetic efficiency and water consumption characteristics of Tamarix chinensis in China’s Yellow River Delta
2017b
UV-B辐射增强对粳稻光合电子传递与光响应特性的影响
2
2016
... 生化模型由描述Rubisco酶活性限制、RuBP再生限制和磷酸丙糖利用率(TPU)限制等3个过程的子模型构成.其中非直角双曲线模型(简称模型I)是生化模型的主要子模型(
... 准确估算植物叶片的Jmax对研究植物叶片光呼吸过程在光保护中的作用是非常必要的(
UV-B辐射增强对粳稻光合电子传递与光响应特性的影响
2
2016
... 生化模型由描述Rubisco酶活性限制、RuBP再生限制和磷酸丙糖利用率(TPU)限制等3个过程的子模型构成.其中非直角双曲线模型(简称模型I)是生化模型的主要子模型(
... 准确估算植物叶片的Jmax对研究植物叶片光呼吸过程在光保护中的作用是非常必要的(
An improved model of C3 photosynthesis at high CO2: Reversed O2 sensitivity explained by lack of glycerate reentry into the chloroplast
3
1991
... 植物的光合作用受光强、CO2浓度和温度等环境因子的影响.
... 在FvCB生化模型中, Jmax是研究植物发生核酮糖1,5-二磷酸(RuBP)再生速率限制阶段的一个关键参数, 由此参数并结合光合作用对CO2响应曲线就可以确定在光合作用过程中植物叶片从核酮糖-1,5-二磷酸羧化酶/加氧酶(Rubisco酶)活性限制阶段过渡到RuBP再生速率限制阶段的胞间CO2浓度(Ci,t)的值(
... ;
越冬期广玉兰阳生叶和阴生叶PSII功能及捕光色素分子内禀特性的比较研究
2017
越冬期广玉兰阳生叶和阴生叶PSII功能及捕光色素分子内禀特性的比较研究
2017
Photosynthetic characteristics of three ploidy levels of Allium oleraceum L. (Amaryllidaceae) differing in ecological amplitude
2
2015
... 生化模型由描述Rubisco酶活性限制、RuBP再生限制和磷酸丙糖利用率(TPU)限制等3个过程的子模型构成.其中非直角双曲线模型(简称模型I)是生化模型的主要子模型(
... 模型II较全面地考虑了光合作用的原初反应过程(
气体交换与荧光同步测量估算植物光合电子流的分配
2
2015
... 生化模型由描述Rubisco酶活性限制、RuBP再生限制和磷酸丙糖利用率(TPU)限制等3个过程的子模型构成.其中非直角双曲线模型(简称模型I)是生化模型的主要子模型(
... 准确估算植物叶片的Jmax对研究植物叶片光呼吸过程在光保护中的作用是非常必要的(
气体交换与荧光同步测量估算植物光合电子流的分配
2
2015
... 生化模型由描述Rubisco酶活性限制、RuBP再生限制和磷酸丙糖利用率(TPU)限制等3个过程的子模型构成.其中非直角双曲线模型(简称模型I)是生化模型的主要子模型(
... 准确估算植物叶片的Jmax对研究植物叶片光呼吸过程在光保护中的作用是非常必要的(
Low-light-induced formation of semicrystalline photosystem II arrays in higher plant chloroplasts
1
2007
... 模型II较全面地考虑了光合作用的原初反应过程(
不同光照环境下荷花叶片光合光响应模型比较
1
2014
... 生化模型由描述Rubisco酶活性限制、RuBP再生限制和磷酸丙糖利用率(TPU)限制等3个过程的子模型构成.其中非直角双曲线模型(简称模型I)是生化模型的主要子模型(
不同光照环境下荷花叶片光合光响应模型比较
1
2014
... 生化模型由描述Rubisco酶活性限制、RuBP再生限制和磷酸丙糖利用率(TPU)限制等3个过程的子模型构成.其中非直角双曲线模型(简称模型I)是生化模型的主要子模型(
Melatonin alleviates low PSI-limited carbon assimilation under elevated CO2 and enhances the cold tolerance of offspring in chlorophyll b-deficient mutant wheat
2
2018
... 2013年, Ye等(
... 利用模型I拟合J-I曲线可以得到Jmax, 然而, 由于模型I是一渐近线, 所以, 该模型不能很好地拟合植物存在PSII动力学下调或光抑制的J-I曲线.
Mechano-stimulated modifications in the chloroplast antioxidant system and proteome changes are associated with cold response in wheat
2
2015
... 2013年, Ye等(
... 利用模型I拟合J-I曲线可以得到Jmax, 然而, 由于模型I是一渐近线, 所以, 该模型不能很好地拟合植物存在PSII动力学下调或光抑制的J-I曲线.
FvCB生物化学光合模型及A-Ci曲线测定
1
2017
... 生化模型由描述Rubisco酶活性限制、RuBP再生限制和磷酸丙糖利用率(TPU)限制等3个过程的子模型构成.其中非直角双曲线模型(简称模型I)是生化模型的主要子模型(
FvCB生物化学光合模型及A-Ci曲线测定
1
2017
... 生化模型由描述Rubisco酶活性限制、RuBP再生限制和磷酸丙糖利用率(TPU)限制等3个过程的子模型构成.其中非直角双曲线模型(简称模型I)是生化模型的主要子模型(
Gas exchange measurements, what can they tell us about the underlying limitations to photosynthesis? Procedures and sources of error
3
2003
... 生化模型由描述Rubisco酶活性限制、RuBP再生限制和磷酸丙糖利用率(TPU)限制等3个过程的子模型构成.其中非直角双曲线模型(简称模型I)是生化模型的主要子模型(
... ;
... 在FvCB生化模型中, Jmax是研究植物发生核酮糖1,5-二磷酸(RuBP)再生速率限制阶段的一个关键参数, 由此参数并结合光合作用对CO2响应曲线就可以确定在光合作用过程中植物叶片从核酮糖-1,5-二磷酸羧化酶/加氧酶(Rubisco酶)活性限制阶段过渡到RuBP再生速率限制阶段的胞间CO2浓度(Ci,t)的值(
Modelling the influence of light, water and temperature on photosynthesis in young trees of mixed Mediterranean forests
2
2015
... 生化模型由描述Rubisco酶活性限制、RuBP再生限制和磷酸丙糖利用率(TPU)限制等3个过程的子模型构成.其中非直角双曲线模型(简称模型I)是生化模型的主要子模型(
... 模型II较全面地考虑了光合作用的原初反应过程(
Comparison of the A-Cc curve fitting methods in determining maximum ribulose-1,5-bisphosphate carboxylase/oxygenase carboxylation rate, potential light saturated electron transport rate and leaf dark respiration. Plant,
4
2009
... 在FvCB生化模型中, Jmax是研究植物发生核酮糖1,5-二磷酸(RuBP)再生速率限制阶段的一个关键参数, 由此参数并结合光合作用对CO2响应曲线就可以确定在光合作用过程中植物叶片从核酮糖-1,5-二磷酸羧化酶/加氧酶(Rubisco酶)活性限制阶段过渡到RuBP再生速率限制阶段的胞间CO2浓度(Ci,t)的值(
... ;
... (
... 式中, O是O2在Rubisco的分压(Pa); Kc和Ko分别是O2和CO2的Michaelis-Menten常数; Γ*为CO2补偿点(Pa).由公式(10)可知, 当其他参数不变时, Ci,t随Jmax的增加而变大.因此, 准确估算Jmax的值对确定Ci,t的值是非常有用的.而模型I显著高估了两种光照条件下大豆叶片的Jmax, 从而导致Ci,t的高估.反过来这又将较大地影响着用FvCB生化模型分段拟合A-Ci曲线时得到的Vcmax、Jmax、TPU、Rd和gm等参数(
Evolution of flexible non-?photochemical quenching mechanisms that regulate light harvesting in oxygenic photosynthesis
1
2013
... 准确估算植物叶片的Jmax对研究植物叶片光呼吸过程在光保护中的作用是非常必要的(
Development of a coupled photosynthetic model of sweet basil hydroponically grown in plant factories. Horticulture,
2
2016
... 生化模型由描述Rubisco酶活性限制、RuBP再生限制和磷酸丙糖利用率(TPU)限制等3个过程的子模型构成.其中非直角双曲线模型(简称模型I)是生化模型的主要子模型(
... 模型II较全面地考虑了光合作用的原初反应过程(
Linking process-based potato models with light reflectance data: Does model complexity enhance yield prediction accuracy?
2
2017
... 生化模型由描述Rubisco酶活性限制、RuBP再生限制和磷酸丙糖利用率(TPU)限制等3个过程的子模型构成.其中非直角双曲线模型(简称模型I)是生化模型的主要子模型(
... 模型II较全面地考虑了光合作用的原初反应过程(
Rapid light curves: A powerful tool to assess photosynthetic activity
1
2005
... 模型II较全面地考虑了光合作用的原初反应过程(
A method for the rapid generation of nonsequential light-response curves of chlorophyll fluorescence
2
2013
... 2013年, Ye等(
... 利用模型I拟合J-I曲线可以得到Jmax, 然而, 由于模型I是一渐近线, 所以, 该模型不能很好地拟合植物存在PSII动力学下调或光抑制的J-I曲线.
Effect of temperature on photosynthesis characteristics in the passion fruits ‘Summer Queen’ and ‘Ruby Star’
2
2017
... 2013年, Ye等(
... 利用模型I拟合J-I曲线可以得到Jmax, 然而, 由于模型I是一渐近线, 所以, 该模型不能很好地拟合植物存在PSII动力学下调或光抑制的J-I曲线.
The influence of light and carbon dioxide on photosynthesis
1
1937
... 此外, 在FvCB生化模型中, 还有另一个描述电子传递速率对光的响应的模型(
Modelling photosynthesis in flag leaves of winter wheat (Triticum aestivum) considering the variation in photosynthesis parameters during developpment
2
2015
... 2013年, Ye等(
... 利用模型I拟合J-I曲线可以得到Jmax, 然而, 由于模型I是一渐近线, 所以, 该模型不能很好地拟合植物存在PSII动力学下调或光抑制的J-I曲线.
Photoprotection in plants: A new light on photosystem II damage
2
2011
... 2013年, Ye等(
... 准确估算植物叶片的Jmax对研究植物叶片光呼吸过程在光保护中的作用是非常必要的(
基于FvCB模型的叶片光合生理对环境因子的响应研究进展
4
2017a
... 生化模型由描述Rubisco酶活性限制、RuBP再生限制和磷酸丙糖利用率(TPU)限制等3个过程的子模型构成.其中非直角双曲线模型(简称模型I)是生化模型的主要子模型(
... 2013年, Ye等(
... 利用模型I拟合J-I曲线可以得到Jmax, 然而, 由于模型I是一渐近线, 所以, 该模型不能很好地拟合植物存在PSII动力学下调或光抑制的J-I曲线.
... 式中, O是O2在Rubisco的分压(Pa); Kc和Ko分别是O2和CO2的Michaelis-Menten常数; Γ*为CO2补偿点(Pa).由公式(10)可知, 当其他参数不变时, Ci,t随Jmax的增加而变大.因此, 准确估算Jmax的值对确定Ci,t的值是非常有用的.而模型I显著高估了两种光照条件下大豆叶片的Jmax, 从而导致Ci,t的高估.反过来这又将较大地影响着用FvCB生化模型分段拟合A-Ci曲线时得到的Vcmax、Jmax、TPU、Rd和gm等参数(
基于FvCB模型的几种草本和木本植物光合生理生化特性
3
2017b
... 生化模型由描述Rubisco酶活性限制、RuBP再生限制和磷酸丙糖利用率(TPU)限制等3个过程的子模型构成.其中非直角双曲线模型(简称模型I)是生化模型的主要子模型(
... 2013年, Ye等(
... 利用模型I拟合J-I曲线可以得到Jmax, 然而, 由于模型I是一渐近线, 所以, 该模型不能很好地拟合植物存在PSII动力学下调或光抑制的J-I曲线.
基于FvCB模型的几种草本和木本植物光合生理生化特性
3
2017b
... 生化模型由描述Rubisco酶活性限制、RuBP再生限制和磷酸丙糖利用率(TPU)限制等3个过程的子模型构成.其中非直角双曲线模型(简称模型I)是生化模型的主要子模型(
... 2013年, Ye等(
... 利用模型I拟合J-I曲线可以得到Jmax, 然而, 由于模型I是一渐近线, 所以, 该模型不能很好地拟合植物存在PSII动力学下调或光抑制的J-I曲线.
1
1976
... 模型I (
In situ estimation of net CO2 assimilation, photosynthetic electron flow and photorespiration in Tukey oak (Q. cerris L.) leaves: Diurnal cycles under different levels of water supply. Plant,
3
1995
... 理论上, 参与碳还原的光合电子流(
... 当其他消耗光合电子流的途径可以忽略或为常数时, 那么参与碳同化的光合电子流(
... 参与光呼吸的光合电子流(
4
... 植物的光合作用受光强、CO2浓度和温度等环境因子的影响.
... 在Farquhar等(1980)的生化模型中, 模型I是其中的一个子模型, 其具体表达式(
... 在FvCB生化模型中, Jmax是研究植物发生核酮糖1,5-二磷酸(RuBP)再生速率限制阶段的一个关键参数, 由此参数并结合光合作用对CO2响应曲线就可以确定在光合作用过程中植物叶片从核酮糖-1,5-二磷酸羧化酶/加氧酶(Rubisco酶)活性限制阶段过渡到RuBP再生速率限制阶段的胞间CO2浓度(Ci,t)的值(
... ;
Steady-state models of photosynthesis
1
2013
... 植物的光合作用受光强、CO2浓度和温度等环境因子的影响.
Some relationships between the biochemistry of photosynthesis and the gas exchange of leaves
3
1981
... 植物的光合作用受光强、CO2浓度和温度等环境因子的影响.
... 在FvCB生化模型中, Jmax是研究植物发生核酮糖1,5-二磷酸(RuBP)再生速率限制阶段的一个关键参数, 由此参数并结合光合作用对CO2响应曲线就可以确定在光合作用过程中植物叶片从核酮糖-1,5-二磷酸羧化酶/加氧酶(Rubisco酶)活性限制阶段过渡到RuBP再生速率限制阶段的胞间CO2浓度(Ci,t)的值(
... ;
干旱胁迫下胡杨光合光响应过程模拟与模型比较
2
2017
... 生化模型由描述Rubisco酶活性限制、RuBP再生限制和磷酸丙糖利用率(TPU)限制等3个过程的子模型构成.其中非直角双曲线模型(简称模型I)是生化模型的主要子模型(
... 模型II较全面地考虑了光合作用的原初反应过程(
干旱胁迫下胡杨光合光响应过程模拟与模型比较
2
2017
... 生化模型由描述Rubisco酶活性限制、RuBP再生限制和磷酸丙糖利用率(TPU)限制等3个过程的子模型构成.其中非直角双曲线模型(简称模型I)是生化模型的主要子模型(
... 模型II较全面地考虑了光合作用的原初反应过程(
贝壳砂生境干旱胁迫下杠柳叶片光合光响应模型比较
1
2013
... 生化模型由描述Rubisco酶活性限制、RuBP再生限制和磷酸丙糖利用率(TPU)限制等3个过程的子模型构成.其中非直角双曲线模型(简称模型I)是生化模型的主要子模型(
贝壳砂生境干旱胁迫下杠柳叶片光合光响应模型比较
1
2013
... 生化模型由描述Rubisco酶活性限制、RuBP再生限制和磷酸丙糖利用率(TPU)限制等3个过程的子模型构成.其中非直角双曲线模型(简称模型I)是生化模型的主要子模型(
Rapid light curves: A new fluorescence method to asses the state of the photosynthetic apparatus
1
1999
... 模型I和模型II分别拟合遮阴和全光照条件下大豆叶片的J-I曲线, 其拟合效果见
A new model for relationship between irradiance and the rate of photosynthesis in Oryza sativa
1
2007
... 生化模型由描述Rubisco酶活性限制、RuBP再生限制和磷酸丙糖利用率(TPU)限制等3个过程的子模型构成.其中非直角双曲线模型(简称模型I)是生化模型的主要子模型(
光合电子流对光响应的机理模型及其应用
1
2014
... 利用模型I拟合J-I曲线可以得到Jmax, 然而, 由于模型I是一渐近线, 所以, 该模型不能很好地拟合植物存在PSII动力学下调或光抑制的J-I曲线.
光合电子流对光响应的机理模型及其应用
1
2014
... 利用模型I拟合J-I曲线可以得到Jmax, 然而, 由于模型I是一渐近线, 所以, 该模型不能很好地拟合植物存在PSII动力学下调或光抑制的J-I曲线.
A mechanistic model for the light response of photosynthetic electron transport rate based on light harvesting properties of photosynthetic pigment molecules
3
2013a
... 2013年, Ye等(
... 利用模型I拟合J-I曲线可以得到Jmax, 然而, 由于模型I是一渐近线, 所以, 该模型不能很好地拟合植物存在PSII动力学下调或光抑制的J-I曲线.
... 模型II较全面地考虑了光合作用的原初反应过程(
A mechanistic model for the photosynthesis-light response based on the photosynthetic electron transport of PSII in C3 and C4 species
5
2013b
... 2013年, Ye等(
... 模型II (
... 在植物叶片光合作用对光响应机理模型中有关光合作用对光的响应模型(简称模型II)(
... 利用模型I拟合J-I曲线可以得到Jmax, 然而, 由于模型I是一渐近线, 所以, 该模型不能很好地拟合植物存在PSII动力学下调或光抑制的J-I曲线.
... 模型II较全面地考虑了光合作用的原初反应过程(
Using combined measurements of gas exchange and chlorophyll fluorescence to estimate parameters of a biochemical C3 photosynthesis model: A critical appraisal and a new integrated approach applied to leaves in a wheat (Triticum aestivum) canopy. Plant,
1
2009
... 式中, O是O2在Rubisco的分压(Pa); Kc和Ko分别是O2和CO2的Michaelis-Menten常数; Γ*为CO2补偿点(Pa).由公式(10)可知, 当其他参数不变时, Ci,t随Jmax的增加而变大.因此, 准确估算Jmax的值对确定Ci,t的值是非常有用的.而模型I显著高估了两种光照条件下大豆叶片的Jmax, 从而导致Ci,t的高估.反过来这又将较大地影响着用FvCB生化模型分段拟合A-Ci曲线时得到的Vcmax、Jmax、TPU、Rd和gm等参数(
