 ,1,*, 封建民1, 何志斌21
2
Estimating whole-tree water use of Picea crassifolia based on heat ratio method
YANG Jun-Jun,1,*, FENG Jian-Min1, HE Zhi-Bin212
通讯作者:
| 基金资助: |
Online:2018-04-19
| Supported by: | SupportedbytheNationalKeyTechnologyResearchandDevelopmentProgramoftheMinistryofScienceandTechnologyofChina( |

摘要
关键词:
Abstract
Keywords:
PDF (958KB)摘要页面多维度评价相关文章导出EndNote|Ris|Bibtex收藏本文
引用本文
杨军军, 封建民, 何志斌. 基于热比率法的青海云杉林蒸腾量估算. 植物生态学报, 2018, 42(2): 195-201 doi:10.17521/cjpe.2017.0082
YANG Jun-Jun, FENG Jian-Min, HE Zhi-Bin.
祁连山是中国西部干旱、半干旱区多条内陆河的产水区, 其中段北坡为中国第二大内陆河黑河上游, 流域上游产水是维持中下游居民生活、生产用水和生态环境稳定的重要保障。在森林覆盖率较大的流域, 森林是流域的重要耗水区(He et al., 2012; Jasechko et al., 2013), 青海云杉(Picea crassifolia)作为祁连山水源区的一个主要树种, 覆盖面积占所在区域水源涵养林的24.74% (田风霞, 2011)。因此, 青海云杉林的面积大小、林龄组成及林分结构等都与流域出水量的大小密切 相关。
近年来, 随着祁连山人工林种植面积的增加(陈幸良等, 2014), 森林面积和结构变化可能引起的流域径流变化已经成为一个重要问题。流域上游森林演替过程所引起的蒸腾量变化急需准确估算, 然而受森林结构空间异质性和观测技术的限制, 如何准确估算不同尺度森林蒸腾量一直是该领域的研究热点(Ungar et al., 2013; Schlaepfer et al., 2014; de Dios et al., 2015; Su et al., 2016)。随着技术进步, 液流估算技术越来越成熟(Kume et al., 2012; Shinohara et al., 2013; Chang et al., 2014b; de Dios et al., 2015), 热比率法作为目前最先进的单木树干液流测量技术(van de Wal et al., 2015), 测量精度已在全球诸多研究中得到广泛论证, 同时测量技术也在不断地完善和规范(Shinohara et al., 2013; Chang et al., 2014a; Sus et al., 2014; de Dios et al., 2015; van de Wal et al., 2015; Su et al., 2016)。热比率法测量中, 探针两个热电偶测量点上的液流速率并不相同, 例如Chang等(2014a)发现青海云杉蒸腾速率随边材深度增加呈高斯函数变化, 但其对胸径>35 cm植株的采样仅2个, 结果的合理性需要进一步确认。而Gebauer等(2008)对8种散孔材和环孔材的单木分析发现, 不同单木间液流速率在边材上的分布各异。因此, 针对不同树种, 两点式热比率法如何更为准确地估算树木边材区域液流量有待做进一步的细化和优化研究。
在基于单木的林分蒸腾估算中, 已有研究均采用观测单木液流速率的平均值和林分边材总面积估算林分蒸腾量(Wilson et al., 2001; Fiora & Cescatti, 2008)。该算法的前提是假设所有单木的蒸腾速率相同, 但客观现实中不同胸径单木液流速率是否相同需要进一步验证。如果不同, 按照已有研究方法, 林分蒸腾量计算可能产生多大误差?我们又该如何对林分蒸腾量进行估算?这些蒸腾量尺度转换中存在的问题都需要进一步探讨和研究。
因此, 本研究以我国西北部半干旱区祁连山排露沟流域典型森林青海云杉为研究对象, 基于林分调查数据和生长季单木树干液流观测数据, 对林木蒸腾量进行了估算和尺度转换, 以期为青海云杉林蒸腾量的量化、分析和模拟预测提供理论支持, 最终为区域森林生态水文功能的认识和营林管理提供 借鉴。
1 研究区概况
研究区位于中国西北部祁连山中段北坡的排露沟小流域, 地理位置为38.40° N, 100.28° E。流域面积为2.91 km2, 地形复杂多变, 海拔2β650-3β800 m。流域出口年降水量为376 mm, 其中约65%的降水集中在7至9月, 随海拔升高, 每100 m降水量增加约4.3% (He et al., 2012)。年平均气温1 ℃, 其中最低温在每年12月下旬(-27.6 ± 3.0) ℃, 最高温在每年7月下旬(25.6 ± 2.4) ℃。流域植被空间分布随地形、海拔和坡向而异, 高海拔以灌丛草地为主; 中低海拔阳坡为草地, 阴坡和半阴坡以林地为主。青海云杉是流域内的唯一乔木树种。林地土壤以灰褐土为主, 土壤厚度随海拔升高逐渐减小, 平均厚度1 m左右, 成土母质以钙质岩为主。2 研究方法
2.1 单木液流测量
实验样地共布设8部热比率树干液流仪器(SFM 1 Sap Flow Meters, 探头为HRM30, ICT International PTY, Armidale, Australia)。选择样树时, 保证样树胸径分布能够代表区域林分胸径的基本情况, 样树的生理学和物理学参数见表1。根据林分实地调查(图1), 研究林分以中小树型为主, 且随着胸径增大, 树木所占比例逐渐减小。探针安装时选择位于树干胸径位置(约树高1.3 m处)朝北方向表面平整的部位为安装点。安装前, 去掉安装部位的树皮使边材外漏, 固定钻孔模具时, 要保证模具上3个钻孔连线的方向与树干方向保持平行。探针安装时先用硅胶浸泡探针, 以保证安装后探头和木质部间紧密接触。探针安装深度35 mm, 垂直间距为5 mm, 从图中可见调查样木胸径分布基本能够代表样地主要胸径分布。安装完成后, 用硅胶将树皮损坏部位进行包裹, 避免外漏木质部发生蒸发, 最后用铝箔对探头周边进行包裹, 以避免环境和辐射温度对测量探头的影响, 液流观测时间段为生长季。Table 1
表1
表1青海云杉树干液流测量样木的生物、生理学统计参数
Table 1
| 样树编号 Sample tree number | 树高 Tree height | 胸径 Diameter at breast height | 冠幅宽度 Crown width | 冠幅投影面积 Crown projection area | 树皮厚度 Bark depth | 心材半径 Heartwood radius | 边材厚度 Sapwood width | 边材面积 Sapwood area |
|---|---|---|---|---|---|---|---|---|
| (m) | (cm) | (m) | (m2) | (cm) | (mm) | (mm) | (mm2) | |
| 1 | 16.1 | 22.2 | 4.24 | 14.07 | 0.6 | 67 | 37.5 | 20β327.0 |
| 2 | 14.2 | 16.0 | 4.29 | 14.16 | 0.6 | 42 | 32.1 | 11β694.6 |
| 3 | 13.0 | 15.5 | 3.38 | 10.35 | 0.6 | 40 | 31.7 | 11β090.7 |
| 4 | 11.3 | 11.4 | 2.68 | 8.13 | 0.6 | 22 | 28.6 | 6β599.9 |
| 5 | 5.5 | 6.2 | 2.01 | 6.34 | 0.3 | 8 | 20.5 | 2β286.3 |
| 6 | 5.3 | 5.0 | 1.60 | 5.50 | 0.3 | 8 | 14.5 | 1β343.8 |
| 7 | 4.2 | 5.1 | 2.26 | 6.91 | 0.3 | 8 | 15.0 | 1β413.7 |
| 8 | 3.8 | 4.1 | 2.11 | 6.55 | 0.3 | 8 | 10.0 | 785.4 |
新窗口打开|下载CSV
图1
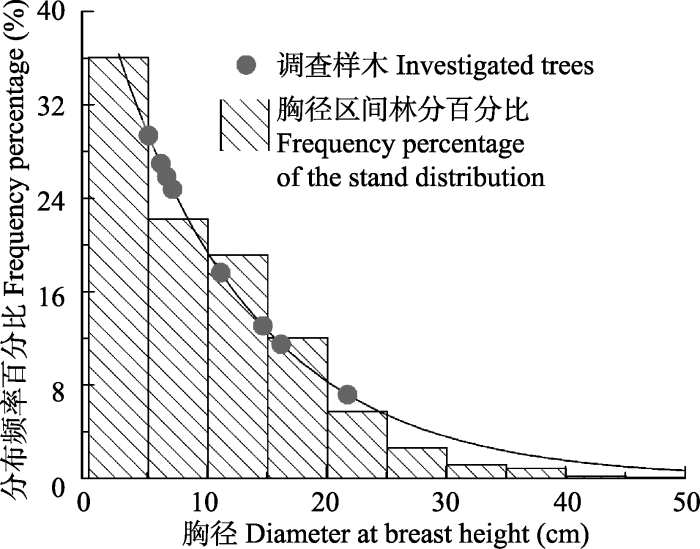 新窗口打开|下载原图ZIP|生成PPT
图1调查林分胸径频率分布及调查样木胸径分布。
Fig. 1Frequency percentage of diameter at breast height at investigation stand and the diameter of sample trees.
2.2 边材面积计算
通过大量砍伐观测单木获取边材面积显然是不可取的, Chang等(2014b)发现青海云杉胸径与边材面积间存在良好的函数关系, 为青海云杉边材面积计算提供了更为便捷的估算方法。但Chang等(2014b)研究中的采样点较少(17个), 且拟合函数对胸径35 cm以上青海云杉的样本较少, 函数的代表性存在较大不确定性。为了提高拟合函数在该胸径范围内的准确性, 提高基于胸径的边材面积估算精度, 2015年8月在祁连山青海云杉样地调查了胸径频率分布均匀的84株单木, 取样168个。取样时, 以直径为6 mm的生长锥按照单木胸径大小分布, 对生长状况良好的84株单木进行树芯取样, 每株单木以90度夹角分别取两个树芯, 取样高度为树高距地面1.3 m处。树芯边材厚度通过浓度为40%的HClO4和福尔马林溶液进行染色确定, 染色后, 边材颜色较浅而心材颜色较深, 根据颜色差异, 用游标卡尺测量获得单木的边材和心材厚度, 以同一单木两个树芯的平均值作为该单木边材和心材的厚度。另外, 由于青海云杉树干挺拔、匀称, 边材厚度分布均匀, 边材面积可以按圆环进行计算。统计发现胸径与边材厚度之间存在良好的指数函数关系(图2)。
图2
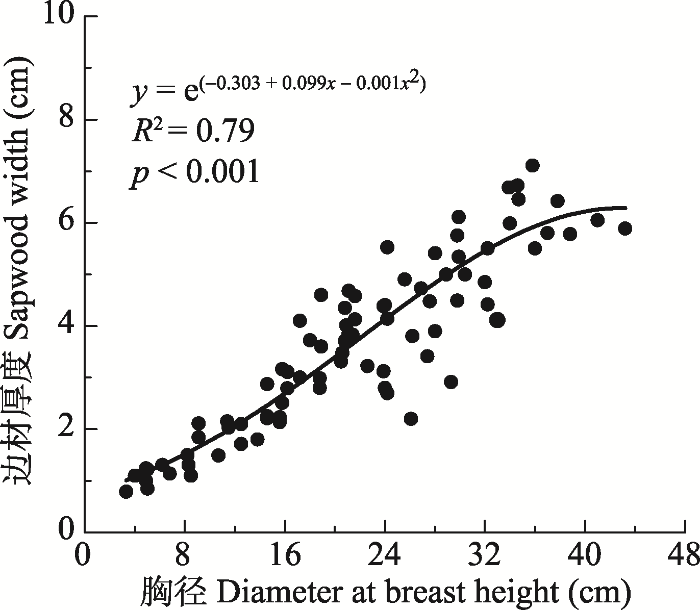 新窗口打开|下载原图ZIP|生成PPT
图2青海云杉胸径(x)与边材厚度(y)变化拟合函数。
Fig. 2Relationship between diameter at breast height (x) and sapwood width (y) for Picea crassifolia.
2.3 单木蒸腾量估算方法
热比率法树干液流测量过程中, 将两个温度探针等距插在热探针的上下方, 探针间垂直距离为 5 mm。每个温度探针上, 在距离探头顶端7.5 mm和22.5 mm的地方分别内置一个热电偶, 用于感应来自热探头的热脉冲, 最后, 根据热脉冲发射和接收时的温度差计算两测量点间的液流速率(Burgess et al., 2001), 计算过程如下:\[{{V}_{\text{h}}}=\frac{k}{x}\ln \left( \frac{{{v}_{1}}}{{{v}_{2}}} \right)\times 3600 \ \ (1) \]
式中: Vh为热脉冲速率, k为鲜材热扩散系数, x为热探头与温度探头间的距离, v1和v2分别为上行和下行方向上温度的变化量, 对应液流速率(Vs)计算公式如下:
\[{{V}_{\text{s}}}=\frac{{{V}_{\text{h}}}{{\rho }_{\text{b}}}\left( {{c}_{\text{w}}}+{{m}_{\text{c}}}{{c}_{\text{s}}} \right)}{{{\rho }_{\text{s}}}{{c}_{\text{s}}}} \ \ (2) \]
式中: ρb为木材密度(干材质量/鲜材体积), cw和cs分别为鲜材比热容(1β200 J·kg-1·℃-1, 20 ℃), 液流比热容(水, 4β182 J·kg-1·℃-1, 20 ℃), mc和ρs分别为鲜材含水量和密度。
在单点液流速率计算的基础上, 以两热电偶中间位置为分割点, 将单木边材横断面分为内外两个环形区域, 单木总蒸腾量Q可按如下公式计算:
\[Q={{V}_{\text{s}}}{{A}_{\text{s}}}={{V}_{\text{ot}}}{{A}_{1}}+{{V}_{\text{in}}}{{A}_{2}} \ \ (3) \]
式中: Vot和Vin分别为温度探头内外热电偶的液流速率, A1和A2分别为外环和内环的面积。
2.4 林分蒸腾量的估算方法
林分蒸腾量估算是蒸腾量尺度转换的关键(Kume et al., 2012; Hentschel et al., 2013; Shinohara et al., 2013), 胸径作为森林蒸腾量计算的一个重要变量, 在蒸腾量尺度转换中至关重要。根据定义, 林分总蒸腾量即林分内所有单木蒸腾量的总和:\[{{Q}_{\text{sd}}}=\sum\limits_{i\ =\ 1}^{n}{{{Q}_{i}}} \ \ (4) \]
式中, i代表林分内第i株单木, 林分树木总数为n, Qi为第i株单木的蒸腾量, Qsd代表林分总蒸腾量。
实际操作中, 我们无法对林分内的所有树木测量蒸腾量, 然后求和。对此, 已有研究提出通过计算林分总边材面积和林分平均液流速率估算林分的总蒸腾量, 但该计算方法存在上文中所提及的几点不确定性, 该算法的合理性有待进一步验证。
对此, 本文提出以下林分蒸腾量的计算方法。首先, 假设单木蒸腾量与胸径间存在直接关系, 即根据已有胸径液流观测数据可以估算出其他胸径的蒸腾量大小; 其次, 选择一个能代表研究区林分胸径分布情况的调查样地, 测量样地内所有单木的胸径, 结合观测单木蒸腾量, 根据上文假设中胸径与蒸腾量的拟合即可计算出样地总蒸腾量; 最后, 通过林分面积和调查样地总面积间的比例估算林分总蒸腾量Qsd:
${{Q}_{\text{sd}}}=\frac{A{}_{\text{s}}}{A}{{Q}_{\text{t}}} (5)$
${{Q}_{\text{t}}}=\sum\limits_{k\ =\ 1}^{m}{{{Q}_{k}}} (6)$
式中, As为林分面积, A为样地面积, Qt为选择样地的总蒸腾量, m为样地内样树数量, Qk为样地内第k株
单木的蒸腾量。
2.5 流域蒸腾量估算方法
本研究针对树种单一、林相接近的林区情景, 提出采用不同林分平均蒸腾量与对应面积加权求和直接测量获得流域平均蒸腾量, 计算公式如下。${{Q}_{\text{w}}}=\sum\limits_{i\ =\ 1}^{n}{{{Q}_{\text{sti}}}}\times {{A}_{\text{sti}}} (7)$
式中, Qw为流域平均蒸腾量, Qsti和Asti为第i个林分的平均蒸腾量和面积, n为流域被划分的林分数。
3 结果和分析
3.1 单木蒸腾量与胸径间关系的验证
在林分蒸腾量估算前, 首先对上文中单木蒸腾量与胸径间的关系进行分析。对生长季观测样树蒸腾量与边材厚度间关系分析发现, 两者间存在典型的指数函数(图3; 公式8)。同时, 由于边材厚度与胸径间存在特定的函数关系(详见Chang等(2014b)), 因此上文假设成立, 研究计算方法可行。\[y={{e}^{(5.18-0.05x+0.004{{x}^{2}})}} \ \ (8) \]
图3
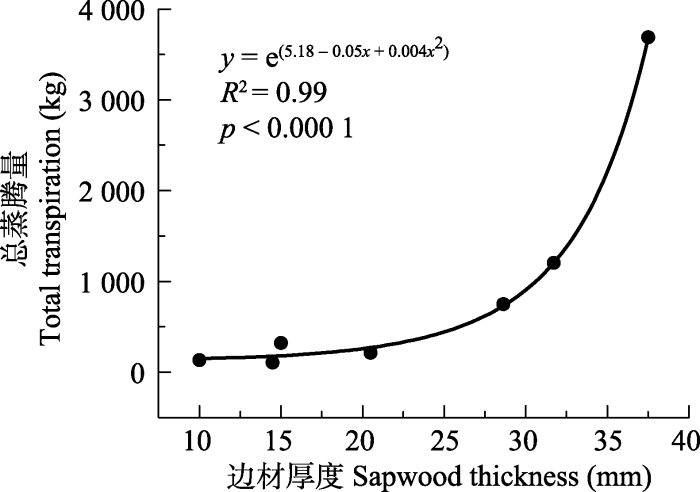 新窗口打开|下载原图ZIP|生成PPT
图3青海云杉边材厚度与总蒸腾量间的变化关系。此处总蒸腾量为2015年7月23日到10月25日之间不同胸径青海云杉的总蒸腾量。
Fig. 3Sap flow variation patterns of sapwood width for Qinghai spruce. Total transpiration was the transpiration of sample trees between July 23th and October 25th in 2015.
3.2 单木蒸腾量估算
单木蒸腾量的估算需要基于测量点观测结果进行尺度转换(Berdanier et al., 2016), 尺度转换中, 边材面积的准确估算是液流量估算的一个关键。3.2.1 观测蒸腾量校正
van de Wal等(2015)对液流速率在边材厚度和观测时间上的变化探讨后指出, 单木蒸腾量的估算必须考虑液流速率在边材空间和观测时间上的变异性。Chang等(2014a)对青海云杉液流速率随边材厚度的变化发现, 液流速率与边材厚度间呈典型的高斯函数分布。因此, 单木液流量Q是液流速率在边材宽度上的积分(公式9) (Chang et al., 2014b)。
\[Q=\int_{0}^{R}{f(x)dx} \ \ (9) \]
式中, R为边材深度, f(x)为液流速率随边材深度变化的高斯函数。热比率法探针测量时能够获得距离边材外边缘12.5 mm和27.5 mm两点的观测值。为了评价热比率探针上两测量点对液流速率估算的准确性, 我们分别对高斯函数边材厚度0-40 mm范围内热比率探针两热电偶(外电偶和内电偶)采样点对应面积的积分与理论函数积分估计值进行计算(公式10)。
\[c=\frac{\int_{0}^{40}{f(x)dx}}{\int_{0}^{12.5}{f({{x}_{1}})dx}+\int_{0}^{27.5}{f({{x}_{2}})dx}} \ \ (10) \]
式中, f(x)为液流速率随边材深度变化的高斯函数, x1 = 12.5 mm, x2 = 27.5 mm分别为热比率探针上两个热电偶的位置。即, 第一部分为: 测量探针外电偶所对应的液流积分区间与测量探针内电偶对应的液流积分区间, 第二部分为: 高斯曲线与x轴间面积为理论液流积分区间。结果发现两者比值c = 1.09, 即青海云杉液流量计算中, 理论值与观测值的比值为1.09, 借助该校正系数, 可以对观测液流量Q进行校正, 计算过程见公式(11)。
\[Q=c\times {{Q}_{o}} (11) \ \ (11) \]
式中, c = 1.09, Qo为实测液流量, 计算过程见公式(1)(2)(3)。
3.2.2 单木蒸腾量计算
蒸腾量观测主要集中在生长季, 我们对观测期每月日平均蒸腾量进行统计(表2)。统计结果中, 不同胸径单木蒸腾量差异显著, 如7月份胸径为22.2 cm的单木蒸腾量为68.67 kg·d-1, 胸径为11.4 cm的单木蒸腾量为17.89 kg·d-1, 而胸径为5 cm的单木蒸腾量仅为7.54 kg·d-1。不同胸径单木间蒸腾量并不呈线性分布, 因此在单木蒸腾量计算中不同胸径单木必须独立计算, 即代表林分平均胸径单木的蒸腾量不能代表林分的平均蒸腾量。
Table 2
表2
表2观测期青海云杉逐月日均蒸腾量(平均值±标准偏差)(kg·d-1)
Table 2
| 月份 Month | 样树编号 Sample tree number | ||||||
|---|---|---|---|---|---|---|---|
| 1 | 3 | 4 | 5 | 6 | 7 | 8 | |
| 7月 July | 68.67 ± 6.49 | 29.97 ± 4.19 | 17.89 ± 2.24 | 5.37 ± 0.33 | 7.54 ± 0.87 | 3.81 ± 0.43 | 2.78 ± 0.11 |
| 8月 August | 44.55 ± 9.09 | 14.77 ± 4.41 | 9.74 ± 2.57 | 2.93 ± 0.89 | 4.36 ± 1.27 | 1.40 ± 0.53 | 1.81 ± 0.42 |
| 9月 September | 34.83 ± 9.50 | 9.98 ± 3.29 | 6.88 ± 3.01 | 1.72 ± 0.72 | 2.56 ± 1.29 | 0.53 ± 0.09 | 0.97 ± 0.28 |
| 10月 October | 25.81 ± 6.68 | 6.99 ± 1.43 | 3.16 ± 1.20 | 0.95 ± 0.31 | 1.64 ± 0.68 | 0.41 ± 0.03 | 0.79 ± 0.18 |
新窗口打开|下载CSV
在时间尺度上, 胸径小于10 cm的单木在9到10月蒸腾量已变得非常小, 即非生长季液流量可忽略不计, 因此在年蒸腾量计算中, 可忽略非生长季的蒸腾量。但当样树胸径大于10 cm时, 该时段仍然存在一定的蒸腾量, 因此, 在年蒸腾量计算中, 胸径大于10 cm的单木蒸腾量需要有观测记录, 不能忽略。由于已有观测数据时间段较有限, 对于其余月份的情况, 还需要更多数据进一步分析和探讨。
3.3 林分蒸腾量估算
同一林分的单木之间, 由于组成、起源、林相、林龄和空间分布非常接近, 为林分蒸腾量估算奠定了基础。根据上文计算方法, 2β700 m样地的各单木及林分蒸腾量见图4。林分与各单木蒸腾过程基本保持一致。经统计, 观测时段林分日平均蒸腾量为1.17 mm, 其中每日最大蒸腾量为2.68 mm, 最小蒸腾量为 0.35 mm。研究结果比Chang等(2014b)在该流域针对2011和2012年生长季蒸腾量的研究结果稍偏小, 这可能是因为本研究观测时间段位于生长季末期,相比Chang等(2014b)的研究时段林木液流活动减弱, 液流量相对较小所致。
图4
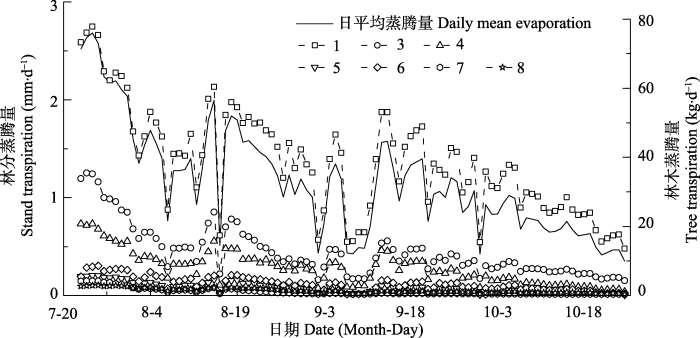 新窗口打开|下载原图ZIP|生成PPT
图4观测期(7月23日到10月25日)林分蒸腾量与单木蒸腾量间对比关系。
Fig. 4Stand sap-flow pattern and tree sap-flow patterns on seven measured trees during the observational period (between July 23th and October 25th in 2015).
林分蒸腾量计算中, 如果只对胸径大于10 cm的单木液流速率进行林分蒸腾量估算, 按照Chang等(2014b)、Pataki和Oren (2003)和Wilson等(2001)的林分蒸腾量估算方法, 经计算观测期林分蒸腾量为1.54 mm, 最大蒸腾量为3.47 mm, 最小值为0.49 mm, 相对本研究结果, 日平均蒸腾量偏高约32%。由此可见, 林分蒸腾量计算中如果选择样树胸径分布不均或者只基于部分样树进行林分蒸腾量估算, 均有可能产生一定的误差。林分蒸腾量估算中不能通过部分单木液流速率的平均值和林分边材总面积计算林分总蒸腾量。
冠层蒸腾量的准确计算是流域水量平衡计算的一个关键环节和参数(McJannet et al., 2007)。本文由于观测数据有限, 不对流域冠层蒸腾量进行计算, 在日后的工作中可以根据实际情况, 按照本研究的冠层蒸腾量计算办法对流域蒸腾量进行估算。
4 结论
单木、林分和流域蒸腾量的准确估算对于森林生态系统水文功能的计算和理解至关重要。本研究以青海云杉为研究对象, 分别就单木蒸腾量的观测和不同尺度蒸腾量的估算进行了分析, 得到以下结论: (1)通过青海云杉胸径可以准确地估算其边材面积, 函数关系为基于边材面积的单木蒸腾量估算提供了参数; (2)基于热比率法的双热电偶液流测量技术, 理论值与观测值间比例系数为1.09; (3)林分蒸腾量计算中, 不同胸径样树间液流速率的差异, 会对基于平均液流速率和边材面积的蒸腾量计算带来一定误差; (4)生长季青海云杉林分蒸腾量估算中, 如果只对胸径大于10 cm的单木进行计算, 林分蒸腾量就会被高估近32%。致谢 感谢原中国科学院寒区旱区环境与工程研究所祁连山森林生态系统观测点的所有工作人员在文章数据的采集中给予的积极配合和帮助。

参考文献 原文顺序
文献年度倒序
文中引用次数倒序
被引期刊影响因子
.
DOI:10.1093/treephys/tpv120URLPMID:26612849 [本文引用: 2]

How regulation of phloem transport could link potassium fertilization to increased growth
.
DOI:10.1093/treephys/21.9.589URLPMID:11390303 [本文引用: 1]
Abstract The compensation heat pulse method (CHPM) is of limited value for measuring low rates of sap flow in woody plants. Recent application of the CHPM to woody roots has further illustrated some of the constraints of this technique. Here we present an improved heat pulse method, termed the heat ratio method (HRM), to measure low and reverse rates of sap flow in woody plants. The HRM has several important advantages over the CHPM, including improved measurement range and resolution, protocols to correct for physical and thermal errors in sensor deployment, and a simple linear function to describe wound effects. We describe the theory and methodological protocols of the HRM, provide wound correction coefficients, and validate the reliability and accuracy of the technique against gravimetric measurements of transpiration.
[本文引用: 1]
DOI:10.1016/j.agrformet.2014.08.015URL [本文引用: 5]
Tree transpiration plays a determining role in the water balance of forest stands and in water yields from forested catchments, especially in arid regions. This study describes direct measurements of tree sap flow by heat pulse velocity method, and calculations of stand transpiration and canopy conductance, during the 2011 and 2012 growing seasons, in an 80- to 120-year-old Picea crassifolia stand in a natural forest. The experiment was carried out on Qilianshan Mountain, located in the upper Heihe River Basin, in the arid region of Northwest China. It was found that stand transpiration (Ec) ranged from 1.0mmd611 to 2.4mmd611, and from 1.2mmd611 to 2.4mmd611, during the 2011 and 2012 growing seasons, respectively. Total Ec was 195.2mm, 219.6mm during the 2011 and 2012 growing seasons, respectively. And total Ec during the 2012 growing season was 12.5% higher than during the 2011 growing season. Based on the half-hourly temporal scale, canopy conductance was between 0.3mms611 and 51.3mms611, and between 1.2 and 57.0mms611, during the 2011 and 2012 growing seasons, respectively. Canopy conductance was sensitive to variations in climatic variables such as vapor pressure deficit (D), air temperature (T), wind speed (W) and global short-wave radiation (R). It is also evident that an exponential decay function, including D and T, accounted for 81% and 19% of the variations in canopy conductance, respectively. These results was not only providing the basis for more detailed analyses of water physiology and growth of Qinghai spruce trees for the later application of a climate-driven process model, but also might have implications for forest management in Qilianshan Mountains.
.
DOI:10.13348/j.cnki.sjlyyj.2014.06.008URL [本文引用: 1]
Plantation forest has developed rapidly in China, which brought China to be the largest country in plantation area across the world. But plantation development in China has to address the challenges and problems, including low quality, irrational structure, rising inputs, poor site conditions, tense conflict of woodland supply and demand. This paper analyzed the problems existing in plantation development by describing the characteristics of plantations in China and comparing them with the of world's plantations development. Countermeasures were put forward in terms of sustainable plantation management, policy optimization, deepening corresponding reform, increasing investment from various channels, adherence to the project-based development and strict control on woodland, in order to meet the demand of socioeconomic development for multiple functions of plantation.
.
DOI:10.1038/srep10975URLPMID:26074373 [本文引用: 3]
Evapotranspiration is a major component of the water cycle, yet only daytime transpiration is currently considered in Earth system and agricultural sciences. This contrasts with physiological studies where 25% or more of water losses have been reported to occur occurring overnight at leaf and plant scales. This gap probably arose from limitations in techniques to measure nocturnal water fluxes at ecosystem scales, a gap we bridge here by using lysimeters under controlled environmental conditions. The magnitude of the nocturnal water losses (12-23% of daytime water losses) in row-crop monocultures of bean (annual herb) and cotton (woody shrub) would be globally an order of magnitude higher than documented responses of global evapotranspiration to climate change (51-98 vs. 7-8 mm yr(-1)). Contrary to daytime responses and to conventional wisdom, nocturnal transpiration was not affected by previous radiation loads or carbon uptake, and showed a temporal pattern independent of vapour pressure deficit or temperature, because of endogenous controls on stomatal conductance via circadian regulation. Our results have important implications from large-scale ecosystem modelling to crop production: homeostatic water losses justify simple empirical predictive functions, and circadian controls show a fine-tune control that minimizes water loss while potentially increasing posterior carbon uptake.
DOI:10.1093/treephys/28.9.1317URLPMID:18595843 [本文引用: 1]
Understanding the causes determining the radial pattern of sap flux density is important both for improving knowledge of sapwood functioning and for up-scaling sap flow measurements to canopy and ecosystem use. To investigate the anatomical connection between whorls and annual sapwood rings, pruning-induced variation in the radial pattern of sap flux density was monitored with Granier probes in a 35-year-old (L.) Karst tree that was pruned from the bottom up. Modifications in the radial pattern of sap flux density were quantified by a shape index (SI), which varies with the relative contribution of the outer and inner sapwood to tree . The SI progressively diminished during bottom up pruning, indicating a significant reduction in sap flow contribution of the inner sapwood. Results suggest that the radial pattern of sap flux density depends mainly on the vertical distribution of foliage in the , with lower shaded branches hydraulically connected with inner sapwood and upper branches connected with the outer rings.
.
DOI:10.1093/treephys/28.12.1821URLPMID:19193565
Abstract Forest transpiration estimates are frequently based on xylem sap flux measurements in the outer sections of the hydro-active stem sapwood. We used Granier's constant-heating technique with heating probes at various xylem depths to analyze radial patterns of sap flux density in the sapwood of seven broad-leaved tree species differing in wood density and xylem structure. Study aims were to (1) compare radial sap flux density profiles between diffuse- and ring-porous trees and (2) analyze the relationship between hydro-active sapwood area and stem diameter. In all investigated species except the diffuse-porous beech (Fagus sylvatica L.) and ring-porous ash (Fraxinus excelsior L.), sap flux density peaked at a depth of 1 to 4 cm beneath the cambium, revealing a hump-shaped curve with species-specific slopes. Beech and ash reached maximum sap flux densities immediately beneath the cambium in the youngest annual growth rings. Experiments with dyes showed that the hydro-active sapwood occupied 70 to 90% of the stem cross-sectional area in mature trees of diffuse-porous species, whereas it occupied only about 21% in ring-porous ash. Dendrochronological analyses indicated that vessels in the older sapwood may remain functional for 100 years or more in diffuse-porous species and for up to 27 years in ring-porous ash. We conclude that radial sap flux density patterns are largely dependent on tree species, which may introduce serious bias in sap-flux-derived forest transpiration estimates, if non-specific sap flux profiles are assumed.
.
DOI:10.1002/hyp.v26.4URL [本文引用: 2]
DOI:10.1016/j.agrformet.2013.08.002URL [本文引用: 1]
Quantifying the water exchange between a forest stand and the atmosphere is of major interest for the prediction of future growth conditions and the planning of silvicultural treatments. In the present study, we address (i) the uncertainties of sap flow estimations at the tree level and (ii) the performance of the simulation of stand transpiration. Terrestrial laser scan images (TLS) of a mature beech stand (Fagus sylvaticaL.) in Southwestern Germany serve as input data for a representation of the aboveground tree architecture of the study stand. In the single-tree xylem water flow model (XWF) used here, 98 beech trees are represented by 3D graphs of connected cylinders with explicit orientation and size. Beech-specific hydraulic parameters and physical properties of individual trees determine the physiological response of the tree model to environmental conditions. TheXWFsimulations are performed without further calibration to sap flow measurements. The simulations reliably match up with sap flow estimates derived from sap flow density measurements. The density measurements strongly depend on individual sapwood area estimates and the characterization of radial sap flow density gradients with xylem depth. Although the observed pure beech stand is even-aged, we observe a high variability in sap flow rates among the individual trees. Simulations of the individual sap flow rates show a corresponding variability due to the distribution of the crown projection area in the canopy and the different proportions of sapwood area. Stand transpiration is obtained by taking the sum of 98 single-tree simulations and the corresponding sap flow estimations, which are then compared with the stand-level root water uptake model (RWUmodel) simulation. Using theRWUmodel results in a 35% higher simulation of seasonal stand transpiration relative to theXWFmodel. These findings demonstrate the importance of individual tree dimensions and stand heterogeneity assessments in estimating stand water use. As a consequence of species-specific model parameterization and preciseTLS-based stand characterization, theXWFmodel is applicable to various sites and tree species and is a promising tool for predicting the possible water supply limitations of pure and mixed forest stands.
.
DOI:10.1038/nature11983URLPMID:23552893 [本文引用: 1]
Renewable fresh water over continents has input from precipitation and losses to the atmosphere through evaporation and transpiration. Global-scale estimates of transpiration from climate models are poorly constrained owing to large uncertainties in stomatal conductance and the lack of catchment-scale measurements required for model calibration, resulting in a range of predictions spanning 20 to 65 per cent of total terrestrial evapotranspiration (14,000 to 41,000 km(3) per year) (refs 1-5). Here we use the distinct isotope effects of transpiration and evaporation to show that transpiration is by far the largest water flux from Earth's continents, representing 80 to 90 per cent of terrestrial evapotranspiration. On the basis of our analysis of a global data set of large lakes and rivers, we conclude that transpiration recycles 62,000 +/- 8,000 km(3) of water per year to the atmosphere, using half of all solar energy absorbed by land surfaces in the process. We also calculate CO2 uptake by terrestrial vegetation by connecting transpiration losses to carbon assimilation using water-use efficiency ratios of plants, and show the global gross primary productivity to be 129 +/- 32 gigatonnes of carbon per year, which agrees, within the uncertainty, with previous estimates(6). The dominance of transpiration water fluxes in continental evapotranspiration suggests that, from the point of view of water resource forecasting, climate model development should prioritize improvements in simulations of biological fluxes rather than physical (evaporation) fluxes.
.
DOI:10.1002/hyp.8205URL [本文引用: 2]
In this study, we aimed to clarify spatial variations in xylem sap flow, and to determine the impacts of these variations on stand-scale transpiration (E) estimates. We examined circumferential and radial variations in sap flow velocity (Fd) measured at several directions and depths in tree trunks of black locust (Robinia pseudoacacia) and native oak (Quercus liaotungensis), both of which have ring-porous wood anatomy, in forest stands on the Loess Plateau, China. We evaluated the impacts of circumferential variations in Fd on stand-scale transpiration estimates using a simple scaling exercise. We found significant circumferential variations in Fd in the outermost xylem in both species (coefficients of variation = 2009000945%). For both species, Fd measured at the inner xylem was smaller than that of the outermost xylem and the Fd at the depth of > 10 mm was almost zero. The simple exercises showed that omitting circumferential variations in Fd affected the E estimate by 1609000921%, which was less than the effects of omitting within-tree radial and tree-to-tree variations in Fd in both species. These results suggest that circumferential variations in Fd can be a minor source of error for E estimates compared with within-tree radial and tree-to-tree variations in Fd, regardless of the significant circumferential variations. Copyright 0008 2011 John Wiley & Sons, Ltd.
.
DOI:10.1002/hyp.6576URL [本文引用: 1]
Transpiration of four different rainforest types in north Queensland, Australia, was determined using the heat pulse technique for periods ranging between 391 and 657 days. Despite the complexity of the natural rainforest systems being studied, the relationship between sample tree size and daily water use was found to be strong, thus providing a robust means by which to scale transpiration from individual trees to the entire forest stand. Transpiration was shown to be dependent on solar radiation and atmospheric demand for moisture with little evidence of limitation by soil moisture supply. Total stand transpiration was controlled by forest characteristics such as stem density, size distribution and sapwood area. Annual transpiration for each of the four sites ranged between 353 mm for cloud forest and 591 mm for montane rainforest. In comparison with the international literature, transpiration from Australian rainforests is low; the reasons for this could be related to a combination of differences in forest structure, climatic conditions, canopy wetness duration and tree physiology. Copyright 2007 John Wiley & Sons, Ltd.
.
DOI:10.1016/j.advwatres.2003.08.001URL
In order to evaluate factors controlling transpiration of six common eastern deciduous species in North America, a model describing responses of canopy stomatal conductance ( G S) to net radiation ( R N), vapor pressure deficit ( D) and relative extractable soil water (REW) was parameterized from sap flux data. Sap flux was measured in 24 mature trees consisting of the species Carya tomentosa, Quercus alba, Q. rubra, Fraxinus americana, Liriodendron tulipifera, and Liquidambar styraciflua in a bottomland oak-hickory forest in the Duke Forest, NC. Species differences in model coefficients were found during the 1997 growing season. All species showed a reduction in G S with increasing D. R N influenced G S in the overstory shade intolerant L. styraciflua to a larger extent than the other species measured. In addition, despite a severe drought during the study period, only L. tulipifera showed a decline in G S with decreasing REW. The primary effect of the drought for the other species appeared to be early autumn leaf senescence and abscission. As a result, despite the drought in this bottomland forest accustomed to ample water supply, maximum daily transpiration (1.6 mm) and growing season transpiration (264 mm) were similar to a nearby upland forest measured during a year of above average precipitation. These results may aid in assessing differences in water use and the ability of bottomland deciduous species to tolerate alterations in the frequency or amount of precipitation. Results also suggest little variation in water use among forests of similar composition and structure growing in different positions in the landscape and subjected to large interannual variation in water supply.
.
DOI:10.1890/ES13-00182.1URL [本文引用: 1]
Abstract Complex systems science provides a transdisciplinary framework to study systems characterized by (1) heterogeneity, (2) hierarchy, (3) self-organization, (4) openness, (5) adaptation, (6) memory, (7) non-linearity, and (8) uncertainty. Complex systems thinking has inspired both theory and applied strategies for improving ecosystem resilience and adaptability, but applications in forest ecology and management are just beginning to emerge. We review the properties of complex systems using four well-studied forest biomes (temperate, boreal, tropical and Mediterranean) as examples. The lens of complex systems science yields insights into facets of forest structure and dynamics that facilitate comparisons among ecosystems. These biomes share the main properties of complex systems but differ in specific ecological properties, disturbance regimes, and human uses. We show how this approach can help forest scientists and managers to conceptualize forests as integrated social-ecological systems and provide concrete examples of how to manage forests as complex adaptive systems.
.
DOI:10.1093/treephys/tpt029URLPMID:23640874 [本文引用: 3]
Understanding radial and azimuthal variation, and tree-to-tree variation, in sap flux density (Fd) as sources of uncertainty is important for estimating using sap flow techniques. In a (D. Don.) forest, Fd was measured at several depths and aspects for 18 trees, using (Granier-type) sensors. We observed considerable azimuthal variation in Fd. The coefficient of variation (CV) calculated from Fd at a depth of 0-20 mm () and Fd at a depth of 20-40 mm () ranged from 6.7 to 37.6% (mean65=6528.3%) and from 19.6 to 62.5% (mean65=6534.6%) for the -azimuthal directions. Fd at the north aspect averaged for nine trees, for which azimuthal measurements were made, was -obviously smaller than Fd at the other three aspects (i.e., west, south and east) averaged for the nine trees. averaged for the nine trees was significantly larger than averaged for the nine trees. The error for stand-scale (E) estimates caused by ignoring the azimuthal variation was larger than that caused by ignoring the radial variation. The error caused by ignoring tree-to-tree variation was larger than that caused by ignoring both radial and azimuthal variations. Thus, tree-to-tree variation in Fd would be more important than both radial and azimuthal variations in Fd for E estimation. However, Fd for each tree should not be measured at a consistent aspect but should be measured at various aspects to make accurate E estimates and to avoid a risk of error caused by the relationship of Fd to aspect.
.
DOI:10.1016/j.jhydrol.2016.03.028URL [本文引用: 2]
Quantification of stemflow is necessary for the assessment of forest ecosystem hydrological effects. Nevertheless, variation of stemflow among plant functional groups is currently not well understood. Stemflow production of co-occurring evergreen broadleaved trees (Cyclobalanopsis multinervisandCyclobalanopsis oxyodon) and deciduous broadleaved trees (Fagus englerianaandQuercus serratavar. brevipetiolata) was quantified through field observations in a mixed evergreen and deciduous broadleaved forest. The research results revealed that stemflow increased linearly with increasing rainfall magnitude, with precipitation depths of 6.9, 7.2, 10.0 and 14.8mm required for the initiation of stemflow forC. multinervis,C. oxyodon,F. englerianaandQ. serrata, respectively. Stemflow percentage and funneling ratio (FR) increased with increasing rainfall in a logarithmic fashion. Stemflow percentage andFRtended to grow rapidly with increasing rainfall magnitude up to a rainfall threshold of 50mm, above which, further rainfall increases brought about only small increases. ForC. multinervis,C. oxyodon,F. englerianaandQ. serrata,FRaveraged 19.8, 14.8, 8.9 and 2.8, respectively. The stemflow generating rainfall thresholds for evergreen species were smaller than for deciduous species. Furthermore, stemflow percentage andFRof the former was greater than the latter. For both evergreen species and deciduous species, overall funneling ratio (FRs) decreased with increasing basal area. We concluded that: (1) although stemflow partitioning represented a fairly low percentage of gross rainfall in mixed evergreen and deciduous broadleaved forests, it was capable of providing substantial amount of rainwater to tree boles; (2) the evergreen species were more likely to generate stemflow than deciduous species, and directed more intercepted rainwater to the root zone; (3) small trees were more productive in funneling stemflow than larger trees, which may provide a favorable condition for the survival and growth of small trees when competing with larger trees.
.
DOI:10.1016/j.agrformet.2014.08.009URL [本文引用: 1]
Tree transpiration is regulated by short-term physiological adjustments and long-term shifts in hydraulic architecture in response to fluctuating evaporative demand and water supply. Despite the tight interdependence of plant water loss and carbon uptake and its crucial implications for plant growth and survival under drought conditions, the underlying mechanisms remain incompletely represented in most state-of-the-art mechanistic models. Important process information is resolved in tree transpiration (sap flow) data, which are the measurable outcome of water transport through the soil-plant-atmosphere continuum under variable environmental conditions. Here, we assimilated sap flow data measured in two Scots pine stands from climatically contrasting sites one of which experiencing a strong drought during the study period in NE Spain into a process-based ecophysiological model (SPA) using the Ensemble Kalman Filter (EnKF) in order to: (1) distinguish differences in hydraulic characteristics between sites and between healthy and defoliated individuals within a site; (2) identify possible structural model deficiencies, particularly regarding temporal changes in plant hydraulic conductance which the model assumes constant; and (3) derive implications for gross photosynthesis and carbon cycling. In terms of stomatal control, the assimilation of sap flow data into SPA showed a more conservative water use under dry conditions. Time-varying plant conductivity substantially improved model performance under severe drought, while seasonally varying capacitance and stomatal efficiency only resulted in marginal improvements. Not accounting for this seasonal variability would translate into a 30鈥60% overestimation of modelled GPP during drought. Our results suggest that an explicit representation of mechanisms leading to temporal changes in hydraulic conductivity (i.e., xylem embolism) is required for models to reproduce tree functioning under extreme drought.
URL [本文引用: 1]
位于我国西北干旱区的祁连山,地处青藏高原、黄土高原和蒙新荒漠的交会地带,其生态环境不仅受区域条件的限制,而且对全球变化响应敏感。长期以来,祁连山区人口为了维持自身的生存,对该区生态系统产生了各种干扰,不仅导致草场退化、土壤侵蚀加剧而且对森林造成了严重破坏。祁连山森林生态系统与整个山区生态过程和水文过程的相互作用和耦合关系十分密切,它一方面通过调控物质循环和能量流捍卫着冰源水库(冰川和积雪)的安全,另一方面通过对山区水文路径的调节担当着涵养水源、净化水质、保持水土资源和维护生物多样性的重任。但是,森林和水的相互作用受多种因素影响,使得森林植被生态过程和水文过程的作用机理尚不明确。因此,本研究以祁连山区青海云杉林为研究对象,通过对该植被系统生态过程、水文过程及其相互作用过程的研究,定量的揭示青海云杉林植被系统的水文循环机理及其对山区水文路径的调节机制,深入理解祁连山区各种水文现象的发生规律及其内在联系,为建立合理的区域水资源管理模式提供科学依据。本研究取得的主要结论如下: (1)试验区日均气温和日最高气温具有明显的季节变化;林内空气相对湿度基本维持在60%左右;林内风速总体上小于0.5 m·s-1;林内太阳辐射强度最高仅为86.6 W·m-2。试验区降水具有明显的季节分布特征,2008年整个生长季(5-9月)的降雨量占年降水量的78.7%,且主要以低降雨量和低降雨强度的降雨事件为主。林内土壤温度和土壤体积含水量的垂直分布在不同月份呈现不同的变化特征,且不同深度土壤的温度和体积含水量的年内变化总体上呈先增大后减小趋势。 (2)实验观测期间内(2008年6月12日至2008年10月8日),青海云杉林的穿透雨量、截留量和干流量分别为212.6mm、64.5mm和3.4mm,分别占大气降雨量的75.8%、23.0%和1.2%。林内穿透雨随大气降雨量的增大而增大,且在空间分配上具有异质性;在没有前日降雨的情况下,当降雨量达到5.6mm时青海云杉林才开始产生树干茎流,且干流量随降雨量的增大而增大,34场降雨的平均干流率为0.58%;林冠截留率随降雨量的增大先急剧减小后逐渐趋于稳定,实验观测期间的平均截留率为33.9%。 (3)采用改进的Penman-Monteith修正式估算的青海云杉林2008年整个生长季的蒸腾耗水量为160.8 mm,平均日蒸腾量为1.05 mm,且日蒸腾量从5月开始逐渐增大,在7月中上旬达最大值,随后其值逐渐减小。单变量敏感性分析法对模拟蒸腾量的分析表明,林冠层接收的净辐射和林地叶面积指数对模拟结果的影响最大,其次是气温和风速,而空气相对湿度的影响最小;当模型输入参数在±10%变动时,模拟蒸腾量的变化幅度均10%,说明该模型的模拟结果比较稳定,有很大的可信性。 (4)采用改进的Penman-Monteith修正式估算的青海云杉林2008年整个生长季的林地土壤蒸发量为51.9mm,平均日土壤蒸发量为0.34mm,且模拟的日土壤蒸发量没有明显的季节变化。利用自制小型桶式蒸渗仪观测的青海云杉林非雨天的林地土壤蒸发平均为1.25 mm·d-1,最大可达2.82 mm·d-1。在试验观测期间内的38个非雨天,蒸渗仪实测的土壤蒸发量明显高于Penman-Monteith修正式的估算值,但两者的变化趋势基本一致。 (5)基于改进的Penman-Monteith修正式估算的青海云杉林2008年整个生长季的蒸散量为313.6 mm。其中,林冠截留蒸发量、冠层蒸腾量和林地土壤蒸发量依次为100.9 mm、160.8mm和51.9mm,分别占总蒸散量的32.2%、51.3%和16.5%。采用Penman-Monteith修正式估算的青海云杉林的蒸散量与涡动相关系统实测的蒸散量相差不大,尤其是在连续晴天期间,两者吻合得很好,且月蒸散量变化呈先增大后减小趋势。 (6)研究区大部分降雨以林内雨的形式进入林下并贮存于土壤中,同时季节性冻土随气温的升高逐渐融化,也使得土壤含水量剧增,最终导致土壤储水量在2008年整个生长季内可增加191.5mm。未考虑冻土的存在和考虑其存在,根据水量平衡方程推算的青海云杉林2008年整个生长季的总蒸散量分别为187.5mm和306.7mm,分别比基于改进的Penman-Monteith修正式估算的蒸散量低126.1mm和6.9mm。
.
DOI:10.1016/j.foreco.2013.03.003URL [本文引用: 1]
Transpiration is a fundamental datum in understanding the ecophysiology of planted forests in dry regions and is central to the construction of an ecosystem-level water balance. The present aims were: (i) to measure daily transpiration in a dryland Pinus halepensis Mill. (Aleppo pine) forest and to examine its relationship to environmental conditions such as soil water content and evaporative demand; (ii) to determine the seasonal and annual water balances of the ecosystem; and (iii) to explore management implications in the context of a climate-change scenario of increasing aridity. The study was conducted in the Yatir forest (300treesha611) in Israel’s semiarid northern Negev, during three consecutive years (starting 2003/4) in which rainfall (R) was 231, 334 and 224mm, the last designated a drought because of relatively long dry spells between major rain events. Tree transpiration was measured by the heat-pulse method and values were upscaled to the forest canopy level. Independent estimates were obtained for daily ecosystem-level evapotranspiration (ET), and soil and understory vegetation evapotranspiration (E). Daily canopy-level transpiration rate (T) ranged from 0.1 to 1.6mmd611 and showed a highly dynamic and irregular pattern during the rainy season. For the two non-drought years a large part of the variation in T could be attributed to the following simple relationships. When soil water content (SWC) 810.15m3m613, the primary driver of T was SWC; regression of T on SWC yielded highly significant quadratic relationships indicating little response below SWC of approximately 0.12m3m613, and a steep linear response above it. For SWC >0.15m3m613, potential evapotranspiration (PET) was of paramount importance; quadratic regression of T on PET yielded highly significant relationships and explained a high proportion of the variance in T. During the wet season (215d), on average, cumulative ET (201mm) accounted for 0.76 R (R=263mm) and cumulative T (116mm; range 103–126mm) – an independently estimated component of cumulative ET – accounted for 0.45 R. Cumulative E was 70mm. On an annual basis, total evapotranspiration losses were approximately equal to R, with 58% exiting the system via the trees and 39% via soil and undergrowth vegetation. Water balance data combined with assumptions regarding tree minimum transpiration led to a first approximation of sustainable forest density. This approach indicated that the Yatir forest should be thinned to stands of 250 or 190treesha611 in order to remain sustainable under annual rainfall regimes of 200 or 150mm, respectively.
DOI:10.1007/s00468-014-1105-zURL [本文引用: 1]
Key message Our study shows that sap flow in Avicennia marina varies significantly throughout the sapwood and that spatial patterns in sap flux density are dependent on meteorological conditions.
.
DOI:10.1016/S0168-1923(00)00199-4URL [本文引用: 1]
A multi-year, multi-technique study was conducted to measure evapotranspiration and its components within an uneven-aged mixed deciduous forest in the Southeastern United States. Four different measurement techniques were used, including soil water budget (1 year), sap flow (2 years), eddy covariance (5 years), and catchment water budget (31 years). Annual estimates of evapotranspiration were similar for the eddy covariance and catchment water balance techniques, averaging 571 16 mm (eddy covariance) and 582 28 mm (catchment water balance) per year over a 5-year period. There were qualitative similarities between sap flow and eddy covariance estimates on a daily basis, and sap flow estimates of transpiration were about 50% of annual evapotranspiration estimated from eddy covariance and catchment studies. Soil evaporation was estimated using a second eddy covariance system below the canopy, and these measurements suggest that soil evaporation explains only a small portion of the difference between sap flow estimates of transpiration and eddy covariance and catchment water budget estimates of evapotranspiration. Convergence of the catchment water balance and eddy covariance methods and moderately good energy balance closure suggests that the sap flow estimates could be low, unless evaporation of canopy-intercepted water was especially large. The large species diversity and presence of ring-porous trees at our site may explain the difficulty in extrapolating sap flow measurements to the spatial scales representative of the eddy covariance and catchment water balance methods. Soil water budget estimates were positively correlated with eddy covariance and sap flow measurements, but the data were highly variable and in error under conditions of severe surface dryness and after rainfall events.
Predictive models for radial sap flux variation in coniferous, diffuse-porous and ring-porous temperate trees
2
2016
... 单木蒸腾量的估算需要基于测量点观测结果进行尺度转换(
... 根据上文计算方法, 2β700 m样地的各单木及林分蒸腾量见
An improved heat pulse method to measure low and reverse rates of sap flow in woody plants
1
2001
... 热比率法树干液流测量过程中, 将两个温度探针等距插在热探针的上下方, 探针间垂直距离为 5 mm.每个温度探针上, 在距离探头顶端7.5 mm和22.5 mm的地方分别内置一个热电偶, 用于感应来自热探头的热脉冲, 最后, 根据热脉冲发射和接收时的温度差计算两测量点间的液流速率(
a). Radial pattern of sap flow and response to microclimate and soil moisture in Qinghai spruce (Picea crassifolia) in the upper Heihe River Basin of arid northwestern China.
1
2014
... 近年来, 随着祁连山人工林种植面积的增加(
(
5
... 近年来, 随着祁连山人工林种植面积的增加(
... 通过大量砍伐观测单木获取边材面积显然是不可取的,
... 发现青海云杉胸径与边材面积间存在良好的函数关系, 为青海云杉边材面积计算提供了更为便捷的估算方法.但
... 根据上文计算方法, 2β700 m样地的各单木及林分蒸腾量见
... 林分蒸腾量计算中, 如果只对胸径大于10 cm的单木液流速率进行林分蒸腾量估算,
中国人工林发展现状、问题与对策
1
2014
... 近年来, 随着祁连山人工林种植面积的增加(
中国人工林发展现状、问题与对策
1
2014
... 近年来, 随着祁连山人工林种植面积的增加(
Processes driving nocturnal transpiration and implications for estimating land evapotranspiration
3
2015
... 近年来, 随着祁连山人工林种植面积的增加(
... ;
... ;
Vertical foliage distribution determines the radial pattern of sap flux density in Picea abies.
1
2008
... 在基于单木的林分蒸腾估算中, 已有研究均采用观测单木液流速率的平均值和林分边材总面积估算林分蒸腾量(
Variability in radial sap flux density patterns and sapwood area among seven co-occurring temperate broad-leaved tree species
2008
Effect of forest on annual water yield in the mountains of an arid inland river basin: A case study in the Pailugou catchment on northwestern China’s Qilian Mountains
2
2012
... 祁连山是中国西部干旱、半干旱区多条内陆河的产水区, 其中段北坡为中国第二大内陆河黑河上游, 流域上游产水是维持中下游居民生活、生产用水和生态环境稳定的重要保障.在森林覆盖率较大的流域, 森林是流域的重要耗水区(
... 研究区位于中国西北部祁连山中段北坡的排露沟小流域, 地理位置为38.40° N, 100.28° E.流域面积为2.91 km2, 地形复杂多变, 海拔2β650-3β800 m.流域出口年降水量为376 mm, 其中约65%的降水集中在7至9月, 随海拔升高, 每100 m降水量增加约4.3% (
Simulation of stand transpiration based on a xylem water flow model for individual trees
1
2013
... 林分蒸腾量估算是蒸腾量尺度转换的关键(
Terrestrial water fluxes dominated by transpiration
1
2013
... 祁连山是中国西部干旱、半干旱区多条内陆河的产水区, 其中段北坡为中国第二大内陆河黑河上游, 流域上游产水是维持中下游居民生活、生产用水和生态环境稳定的重要保障.在森林覆盖率较大的流域, 森林是流域的重要耗水区(
Spatial variation in sap flow velocity in semiarid region trees: Its impact on stand-scale transpiration estimates
2
2012
... 近年来, 随着祁连山人工林种植面积的增加(
... 林分蒸腾量估算是蒸腾量尺度转换的关键(
Measurements of transpiration in four tropical rainforest types of north Queensland, Australia
1
2007
... 冠层蒸腾量的准确计算是流域水量平衡计算的一个关键环节和参数(
Species differences in stomatal control of water loss at the canopy scale in a mature bottomland deciduous forest
2003
Terrestrial water fluxes dominated by transpiration: Comment
1
2014
... 近年来, 随着祁连山人工林种植面积的增加(
Azimuthal and radial variations in sap flux density and effects on stand-scale transpiration estimates in a Japanese cedar forest
3
2013
... 近年来, 随着祁连山人工林种植面积的增加(
... ), 测量精度已在全球诸多研究中得到广泛论证, 同时测量技术也在不断地完善和规范(
... 林分蒸腾量估算是蒸腾量尺度转换的关键(
Inter- and intra-?specific variation in stemflow for evergreen species and deciduous tree species in a subtropical forest
2
2016
... 近年来, 随着祁连山人工林种植面积的增加(
... ., 2015;
Time variable hydraulic parameters improve the performance of a mechanistic stand transpiration model. A case study of Mediterranean Scots pine sap flow data assimilation
1
2014
... 近年来, 随着祁连山人工林种植面积的增加(
祁连山区青海云杉林生态水文过程研究
1
2011
... 祁连山是中国西部干旱、半干旱区多条内陆河的产水区, 其中段北坡为中国第二大内陆河黑河上游, 流域上游产水是维持中下游居民生活、生产用水和生态环境稳定的重要保障.在森林覆盖率较大的流域, 森林是流域的重要耗水区(
祁连山区青海云杉林生态水文过程研究
1
2011
... 祁连山是中国西部干旱、半干旱区多条内陆河的产水区, 其中段北坡为中国第二大内陆河黑河上游, 流域上游产水是维持中下游居民生活、生产用水和生态环境稳定的重要保障.在森林覆盖率较大的流域, 森林是流域的重要耗水区(
Transpiration and annual water balance of Aleppo pine in a semiarid region: Implications for forest management
1
2013
... 近年来, 随着祁连山人工林种植面积的增加(
Influence of temporospatial variation in sap flux density on estimates of whole-tree water use in
1
2015
... 近年来, 随着祁连山人工林种植面积的增加(
A comparison of methods for determining forest evapotranspiration and its components: Sap-flow, soil water budget, eddy covariance and catchment water balance
1
2001
... 在基于单木的林分蒸腾估算中, 已有研究均采用观测单木液流速率的平均值和林分边材总面积估算林分蒸腾量(
Copyright © 2021 版权所有 《植物生态学报》编辑部
地址: 北京香山南辛村20号, 邮编: 100093
Tel.: 010-62836134, 62836138; Fax: 010-82599431; E-mail: apes@ibcas.ac.cn, cjpe@ibcas.ac.cn
备案号: 京ICP备16067583号-19
